T H Y R O I D - T R H - T S H
Mice Lacking the Calcineurin Inhibitor Rcan2 Have an Isolated Defect of Osteoblast Function J. H. Duncan Bassett, John G. Logan, Alan Boyde, Moira S. Cheung, Holly Evans, Peter Croucher, Xiao-yang Sun, Sai Xu, Yoshiharu Murata, and Graham R. Williams Molecular Endocrinology Group (J.H.D.B., J.G.L., M.S.C., G.R.W.), Department of Medicine, Imperial College London, Hammersmith Campus, London W12 0NN, United Kingdom; Centre for Oral Growth and Development (A.B.), Queen Mary College, University of London, London E1 4NS, United Kingdom; The Mellanby Centre for Bone Research (H.E., P.C.), Department of Human Metabolism, University of Sheffield, Sheffield S10 2RX, United Kingdom; Garvan Institute for Medical Research (P.C.), Sydney, New South Wales 2010, Australia; and Department of Genetics (X.S., S.X., Y.M.), Research Institute of Environmental Medicine, Nagoya University, Nagoya 464-8601, Japan
Calcineurin-nuclear factor of activated T cells signaling controls the differentiation and function of osteoclasts and osteoblasts, and regulator of calcineurin-2 (Rcan2) is a physiological inhibitor of this pathway. Rcan2 expression is regulated by T3, which also has a central role in skeletal development and bone turnover. To investigate the role of Rcan2 in bone development and maintenance, we characterized Rcan2⫺/⫺ mice and determined its skeletal expression in T3 receptor (TR) knockout and thyroid-manipulated mice. Rcan2⫺/⫺ mice had normal linear growth but displayed delayed intramembranous ossification, impaired cortical bone formation, and reduced bone mineral accrual during development as well as increased mineralization of adult bone. These abnormalities resulted from an isolated defect in osteoblast function and are similar to skeletal phenotypes of mice lacking the type 2 deiodinase thyroid hormone activating enzyme or with dominantnegative mutations of TR␣, the predominant TR isoform in bone. Rcan2 mRNA was expressed in primary osteoclasts and osteoblasts, and its expression in bone was differentially regulated in TR␣ and TR knockout and thyroid-manipulated mice. However, in primary osteoblast cultures, T3 treatment did not affect Rcan2 mRNA expression or nuclear factor of activated T cells c1 expression and phosphorylation. Overall, these studies establish that Rcan2 regulates osteoblast function and its expression in bone is regulated by thyroid status in vivo. (Endocrinology 153: 3537–3548, 2012)
egulator of calcineurin (RCAN)-2 belongs to a family of conserved proteins (RCAN1, RCAN2, and RCAN3) that inhibit calcineurin (1, 2). Calcineurin is a Ca2⫹- and calmodulin-activated serine-threonine protein phosphatase that consists of a calmodulin-binding catalytic subunit and Ca2⫹-binding regulatory subunit (3). Activation of calcineurin results in dephosphorylation of nuclear factor of activated T cells (NFAT), enabling it to enter the nucleus and regulate gene expression in association with other transcription factors, including activator protein 1 (1, 2, 4, 5). Interaction of RCAN2 with the cat-
R
alytic subunit of calcineurin blocks NFAT-regulated gene expression (6, 7), indicating RCAN2 is a physiological inhibitor of calcineurin-NFAT signaling. Calcineurin and NFAT are essential for osteoclast differentiation and bone resorption. NFAT is a master transcription factor for osteoclast differentiation, functioning as a point of convergence for the receptor activator of nuclear factor-B ligand, TNF receptor-associated factor 6 and c-Fos signaling pathways required for osteoclastogenesis (8). In addition to its important role in osteoclasts, NFAT also regulates bone mass by acting in osteoblasts, in
ISSN Print 0013-7227 ISSN Online 1945-7170 Printed in U.S.A. Copyright © 2012 by The Endocrine Society doi: 10.1210/en.2011-1814 Received September 28, 2011. Accepted April 26, 2012. First Published Online May 16, 2012
Abbreviations: BFR, Bone formation rate; BS, bone surface; BSE, backscattered electron; CT, computed tomography; DIO2, type 2 deiodinase enzyme; MAR, mineral apposition rate; MS, mineralizing surface; NFAT, nuclear factor of activated T cells; nt, nucleotide; Oc.N, osteoclast numbers; Oc.S, osteoclast surface; P, postnatal day; qBSE-SEM, quantitative BSE-SEM; RCAN, regulator of calcineurin; SEM, scanning electron microscopy; TR, T3 receptor; TRAP, tartrate-resistant acid phosphatase; WT, wild type.
Endocrinology, July 2012, 153(7):3537–3548
endo.endojournals.org
3537
3538
Bassett et al.
Rcan2 and Osteoblast Function
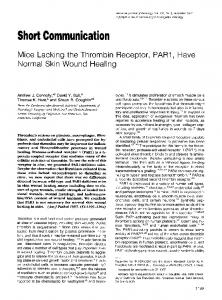
which its functions are more controversial. Initial studies in mice with global disruption or activation of calcineurinNFAT signaling suggested the pathway stimulates osteoblast differentiation and bone formation in vivo and in vitro (9 –11), whereas recent studies specifically targeting osteoblasts suggest the calcineurin-NFAT pathway is a negative regulator of osteoblast differentiation and bone formation that also inhibits osteoclastogenesis indirectly via its effects on osteoprotegerin and receptor activator of nuclear factor-B ligand in osteoblasts (12). The negative effects on bone formation are supported by findings that low doses of the calcineurin antagonist cyclosporin A increase osteoblast differentiation and bone mass (13). Nevertheless, cyclosporin A has biphasic effects on osteoblasts (12), and treatment of organ transplant patients with calcineurin inhibitors is associated with high bone turnover osteoporosis (14). Taken together, these data indicate the regulatory effects of the calcineurin-NFAT pathway on bone turnover are complex and involve direct actions in osteoblasts and osteoclasts as well as indirect osteoblastmediated effects on osteoclastogenesis. The human homolog of RCAN2 (previously named ZAKI-4) was originally identified as a thyroid hormone (T3)-responsive gene in skin fibroblasts by differential display (15), and ZAKI-4␣ and - mRNA isoforms were identified subsequently (16). RCAN2–3 expression (previously named ZAKI-4␣) is restricted to brain and encodes a 197-amino acid short protein isoform RCAN2-S. By contrast, RCAN2–1 (previously named ZAKI-4) is distributed widely, with the highest levels of expression in brain, heart, skeletal muscle, and kidney, and encodes a 243-amino acid long protein isoform RCAN2-L (2, 16) (Fig. 1). Although the two isoforms display tissue-specific differences in expression, it is unknown whether they are functionally distinct. Nevertheless, only RCAN2–3 (ZAKI-4␣) mRNA was found to be T3 responsive in fibroblasts (16), and this response was mediated by a nongenomic signaling cascade involving T3 receptor (TR)-, phosphatidylinositol 3-kinase-Akt/protein kinase B, and mammalian target of rapamycin (17). T3 treatment also
Endocrinology, July 2012, 153(7):3537–3548
resulted in reduced endogenous calcineurin activity, and RCAN2 proteins were shown to interact directly with calcineurin and inhibit calcineurin-NFAT signaling, indicating RCAN2 is a T3-responsive endogenous inhibitor of the calcineurin-NFAT pathway (16). In developing brain, Rcan2 mRNA was expressed widely, increased with age, and colocalized with the expression of calcineurin in some regions. The temporal increase in Rcan2 expression during brain maturation was blunted in hypothyroid animals (18, 19). In particular, Rcan2–3 mRNA expression was reduced in cerebral cortex in hypothyroid mice, but levels in other brain regions were not affected by thyroid status (19). Thus, Rcan2modulated calcineurin activity was suggested to influence brain development leading to the hypothesis that reduced Rcan2 expression could account for some of the adverse consequences of hypothyroidism during brain development (18, 19). In additional studies, the expression of Rcan2–1 in the heart was increased after T3 administration (19, 20), but no effects were observed in other tissues in response to hyperthyroidism (19). Taken together, these findings indicate that T3 regulation of Rcan2–3 and Rcan2–1 expression in vivo is isoform and tissue specific and suggest that Rcan2 may mediate some of the effects of thyroid hormones in T3-target tissues (18 –20). Although Rcan2 functions as an endogenous inhibitor of the calcineurin-NFAT signaling, it is not known whether Rcan2 is also expressed in bone. To investigate and determine the physiological importance of Rcan2 in bone, we generated Rcan2⫺/⫺ knockout mice and characterized their skeletal phenotype. We further hypothesized that Rcan2 may be a T3-responsive target gene in the skeleton because both T3 and the calcineurin-NFAT pathway regulate bone mass via actions in osteoblasts and osteoclasts (8, 12, 21). Thus, we also investigated expression of Rcan2 in skeletal cells and in T3 receptor mutant and thyroid manipulated mice. The effect of T3 on Rcan2 expression and downstream signaling was investigated in primary osteoblast cultures.
Materials and Methods Rcan2⫹/⫺ and Rcan2⫺/⫺ mice
FIG. 1. Mouse Rcan2 gene. Genomic organization of the mouse Rcan2 gene showing the alternative splicing events that lead to expression of Rcan2–1 and Rcan2–3 isoforms. The locations of RT-PCR primers are also shown.
Rcan2 knockout mice (Rcan2⫺/⫺) were generated by replacing exon 4, common to both Rcan2–1 (ZAKI-4) and Rcan2–3 (ZAKI-4␣), with a LacZ/Neo cassette, and Northern blot analysis confirmed the absence of both transcripts in Rcan2⫺/⫺ mice (22) (Fig. 1). Heterozygous Rcan2⫹/⫺ mice were backcrossed and established in a C57B/6J genetic background in the animal facility at the Research Institute of Environmental Medicine (Nagoya University, Nagoya, Japan) using protocols approved by the institutional review board. The adult mice were given two ip
Endocrinology, July 2012, 153(7):3537–3548
endo.endojournals.org
3539
FIG. 2. Skeletal development and growth in Rcan2⫺/⫺ mice. A, Upper and lower limbs show detail of the upper limb paws and rib cages from P1 WT, Rcan2⫹/⫺, and Rcan2⫺/⫺ mice stained with alcian blue (cartilage) and alizarin red (bone). B, Proximal tibia growth plates from P28 WT, Rcan2⫹/⫺, and Rcan2⫺/⫺ mice stained with alcian blue and van Gieson (osteoid) (⫻50 and ⫻200). E, Epiphysis; GP, growth plate; RZ, reserve zone; PZ, proliferative zone; HZ, hypertrophic zone. Bars, 200 m. C, Growth plate and chondrocyte zone heights in P28 mice (n ⫽ 3 per genotype) and linear growth analysis from birth to P112 (n ⫽ 3– 4 per genotype). No statistical differences, ANOVA, Rcan2⫹/⫺, and Rcan2⫺/⫺ vs. WT. Humerus middiaphysis cortical bone thickness at P28 (n ⫽ 4 per genotype), ANOVA, Rcan2⫹/⫺, and Rcan2⫺/⫺ vs. WT. *, P ⬍ 0.05, Tukey’s post hoc test. D, Skulls and clavicles from P1 WT, Rcan2⫹/⫺, and Rcan2⫺/⫺ mice. Bars, 1000 m. E, Area of skull fontanelles, clavicle angle, and length in P1 WT, Rcan2⫹/⫺, and Rcan2⫺/⫺ mice (n ⫽ 4 per genotype), ANOVA, Rcan2⫹/⫺, and Rcan2⫺/⫺ vs. WT. *, P ⬍ 0.05, Tukey’s post hoc test.
injections of calcein (15 mg/kg in saline with 2% NaHCO3) 7 and 4 d before the animals were killed at postnatal day (P) 112.
Manipulation of thyroid status in wild-type (WT) mice Hypothyroid mice were fed a low iodine diet containing 0.15% (wt/vol) of the antithyroid drug propylthiouracil from P70 for 6 wk. Hyperthyroid mice were treated with TSH-suppressive doses of T4 (1.2 g/ml in drinking water) from P70 for 6 wk. Manipulation of thyroid status was performed under license in compliance with the Animals (Scientific Procedures) Act 1986, and the studies were approved by the local Imperial College London Biological Services Unit ethical review process.
Skeletal preparations and histology P1 mice and limbs from older animals were stained with alizarin red and alcian blue (23, 24) and photographed using a Leica MZ75 binocular microscope, KL1500 light source, DFC320 digital camera, and IM50 Digital Image Manager (all from Leica AG, Heerbrugg, Switzerland). The angle of the clavicle, skull dimensions, and open fontanelle and suture areas were calcu-
lated using ImageJ 1.43n (http://rsb.info.nih.gov/ij/). Limbs were fixed in 10% neutral buffered formalin and decalcified in 10% EDTA. Sections were stained with van Gieson and alcian blue. Proliferative and hypertrophic zones in growth plate sections were identified as described (25–27). Measurements from at least four separate positions across the width of tibial growth plates were obtained using a Leica DM LB2 microscope and Leica DFC320 digital camera to calculate mean values for the heights of the reserve, proliferative, and hypertrophic zones and total growth plate. Results from two levels of sectioning were compared with ensure consistency.
Faxitron digital x-ray microradiography Digital x-ray images were recorded at 10 m resolution using a Faxitron MX20 variable kilovolt point projection x-ray source and digital image system operating at 26 kV and ⫻5 magnification (Qados; Cross Technologies PLC, Berkshire, UK). Images were calibrated with a digital micrometer and bone lengths and caudal vertebra heights determined using ImageJ [National Institutes of Health (NIH)]. Cortical bone thickness and diameter were determined at 10 locations in the middiaphysis. Relative
3540
Bassett et al.
Rcan2 and Osteoblast Function
Endocrinology, July 2012, 153(7):3537–3548
ImageJ (NIH), and the histogram stretched between polyester (gray level 0) and steel (gray level 255) standards. Gradations of mineralization density were represented in 16 equal intervals by a pseudocolor scheme (28).
Biomechanical testing
FIG. 3. Faxitron and biomechanical analysis in Rcan2⫺/⫺ mice during growth. A, Images of humerus and vertebrae from P28 WT, Rcan2⫹/⫺, and Rcan2⫺/⫺ mice. Gray-scale images were pseudocolored according to a 16-color palette in which low mineral content is black and high mineral content is white. Bars, 1000 m. No statistical differences in humerus length or caudal vertebra height, ANOVA, Rcan2⫹/⫺, and Rcan2⫺/⫺ vs. WT were seen. B, Relative and cumulative frequency histograms of bone mineralization densities (n ⫽ 3 per genotype). Kolmogorov-Smirnov test, Rcan2⫹/⫺, or Rcan2⫺/⫺ vs. WT. **, P ⬍ 0.01; ***, P ⬍ 0.001. C, Representative load-displacement curves from destructive three-point bend testing of P28 WT, Rcan2⫹/⫺, and Rcan2⫺/⫺ humeri showing yield load, maximum load, fracture load, and the gradient of the linear elastic phase (stiffness). Load-displacement curves from compression testing of P28 WT, Rcan2⫹/⫺, and Rcan2⫺/⫺ caudal vertebrae show yield load, maximum load, and stiffness. D, Graphs showing yield, maximum, and fracture loads and stiffness of WT, Rcan2⫹/⫺, and Rcan2⫺/⫺ humeri. No statistical differences, ANOVA (n ⫽ 4 per genotype), were seen. Graphs showing yield and maximum loads and stiffness of WT, Rcan2⫹/⫺, and Rcan2⫺/⫺ vertebrae. No statistical differences, ANOVA (n ⫽ 4 per genotype), were seen.
mineral content was determined by comparison with steel, aluminum wire, and polyester fiber standards. The 2368 ⫻ 2340 16-bit DICOM images were converted to 8-bit Tiff images using
Bones were stored and tested in 70% ethanol. Destructive three-point bend tests were performed using an Instron 5543 load frame and 100 N load cell (Instron Ltd., High Wycombe, Buckinghamshire, UK). Bones were positioned horizontally and centered on custom supports, and the load was applied vertically to the midshaft with a constant rate of displacement of 0.03 mm/ sec until fracture. A span of 5.6 mm was used. Biomechanical variables were derived from the load displacement curves as described previously (28 –31). Destructive compression tests were also performed on caudal vertebrae 6 and 7 (Ca6 and Ca7) using a 500 N load cell. Vertebral height and diameter was determined using ImageJ (NIH). Parallel surfaces were cut through adjacent intervertebral discs, and vertebrae were fixed to the center of the lower compression anvil with cyanoacrylate glue. The load was applied vertically with a constant rate of displacement of 0.03 mm/sec until failure with load displacement data acquired at 100 Hz. Load-displacement curves were plotted and yield load, displacement at yield, maximum load, displacement at maximum load, and stiffness were determined. Work energy was calculated from the area under the load displacement curve at maximum load. Elastic stored energy at maximum load was determined by calculating the area of a right-angled triangle with the vertex at the point of maximum load and a hypotenuse with a slope equal to that of the linear phase of the load-displacement curve. Energy dissipated at maximum load was calculated by subtracting the elastic stored energy from the work energy at maximum load.
Backscattered electron (BSE) scanning electron microscopy (SEM)
Long bones were fixed in 70% ethanol and opened longitudinally along anatomical curvatures as described (28). Samples were coated with carbon and imaged using backscattered electrons at 20 kV beam potential in a Zeiss DSM962 digital scanning electron microscope equipped with an annular solid state BSE detector (KE Electronics, Toft, Cambridgeshire, UK). The images provide detailed views of bone
Endocrinology, July 2012, 153(7):3537–3548
TABLE 1.
3541
3 point bend and compression testing Yield load (N )
WT Rcan2⫹/⫺ Rcan2⫺/⫺ WT Rcan2⫹/⫺ Rcan2⫺/⫺ WT Rcan2⫺/⫺ WT Rcan2⫺/⫺
endo.endojournals.org
P28 P28 P28 P28 P28 P28 P112 P112 P112 P112
Humerus 4.3 ⫾ 0.6 Humerus 3.6 ⫾ 0.2 Humerus 3.4 ⫾ 0.3 Ca6⫹Ca7 13.9 ⫾ 2.2 Ca6⫹Ca7 10.5 ⫾ 0.3 Ca6⫹Ca7 9.8 ⫾ 1.4 Humerus 8.2 ⫾ 0.1 Humerus 8.3 ⫾ 0.5 Ca6⫹Ca7 88 ⫾ 9 Ca6⫹Ca7 77 ⫾ 6
Maximum Load (N )
Fracture Load (N)
5.1 ⫾ 0.7 4.7 ⫾ 0.3 4.1 ⫾ 0.5 17.2 ⫾ 2.2 15.4 ⫾ 0.8 13.9 ⫾ 1.8 13.2 ⫾ 1.9 10.9 ⫾ 1.5 97 ⫾ 8 86 ⫾ 6
3.4 ⫾ 0.5 3.6 ⫾ 0.4 3.2 ⫾ 0.2
11.6 ⫾ 1.5 12.3 ⫾ 0.6
Stiffness (N/mm)
Energy dissipated at max load (%)
26 ⫾ 4 28 ⫾ 3 22 ⫾ 6 51 ⫾ 6.2 54 ⫾ 5.4 56 ⫾ 11.5 61 ⫾ 2 54 ⫾ 7 321 ⫾ 20 329 ⫾ 12
43 ⫾ 4 58 ⫾ 5 51 ⫾ 11 35 ⫾ 2 52 ⫾ 3 52 ⫾ 10 33 ⫾ 5 29 ⫾ 10 17 ⫾ 2 18 ⫾ 1
Energy dissipated at fracture load (%)
90 ⫾ 2 89 ⫾ 3 88 ⫾ 2
46 ⫾ 11 35 ⫾ 8
P28: WT, Rcan2⫹/⫺, and Rcan2⫺/⫺ mice (n ⫽ 3 per genotype); ⬎P112: WT and Rcan2⫺/⫺ mice (n ⫽ 3 per genotype).
surfaces and microarchitecture from which surface activity states (forming, resting, resorbing, resorbed) can be investigated (32, 33). The fraction of the trabecular and endosteal surfaces that displayed osteoclastic bone resorption was quantified using ImageJ (NIH).
Quantitative BSE-SEM (qBSE-SEM) Bone micromineralization density was determined at cubic micron resolution by qBSE-SEM. Block faces were cut through polymethylmethacrylate-embedded specimens and analyzed in the SEM operated at 20 kV and 0.5 nA at a working distance of 17 mm (11 mm sample to detector). Gradations of micromineralization density were represented in eight equal intervals by a pseudocolor scheme as described (28, 34 –36).
Microcomputed tomography(CT) analysis Humeri were analyzed by micro-CT (Skyscan 1172a; Kontich, Belgium) at 50 kV and 200 A using a 0.5-mm aluminum filter and a detection pixel size of 4.3 m2. Scanned images were reconstructed using Skyscan NRecon software (28). One cubic millimeter of area, 0.2 mm from the growth plate, was selected as the region of interest. Trabecular bone volume as proportion of tissue volume (percentage), trabecular thickness (millimeters), trabecular number (millimeters⫺1), and structure model index were analyzed in the region of interest using the Skyscan CT analysis software. Cortical bone volume (cubic millimeters) was also determined in the region of interest.
Osteoclastic bone resorption Osteoclast numbers were determined in samples fixed in 10% neutral buffered formalin and decalcified in 10% EDTA (pH 7.4). Sections were stained for tartrate-resistant acid phosphatase (TRAP) using a Sigma TRAP kit (386A-1KT; Sigma, Poole, Dorset, UK) and photographed at ⫻200 magnification using a Leica DM LB2 microscope and DFC320 digital camera and a montage of nine overlapping fields constructed for each bone, representing an area of approximately 1 mm2. Osteoclast numbers (Oc.N) and surface (Oc.S) were determined in trabecular bone and normalized to total bone surface (BS). Measurements commenced 0.2 mm below the growth plate (25, 26).
Osteoblastic bone formation Midline longitudinal and midcoronal block faces were cut through methacrylate embedded specimens and examined using a Leica SP2 reflection confocal microscope with 488 nm excitation and ⫻10/1.0 and ⫻40/1.25 objectives to determine the fraction of bone surface undergoing active bone formation as described (28, 37). Mineral apposition rate (MAR) was calculated by determining calcein separation at between 10 and 20 locations per specimen using ImageJ (NIH). Montages of trabecular bone were generated and the BS and mineralizing surface (MS) measured using ImageJ. Bone formation rate (BFR) was calculated from the product of MS and MAR. Measurements commenced 0.2 mm below the growth plate.
Semiquantitative RT-PCR cDNA was synthesized from total RNA (2.5 g), and 1 l cDNA was used for PCR amplification of Rcan2–1, Rcan2–3, and Gapdh (38). The nucleotide (nt) positions indicate the locations of PCR primers within the GenBank reference sequence: Rcan2–1 forward primer, Rcan2–1 F (nt 294 –313), reverse primer Rcan2–1R (nt 530 –511) (GenBank NM_207649); Rcan2–3 forward primer, Rcan2–3 F (nt 205–224), reverse primer, Rcan2–3R (nt 423– 404) (NM_030598); Gapdh forward primer, GapdhF (nt 658 – 677), reverse primer, GapdhR (nt 881– 863) (NM_008084) (Fig. 1). PCR were performed with an initial denaturation step at 94 C for 2 min, cycles of 30 sec at 94 C, 30 sec at an annealing temperature of 55 C, and 30 sec at 72 C, followed by a termination step at 72 C for 3 min. Semiquantitative RT-PCR was optimized as described (39) and cDNA amplified using the optimized number of PCR cycles for each gene (25 cycles for Gapdh; 28 cycles for Rcan2–1 and Rcan2–3).
Osteoblast cultures Calvaria were removed from 2-d-old mice and osteoblasts isolated by sequential collagenase digestion. Osteoblasts were cultured in 75-cm2 flasks in modified Eagle’s medium supplemented with 10% fetal calf serum, L-glutamine, penicillin, and streptomycin for 72 h. Cells were replated in six-well plates (250,000 cells/well) and maintained for 48 h before culture in serum-free medium overnight. Cells were treated with vehicle or T3 (100 nM) for 6 h before RNA extraction with Trizol or isolation of nuclear and cytoplasmic protein fractions using an NEPER kit (Thermo Scientific, Waltham, MA).
3542
Bassett et al.
Rcan2 and Osteoblast Function
Endocrinology, July 2012, 153(7):3537–3548
Real-time RT-PCR Total RNA was extracted from calvarial osteoblasts and whole bones, and 1 g was reverse transcribed (QunatiTect reverse transcriptase kit; QIAGEN, Hilden, Germany). cDNA was amplified using Rcan2–1 and Rcan2–3 primers described above and -actin and 18s rRNA primers as follows: -actin forward primer, -ActinF (nt 1035–1058), reverse primer, -ActinR (nt 1234 –1209) (NM_007393); 18s rRNA forward primer, 18sF (nt 1443–1461), reverse primer, 18sR (nt 1549 –1530) (NM_003278). RT-PCR was performed using a 7900HT Fast real-time machine (Applied Biosystems, Foster City, CA) and analyzed with SDS2.3 software (Applied Biosystems). PCRs were performed with an initial denaturation step at 95 C for 10 min followed by 40 cycles of 95 C for 15sec, 30 sec at an annealing temperature of 60 C, and 30 sec at 72 C, followed by a dissociation stage to allow melt curve analysis.
Immunoprecipitation Nuclear and cytoplasmic protein fractions were isolated from primary calvarial osteoblasts using a NE-PER kit (Thermo Scientific). 20 g of each fraction was pre-cleared using protein G-Sepharose beads (GE Healthcare, Hatfield, Hertfordshire, UK) for 1 h. Cleared lysates were incubated overnight with 5 g of anti-NFATc1 monoclonal antibody (Santa Cruz Biotechnology, Santa Cruz, CA) before the addition of protein-G-Sepharose beads for 1 h and collection of immunoprecipitates by centrifugation. Samples were washed four times in PBS and eluted in protein sample buffer. SDS-PAGE and Western blotting were then performed using anti-NFATc1 monoclonal antibody (Santa Cruz Biotechnology) or an antiphosphoserine antibody (Abcam, Cambridge UK).
Statistics Normally distributed data were analyzed by ANOVA followed by Tukey’s multiple comparison post hoc test. P ⬍0.05 was considered significant. Frequency distributions of bone micromineralization densities obtained by Faxitron and qBSE were compared using the Kolmogorov-Smirnov test, in which P values for the D statistic in 1024 pixel data sets were D ⫽ greater than 6.01, P ⬍ 0.05; D ⫽ greater than 7.20, P ⬍ 0.01, and D ⫽ greater than 8.62 P ⬍ 0.001.
FIG. 4. Bone microarchitecture and micromineralization in adult Rcan2⫺/⫺ mice. A and B, Low-power BSE-SEM views of proximal tibia and high-power views of distal femur from P112 WT, Rcan2⫹/⫺, and Rcan2⫺/⫺ mice (n ⫽ 3 per genotype). Bars, 200 m. C, qBSE-SEM images of trabecular bone from proximal humerus of P112 WT, Rcan2⫹/⫺, and Rcan2⫺/⫺ mice (n ⫽ 2– 4 per genotype). Gray-scale images were pseudocolored according to an eight-color palette in which the low mineralization density is blue and the high density is gray. Bar, 200 m. D, Relative and cumulative frequency histograms of trabecular bone micromineralization densities. *, P ⬍ 0.05, Rcan2⫹/⫺ or Rcan2⫺/⫺ vs. WT, Kolmogorov-Smirnov test, WT (n ⫽ 4), Rcan2⫹/⫺ (n ⫽ 2), and Rcan2⫺/⫺ (n ⫽ 4). E, qBSE-SEM images of cortical bone from the midshaft of the humerus in WT, Rcan2⫹/⫺, or Rcan2⫺/⫺ mice. Bar, 200 m. F, Frequency histograms of cortical bone micromineralization densities. ***, P ⬍ 0.001, Rcan2⫹/⫺ or Rcan2⫺/⫺ vs. WT, Kolmogorov-Smirnov test, WT (n ⫽ 4), Rcan2⫹/⫺ (n ⫽ 2), and Rcan2⫺/⫺ (n ⫽ 4).
Results Bone development in Rcan2ⴚ/ⴚ mice To determine whether deletion of Rcan2 affects bone formation, endochondral and intramembranous ossification was analyzed in neonatal P1 mice, and linear growth was characterized between P1 and P112 (Fig. 2, A–E). There were no differences in endochondral bone formation or linear growth between WT and mutant mice (Fig. 2, A–C). Consistent with these findings, histological analysis of the growth plate revealed no differences between WT and Rcan2 mutant mice at P28 (Fig. 2, B and C). By contrast, intramembranous ossification was delayed in P1 Rcan2⫺/⫺ mice, in which wider skull sutures and fonta-
Endocrinology, July 2012, 153(7):3537–3548
endo.endojournals.org
nelles were present compared with WT mice and heterozygotes, although clavicle morphology was normal (Fig. 2, D and E). Cortical bone thickness was also reduced by 17% in Rcan2⫺/⫺ mice in the middiaphysis of the humerus at P28 (Fig. 2C), although this difference in cortical thickness was not maintained at P112 (data not shown). Thus, during skeletal development Rcan2-deficient mice display normal endochondral ossification in the growth plate but impaired intramembranous ossification and cortical bone formation. Bone mineralization and strength in juvenile Rcan2⫺/⫺ mice To determine whether deletion of Rcan2 affects bone mineralization, bone mineral content in P28 mice was analyzed by Faxitron digital x-ray microradiography. Relative and cumulative frequency histograms revealed reduced bone mineral content in Rcan2⫺/⫺ mice and reduced vertebral bone mineral content in both Rcan2⫺/⫺ and Rcan2⫹/⫺ mice (Fig. 3, A and B). To determine whether reduced bone mineral content and cortical bone thickness in juvenile Rcan2⫺/⫺ mice was accompanied by impaired bone strength, destructive three-point bend testing was performed on humeri and compression testing on caudal vertebrae from P28 mice. Although biomechanical analysis demonstrated a trend to suggest that bone strength is impaired in Rcan2⫺/⫺ mice, the data did not reach statistical significance (Fig. 3, C and D, and Table 1). Bone microarchitecture in adult Rcan2⫺/⫺ mice To investigate the structure of adult bone in Rcan2⫺/⫺ mice, bone microarchitecture was analyzed. Low-power BSE-SEM views of proximal tibia revealed no differences in cortical or trabecular bone between mutant and WT mice at P112 (Fig. 4A). In higher-power views, the thickness and connectivity of individual trabeculae was similar among Rcan2⫹/⫺ and Rcan2⫺/⫺ and WT mice (Fig. 4B). Accordingly, trabecular and cortical bone parameters determined by micro-CT (Table 2), and cortical thickness determined by Faxitron (data not shown), did not differ between mutant and WT mice. Thus, adult Rcan2 mutant mice have normal bone microarchitecture.
TABLE 2.
WT Rcan2⫺/⫺
3543
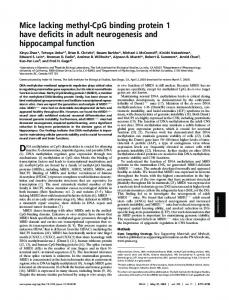
Bone mineralization and strength in adult Rcan2ⴚ/ ⴚ mice Detailed studies of bone mineralization were performed using qBSE-SEM (Fig. 4, C–F). Frequency histograms of micromineralization densities from trabecular (Fig. 4D) and cortical bone (Fig. 4F) demonstrated increased mineralization in Rcan2⫹/⫺ and Rcan2⫺/⫺ mice. Thus, in contrast to the reduced bone mineral content identified in juveniles, adult Rcan2 mutant mice display increased bone mineralization. To determine whether this increased bone mineralization was accompanied by altered bone strength three-point bend and compression testing was performed. Despite the observed changes in mineralization, biomechanical parameters did not differ between Rcan2⫺/⫺ and WT mice (Table 1). Bone resorption and bone formation in Rcan2ⴚ/ⴚ mice To investigate whether changes in osteoclastic bone resorption also occur in Rcan2 mutant mice, histomorphometry and BSE-SEM analyses were performed. Sections were stained for TRAP to determine the Oc.N and quantify Oc.S in relation to the total trabecular BS (Fig. 5, A and B), but no differences in these parameters were identified between mutant and WT mice. The areas of osteoclastic bone resorption on trabecular and endosteal bone surfaces were quantified in higher resolution BSE-SEM images (Fig. 5, C and D), and no differences were identified in the resorption surface relative to total BS between mutant and WT mice. To investigate osteoblast function and bone formation parameters, mineralizing surfaces, MAR, and BFR were quantified in bones from the calcein-labeled mice (Fig. 5, E and F). Mineralizing surfaces were reduced by 54% and MAR by 29% in Rcan2-deficient mice, and consequently, bone formation rate was reduced by 67% in Rcan2⫺/⫺ mice. Thus, Rcan2-deficient mice exhibit an isolated defect in osteoblast function but have normal osteoclast function. Rcan2 expression in bone Expression of Rcan2 in the skeleton and its regulation by thyroid hormones were investigated in primary bone
Micro-CT analysis
P112 P112
Humerus Humerus
BV/TV (%)
Tb.Th (mm)
Tb.N (mmⴚ1)
SMI
Cortical BV (mm3)
8.1% ⫾ 0.7 8.8% ⫾ 2.7
0.038 ⫾ 0.001 0.038 ⫾ 0.001
2.1 ⫾ 0.18 2.3 ⫾ 0.71
1.91 ⫾ 0.07 1.94 ⫾ 0.28
0.59 ⫾ 0.02 0.53 ⫾ 0.05
WT and Rcan2⫺/⫺ mice (n ⫽ 3 per genotype). BV/TV, Trabecular bone volume as proportion of tissue volume; Tb.Th, trabecular thickness; Tb.N, trabecular number; SMI, structure model index; Cortical BV, Cortical bone volume.
3544
Bassett et al.
Rcan2 and Osteoblast Function
Endocrinology, July 2012, 153(7):3537–3548
cell cultures from WT mice and in bones obtained from TR knockout and thyroid-manipulated mice. In primary osteoclast cultures, bone marrow monocytes and osteoclast precursors expressed Rcan2–1 but not Rcan2–3, whereas mature osteoclasts expressed only Rcan2–3. By contrast, primary osteoblasts expressed both isoforms (Fig. 6). Mice lacking TR␣ (TR␣0/0) have impaired T3 signaling in bone because they lack expression of TR␣, the predominant functional TR isoform in the skeleton (26, 40). By contrast, mice lacking TR (TR⫺/⫺) have increased thyroid hormone signaling in bone due to activation of the normal TR␣ isoform by elevated circulating thyroid hormones (25, 26). The level of Rcan2–1 expression was similar in juvenile and adult TR␣0/0, TR⫺/⫺, and WT mice, whereas expression of Rcan2–3 was reduced by 50% in juvenile TR␣0/0 mice (Fig. 7). Consistent with these findings, skeletal Rcan2–3 mRNA expression was increased by more than 2-fold in thyrotoxic WT mice compared with hypothyroid animals (Fig. 8A).
FIG. 5. Bone turnover in Rcan2⫺/⫺ mice. A, TRAP-stained sections of tibia trabecular bone from P112 WT, Rcan2⫹/⫺, and Rcan2⫺/⫺ mice. Black arrows indicate TRAP-stained osteoclasts. Bar, 200 m. B, Quantitative analysis of Oc.S and the Oc.N relative to BS. No statistical differences, ANOVA, WT (n ⫽ 4), Rcan2⫹/⫺ (n ⫽ 2), and Rcan2⫺/⫺ (n ⫽ 4), were seen. C, Endosteal bone surfaces from P112 WT, Rcan2⫹/⫺, and Rcan2⫺/⫺ mice imaged by BSE-SEM. White arrows indicate roughened osteoclast resorption surfaces. Bar, 200 m. D, Quantitative analysis of trabecular and endosteal osteoclast resorption surfaces (percentage of total bone surface). No statistical differences, ANOVA, WT (n ⫽ 4), Rcan2⫹/⫺ (n ⫽ 2) and Rcan2⫺/⫺ (n ⫽ 4), were seen. E, Calcein labeling of trabecular bone from WT, Rcan2⫹/⫺, and Rcan2⫺/⫺ mice. Bar, 10 m. F, Trabecular bone MS, MAR, and BFR determined by dualcalcein labeling. ANOVA, Rcan2⫹/⫺ (n ⫽ 2) and Rcan2⫺/⫺ (n ⫽ 4) vs. WT (n ⫽ 4), *, P ⬍ 0.05 and **, P ⬍ 0.01, Tukey’s post hoc test.
In vitro studies in primary osteoblasts In primary cultures of WT calvarial osteoblasts, T3 treatment did not affect the levels of Rcan2–1 or Rcan2–3 mRNA expression (Fig. 8B). Furthermore, T3 treatment did not alter levels of NFATc1 protein expression or phosphorylation and did not affect its relative distribution between nuclear and cytoplasmic compartments (Fig. 8C).
Discussion These studies demonstrate that, despite normal endochondral ossification and linear growth, juvenile Rcan2⫺/⫺ mice display delayed intramembranous ossification, impaired cortical bone formation, and reduced bone mineral accrual.
Endocrinology, July 2012, 153(7):3537–3548
endo.endojournals.org
3545
FIG. 6. Rcan2 mRNA expression in primary osteoblasts and osteoclasts. A, Rcan2–1, Rcan2–3, and Gapdh mRNA expression in primary osteoblasts (M; size marker). Ob, Osteoblasts; Br, brain; Ht, heart; and C, no template control. B, Rcan2–1 and Rcan2–3 expression in primary osteoclasts (Mo; bone marrow monocytes). Oc D1, Osteoclast precursors (d 1 of culture); and Oc D5, mature osteoclasts (d 5 of culture).
Adult Rcan2⫺/⫺mice exhibit normal bone microarchitecture but increased mineralization. Heterozygous Rcan2⫹/⫺ mice have an intermediate phenotype consistent with a gene dosage effect. The skeletal abnormalities in Rcan2⫺/⫺ mice were accompanied by normal bone resorption but reduced bone formation, indicating an isolated defect in osteoblast function. The resulting reduction in mineral apposition rate leads to an extended bone formation phase and prolongation of the bone remodeling cycle. This protracted phase of osteoblastic bone formation is accompanied by a longer period of secondary mineralization (41, 42), which results in the observed increase in bone mineralization in adult Rcan2⫺/⫺ mice. Thyroid hormones have major effects on skeletal development and adult bone maintenance (43, 44). Hypothyroidism delays bone formation and linear growth, whereas thyrotoxicosis accelerates skeletal development and is an important risk factor for osteoporosis. In previous studies we characterized mice with mutation or deletion of TR␣ and TR in several genetic backgrounds (21, 23–27). Juvenile TR␣ mutants exhibit delayed endochondral ossification and impaired growth, whereas juvenile TR mutants have advanced ossification. By contrast, adult TR␣ mutants have increased bone mass resulting from disrupted T3 action in bone, whereas adult TR mutants are osteoporotic due to increased T3 signaling in the skeleton as a consequence of elevated circulating thyroid hormone concentrations (23, 40). Taken together, these studies indicate TR␣ mediates T3 action in bone (21). In studies to investigate the role of TR␣ in skeletal development, we characterized a series of TR␣ mutant mice (23, 25, 26). Mice lacking TR␣ (TR␣0/0) had delayed endochondral ossification but normal intramembranous ossification and normal adult bone mineralization. By con-
FIG. 7. Rcan2 mRNA expression in bone from TR knockout mice. A, Rcan2–1 and Rcan2–3 mRNA expression in juvenile WT, TR␣0/0, and TR⫺/⫺ bone at age P21. B, Rcan2–1 and Rcan2–3 mRNA expression in adult WT, TR␣0/0, and TR⫺/⫺ bone at age P70. C, Graphs showing Rcan2–1 and Rcan2–3 mRNA expression, normalized to Gapdh, in bone from juvenile TR␣0/0 and TR⫺/⫺ mice compared with WT. ANOVA, Rcan2⫹/⫺/⫺ and Rcan2⫺/⫺ vs. WT. *, P ⬍ 0.05, Tukey’s post hoc test, n ⫽ 4 per genotype. D, Graphs showing Rcan2–1 and Rcan2– 3 mRNA expression, normalized to Gapdh, in bone from adult TR␣0/0 and TR⫺/⫺ mice compared with WT. No significant difference, ANOVA, n ⫽ 4 per genotype, was seen.
trast, mice harboring a dominant-negative mutation of TR␣ (TR␣1PV/⫹ and TR␣1R384C/⫹) had delayed endochondral and intramembranous ossification accompanied by increased adult bone mineralization (23, 25, 26). In further studies we showed that expression of the type 2 deiodinase enzyme (DIO2), which generates T3 in thyroid hormone-responsive target cells, is restricted to differentiated osteoblasts in the skeleton (45). Accordingly, Dio2 knockout mice (Dio2⫺/⫺) exhibited a discrete defect of osteoblast function, resulting in increased adult bone min-
3546
Bassett et al.
Rcan2 and Osteoblast Function
FIG. 8. Rcan2 mRNA expression in whole bone and primary osteoblasts from WT mice and expression and phosphorylation of NFATc1 in WT osteoblasts treated with T3. A, Rcan2–1 and Rcan2–3 mRNA expression in whole bone from hypothyroid and thyrotoxic P112 WT mice. Unpaired Student’s t test, hypothyroid vs. thyrotoxic. *, P ⬍ 0.05, n ⫽ 3 per group. B, Rcan2–1 and Rcan2–3 mRNA expression in primary calvarial osteoblasts obtained from WT mice. No significant difference, unpaired Student’s t test, hypothyroid vs. thyrotoxic, n ⫽ 3 per group, was seen. C, Immunoprecipitation and Western blot analysis of total and phosphorylated NFATc1 in nuclear and cytoplasmic protein fractions from cultured primary calvarial osteoblasts treated with vehicle or T3 (100 nM). No significant difference, unpaired Student’s t test, vehicle vs. T3, n ⫽ 3 per group, was seen.
eralization (28). Thus, the findings of delayed intramembranous ossification and increased adult bone mineralization identified in Rcan2⫺/⫺ mice are similar to those in
Endocrinology, July 2012, 153(7):3537–3548
mice with osteoblast defects due to dominant negative mutations of TR␣ or deletion of Dio2. Cell-specific gene targeting has demonstrated that the calcineurin-NFAT pathway is a negative regulator of osteoblast differentiation (12). Thus, deletion of the endogenous calcineurin inhibitor RCAN2 would be expected to inhibit osteoblast activity further by removal of tonal inhibition of calcineurin activity in osteoblasts. The findings of delayed intramembranous ossification, impaired cortical bone formation, and reduced bone mineral accrual during development, together with increased bone mineralization in adult Rcan2⫺/⫺, mice are all consistent with this hypothesis. Together with the previous similar findings in TR␣ and Dio2 mutant mice (23, 25, 26, 28), the skeletal phenotype of Rcan2⫺/⫺ mice suggests that Rcan2 may lie downstream of T3 signaling in osteoblasts. We therefore investigated thyroid hormone regulation of Rcan2 expression in skeletal cells in vivo and in vitro. Both Rcan2–1 and Rcan2–3 mRNA were expressed in bone in vivo and, consistent with previous studies in fibroblasts (16), only the Rcan2–3 isoform was regulated by thyroid status or deletion of TR␣. In vitro studies demonstrated that expression of Rcan2–1 and Rcan2–3 was bone cell lineage specific and dependent on the stage of cell differentiation. Osteoblasts expressed both Rcan2 mRNA isoforms and immature osteoclast precursor cells expressed only Rcan2–1, whereas mature differentiated osteoclasts expressed only Rcan2–3. The absence of an osteoclast phenotype in Rcan2⫺/⫺ mice suggests the actions of Rcan2 are dispensable in the osteoclast lineage, and this may reflect redundancy in regulation of calcineurin/NFAT signaling. Expression of both Rcan2 transcripts in osteoblasts suggests that Rcan2 may mediate some of the actions of T3 in osteoblasts. To address this, primary osteoblasts were treated with T3. Even though skeletal Rcan2–3 expression was increased in thyrotoxic animals, T3 treatment did not affect Rcan2–3 or Rcan2–1 expression in primary osteoblasts. Furthermore, immunoprecipitation studies to investigate expression of the calcineurin target gene NFATc1 and its phosphorylation in cytoplasmic and nuclear compartments also revealed no response to T3. These in vitro studies suggest that, even though skeletal expression of Rcan2 is regulated by thyroid status in vivo, the phenotype identified in Rcan2⫺/⫺ mice is unlikely to result directly from disruption of T3 signaling in osteoblasts. Nevertheless, the current studies establish that Rcan2 regulates osteoblast activity during growth and maintenance of bone mineralization in adults.
Endocrinology, July 2012, 153(7):3537–3548
Acknowledgments We thank Maureen Arora for SEM studies. Address all correspondence and requests for reprints to: Graham R. Williams, Molecular Endocrinology Group, Room 7N2a, Commonwealth Building, Hammersmith Hospital, Du Cane Road, London W12 0NN, United Kingdom. E-mail:
[email protected]. This work was supported by Medical Research Council research grants (to J.H.D.B. and G.R.W.) and a grant from the Horserace Betting Levy Board (to A.B.). The SEM study was funded by the Medical Research Council. P.C. is supported by the Mrs. Janice Gibson and the Ernest Heine Family Foundation. Disclosure Summary: The authors have nothing to disclose.
References 1. Kingsbury TJ, Cunningham KW 2000 A conserved family of calcineurin regulators. Genes Dev 14:1595–1604 2. Davies KJ, Ermak G, Rothermel BA, Pritchard M, Heitman J, Ahnn J, Henrique-Silva F, Crawford D, Canaider S, Strippoli P, Carinci P, Min KT, Fox DS, Cunningham KW, Bassel-Duby R, Olson EN, Zhang Z, Williams RS, Gerber HP, Pérez-Riba M, Seo H, Cao X, Klee CB, Redondo JM, Maltais LJ, Bruford EA, Povey S, Molkentin JD, McKeon FD, Duh EJ, Crabtree GR, Cyert MS, de la Luna S, Estivill X 2007 Renaming the DSCR1/Adapt78 gene family as RCAN: regulators of calcineurin. FASEB J 21:3023–3028 3. Klee CB, Crouch TH, Krinks MH 1979 Calcineurin: a calcium- and calmodulin-binding protein of the nervous system. Proc Natl Acad Sci USA 76:6270 – 6273 4. Crabtree GR 1999 Generic signals and specific outcomes: signaling through Ca2⫹, calcineurin, and NF-AT. Cell 96:611– 614 5. Stern PH 2006 The calcineurin-NFAT pathway and bone: intriguing new findings. Mol Interv 6:193–196 6. Fuentes JJ, Genescà L, Kingsbury TJ, Cunningham KW, Pérez-Riba M, Estivill X, de la Luna S 2000 DSCR1, overexpressed in Down syndrome, is an inhibitor of calcineurin-mediated signaling pathways. Hum Mol Genet 9:1681–1690 7. Rothermel B, Vega RB, Yang J, Wu H, Bassel-Duby R, Williams RS 2000 A protein encoded within the Down syndrome critical region is enriched in striated muscles and inhibits calcineurin signaling. J Biol Chem 275:8719 – 8725 8. Takayanagi H 2007 The role of NFAT in osteoclast formation. Ann NY Acad Sci 1116:227–237 9. Sun L, Blair HC, Peng Y, Zaidi N, Adebanjo OA, Wu XB, Wu XY, Iqbal J, Epstein S, Abe E, Moonga BS, Zaidi M 2005 Calcineurin regulates bone formation by the osteoblast. Proc Natl Acad Sci USA 102:17130 –17135 10. Koga T, Matsui Y, Asagiri M, Kodama T, de Crombrugghe B, Nakashima K, Takayanagi H 2005 NFAT and Osterix cooperatively regulate bone formation. Nat Med 11:880 – 885 11. Winslow MM, Pan M, Starbuck M, Gallo EM, Deng L, Karsenty G, Crabtree GR 2006 Calcineurin/NFAT signaling in osteoblasts regulates bone mass. Dev Cell 10:771–782 12. Yeo H, Beck LH, Thompson SR, Farach-Carson MC, McDonald JM, Clemens TL, Zayzafoon M 2007 Conditional disruption of calcineurin B1 in osteoblasts increases bone formation and reduces bone resorption. J Biol Chem 282:35318 –35327 13. Yeo H, Beck LH, McDonald JM, Zayzafoon M 2007 Cyclosporin A elicits dose-dependent biphasic effects on osteoblast differentiation and bone formation. Bone 40:1502–1516
endo.endojournals.org
3547
14. Epstein S, Shane E, Bilezikian JP 1995 Organ transplantation and osteoporosis. Curr Opin Rheumatol 7:255–261 15. Miyazaki T, Kanou Y, Murata Y, Ohmori S, Niwa T, Maeda K, Yamamura H, Seo H 1996 Molecular cloning of a novel thyroid hormone-responsive gene, ZAKI-4, in human skin fibroblasts. J Biol Chem 271:14567–14571 16. Cao X, Kambe F, Miyazaki T, Sarkar D, Ohmori S, Seo H 2002 Novel human ZAKI-4 isoforms: hormonal and tissue-specific regulation and function as calcineurin inhibitors. Biochem J 367:459 – 466 17. Cao X, Kambe F, Moeller LC, Refetoff S, Seo H 2005 Thyroid hormone induces rapid activation of Akt/protein kinase B-mammalian target of rapamycin-p70S6K cascade through phosphatidylinositol 3-kinase in human fibroblasts. Mol Endocrinol 19:102–112 18. Siddiq A, Miyazaki T, Takagishi Y, Kanou Y, Hayasaka S, Inouye M, Seo H, Murata Y 2001 Expression of ZAKI-4 messenger ribonucleic acid in the brain during rat development and the effect of hypothyroidism. Endocrinology 142:1752–1759 19. Mizuno Y, Kanou Y, Rogatcheva M, Imai T, Refetoff S, Seo H, Murata Y 2004 Genomic organization of mouse ZAKI-4 gene that encodes ZAKI-4 ␣ and  isoforms, endogenous calcineurin inhibitors, and changes in the expression of these isoforms by thyroid hormone in adult mouse brain and heart. Eur J Endocrinol 150: 371–380 20. Yang J, Rothermel B, Vega RB, Frey N, McKinsey TA, Olson EN, Bassel-Duby R, Williams RS 2000 Independent signals control expression of the calcineurin inhibitory proteins MCIP1 and MCIP2 in striated muscles. Circ Res 87:E61–E68 21. Bassett JH, Williams GR 2009 The skeletal phenotypes of TR␣ and TR mutant mice. J Mol Endocrinol 42:269 –282 22. Sun XY, Hayashi Y, Xu S, Kanou Y, Takagishi Y, Tang YP, Murata Y 2011 Inactivation of the Rcan2 gene in mice ameliorates the ageand diet-induced obesity by causing a reduction in food intake. PLoS One 6:e14605 23. O’Shea PJ, Bassett JH, Sriskantharajah S, Ying H, Cheng SY, Williams GR 2005 Contrasting skeletal phenotypes in mice with an identical mutation targeted to thyroid hormone receptor ␣1 or . Mol Endocrinol 19:3045–3059 24. O’Shea PJ, Harvey CB, Suzuki H, Kaneshige M, Kaneshige K, Cheng SY, Williams GR 2003 A thyrotoxic skeletal phenotype of advanced bone formation in mice with resistance to thyroid hormone. Mol Endocrinol 17:1410 –1424 25. Bassett JH, Nordström K, Boyde A, Howell PG, Kelly S, Vennström B, Williams GR 2007 Thyroid status during skeletal development determines adult bone structure and mineralization. Mol Endocrinol 21:1893–1904 26. Bassett JH, O’Shea PJ, Sriskantharajah S, Rabier B, Boyde A, Howell PG, Weiss RE, Roux JP, Malaval L, Clement-Lacroix P, Samarut J, Chassande O, Williams GR 2007 Thyroid hormone excess rather than thyrotropin deficiency induces osteoporosis in hyperthyroidism. Mol Endocrinol 21:1095–1107 27. Bassett JH, Williams AJ, Murphy E, Boyde A, Howell PG, Swinhoe R, Archanco M, Flamant F, Samarut J, Costagliola S, Vassart G, Weiss RE, Refetoff S, Williams GR 2008 A lack of thyroid hormones rather than excess thyrotropin causes abnormal skeletal development in hypothyroidism. Mol Endocrinol 22:501–512 28. Bassett JH, Boyde A, Howell PG, Bassett RH, Galliford TM, Archanco M, Evans H, Lawson MA, Croucher P, St Germain DL, Galton VA, Williams GR 2010 Optimal bone strength and mineralization requires the type 2 iodothyronine deiodinase in osteoblasts. Proc Natl Acad Sci USA 107:7604 –7609 29. Dai XM, Zong XH, Akhter MP, Stanley ER 2004 Osteoclast deficiency results in disorganized matrix, reduced mineralization, and abnormal osteoblast behavior in developing bone. J Bone Miner Res 19:1441–1451 30. Schriefer JL, Robling AG, Warden SJ, Fournier AJ, Mason JJ,
3548
31.
32.
33.
34.
35.
36.
Bassett et al.
Rcan2 and Osteoblast Function
Turner CH 2005 A comparison of mechanical properties derived from multiple skeletal sites in mice. J Biomech 38:467– 475 Silva MJ, Brodt MD, Uthgenannt BA 2004 Morphological and mechanical properties of caudal vertebrae in the SAMP6 mouse model of senile osteoporosis. Bone 35:425– 431 Geoffroy V, Kneissel M, Fournier B, Boyde A, Matthias P 2002 High bone resorption in adult aging transgenic mice overexpressing cbfa1/runx2 in cells of the osteoblastic lineage. Mol Cell Biol 22: 6222– 6233 Saftig P, Hunziker E, Wehmeyer O, Jones S, Boyde A, Rommerskirch W, Moritz JD, Schu P, von Figura K 1998 Impaired osteoclastic bone resorption leads to osteoporosis in cathepsin-K-deficient mice. Proc Natl Acad Sci USA 95:13453–13458 Boyde A, Firth EC 2005 Musculoskeletal responses of 2-year-old Thoroughbred horses to early training. 8. Quantitative back-scattered electron scanning electron microscopy and confocal fluorescence microscopy of the epiphysis of the third metacarpal bone. N Z Vet J 53:123–132 Boyde A, Jones SJ, Aerssens J, Dequeker J 1995 Mineral density quantitation of the human cortical iliac crest by backscattered electron image analysis: variations with age, sex, and degree of osteoarthritis. Bone 16:619 – 627 Boyde A, Travers R, Glorieux FH, Jones SJ 1999 The mineralization density of iliac crest bone from children with osteogenesis imperfecta. Calcif Tissue Int 64:185–190
Endocrinology, July 2012, 153(7):3537–3548
37. Doube M, Firth EC, Boyde A 2007 Variations in articular calcified cartilage by site and exercise in the 18-month-old equine distal metacarpal condyle. Osteoarthritis Cartilage 15:1283–1292 38. Bassett JH, Swinhoe R, Chassande O, Samarut J, Williams GR 2006 Thyroid hormone regulates heparin sulfate proteoglycan expression in the growth plate. Endocrinology 147:295–305 39. Williams GR 2000 Cloning and characterization of two novel thyroid hormone receptor  isoforms. Mol Cell Biol 20:8329 – 8342 40. O’Shea PJ, Bassett JHD, Cheng SY, Williams GR 2006 Characterization of skeletal phenotypes of TR␣1PV and TRPV mutant mice: implications for tissue thyroid status and T3 target gene expression. Nuclear Receptor Signaling 4:e011 (http://www.nursa.org/article.cfm?doi⫽010.1621/nrs.04011) 41. Bala Y, Farlay D, Delmas PD, Meunier PJ, Boivin G 2010 Time sequence of secondary mineralization and microhardness in cortical and cancellous bone from ewes. Bone 46:1204 –1212 42. Boivin G, Farlay D, Bala Y, Doublier A, Meunier PJ, Delmas PD 2009 Influence of remodeling on the mineralization of bone tissue. Osteoporos Int 20:1023–1026 43. Bassett JH, Williams GR 2008 Critical role of the hypothalamicpituitary-thyroid axis in bone. Bone 43:418 – 426 44. Murphy E, Williams GR 2004 The thyroid and the skeleton. Clin Endocrinol (Oxf) 61:285–298 45. Williams AJ, Robson H, Kester MH, van Leeuwen JP, Shalet SM, Visser TJ, Williams GR 2008 Iodothyronine deiodinase enzyme activities in bone. Bone 43:126 –134
Members have FREE online access to the journal Hormones & Cancer. www.endo-society.org/HC