James M. Guldin and James P. Barnett1 .... Gen. Tech. Rep. SRSâ71. Asheville, NC: U.S. Department of Agriculture, Forest Service, Southern Research Station. 594 p. ..... Baker, J.B.; Cain, M.D.; Guldin, J.M. [and others].1996. Uneven-.
MICROCLIMATIC CONDITIONS AFTER REPRODUCTION CUTTING IN SHORTLEAF PINE STANDS IN THE OUACHITA MOUNTAINS James M. Guldin and James P. Barnett1 Abstract—Automated weather stations collected microclimatic data over a 4.75-year period in six reproduction cutting treatments—a clearcut, two shelterwoods, a group selection, a single-tree selection, and an unmanaged control—in shortleaf pine stands in the Ouachita Mountains of west-central Arkansas. Treatment means for air temperature at 15 cm, soil temperature, solar radiation, and windspeed were greater for the clearcut than for the group selection, whereas air temperature at 2 m and vapor pressure deficit were markedly higher for the group selection treatment. A thermal inversion effect might be the cause. Retaining overstory hardwoods in the pine-hardwood shelterwood led to increased vapor pressure and soil moisture deficits vs. the pine shelterwood alone. Solar radiation in the single-tree selection was three times greater than in the unmanaged control. Foresters who employ natural regeneration to meet the landowner’s goals should be aware of important microclimatic attributes of reproduction cutting methods at their disposal.
INTRODUCTION A long-term reproduction cutting study was installed in the Ouachita Mountains of west-central Arkansas and eastern Oklahoma in 1993. The objective of the study was to test different reproduction cutting methods that rely on natural regeneration in shortleaf pine (Pinus echinata Mill.) and pine-hardwood stands of the region (Baker 1994, Guldin and others 1994). Controls in the study included a clearcut treatment and an unmanaged treatment. Even-aged reproduction cutting methods tested included two variations of the seed-tree method and three variations of the shelterwood method. Uneven-aged reproduction cutting methods included two variations of the group selection method and four variations of the single-tree selection method. An important question in the study is the degree to which microclimatic conditions are altered as a result of different treatments. The probability of seedling mortality is highest in the first growing season after germination. Planted pine seedlings have the luxury of spending that first year in an irrigated and fertilized nursery environment that minimizes mortality. Pine seedlings of natural origin spend their first year within a more difficult microclimatic condition established by the structure of the stand in which their germination occurred. The forester who employs natural regeneration to meet the landowner’s goals can alter the microclimatic condition by the choice of reproduction cutting method, but the magnitude and attributes of that effect are poorly understood in shortleaf pine and pinehardwood stands in the Ouachita Mountains. Thus, quantification of microclimatic conditions under different reproduction cutting methods will be of interest to foresters who manage for natural regeneration. Three guiding questions were posed with this dataset. First, to what degree do conditions in a group selection opening approximate those in a clearcut? The group selection method is often advocated as a possible substitute for the clearcutting method, and these data can be used to address whether group openings have the same
microclimatic attributes as clearcuts. Second, how do adding residual overstory hardwoods affect microclimatic conditions in a pine shelterwood? It has been reported that 1 square foot of hardwood basal area equals 2 square feet of pine basal area given the larger crowns that a hardwood of given diameter at breast height has relative to a pine of equivalent diameter (Baker and others 1996). An investigation of microclimatic conditions in the shelterwood treatments may enlighten this observation. Third, in what ways does the single-tree selection method differ from unmanaged control conditions? Single-tree selection is often suggested as a preferred method for use in managing forest stands, because it promotes conditions that are most similar to those found in an unmanaged stand. Microclimatic data might also promote an examination of this relationship in a quantitative manner. In this paper, the results of a 4.75-year study are presented for a set of ecologically important microclimatic variables under a variety of reproduction cutting methods applied in shortleaf pine and pine-hardwood stands in the Ouachita Mountains of west-central Arkansas and eastern Oklahoma.
METHODS The characterization of microclimatic conditions following different reproduction cutting methods has been limited not only by the cost of the appropriate equipment but also the limited number of studies in which a variety of reproduction cutting methods have been imposed. An early decision was made to use an unreplicated sample design, acknowledging that the descriptive information available across a number of treatments might be more informative than data from a limited number of replicates. Six treatments were selected for study, and one stand per treatment was selected for instrumentation. The selected treatments and the target pine and hardwood residual basal areas after cutting are listed in table 1. Stands were included in the study based on their physical proximity, such that all stands were located within a 25-km radius of Mount Ida, AR.
1
Project Leader and Research Forest Ecologist, USDA Forest Service, Southern Research Station, Monticello, AR 71655; and Project Leader and Research Forester, USDA Forest Service, Southern Research Station, Pineville, LA 71360, respectively.
Citation for proceedings: Connor, Kristina F., ed. 2004. Proceedings of the 12th biennial southern silvicultural research conference. Gen. Tech. Rep. SRS–71. Asheville, NC: U.S. Department of Agriculture, Forest Service, Southern Research Station. 594 p.
92
020_Guldin.pmd
92
2/26/2004, 2:10 PM
Automated weather stations were used to quantify microclimatic conditions in the stands under study. One weather station was installed in each stand, on the midslope of a typical south- to southwest-facing aspect. Elevations varied from 200 m to 300 m. Weather stations were powered using a rechargeable marine battery, and a solar panel was used to recharge the battery. The basic elements of the weather station consisted of Omnidata products, including the EL-924 Easylogger and EA-110 Multiplexer, the EA-602 Polycorder, and the EM-9064 Data Storage Pack. Other sensors used to collect data for the variables in the study included: • Omnidata ES-120, Vaisala temperature and relative humidity sensors • Omnidata ES-060-SW, Soil and water temperature probe • Omnidata ES-230, Licor pyranometer • Omnidata ES-160, Sierra Misco rain gauge • Omnidata ES-040, Anemometer • Omnidata ES-270, Larson Watermark soil moisture block. The microclimatic variables measured with these instruments were: • windspeed, measured 3 m aboveground (km/hour) • rainfall, collected 3 m aboveground (cm/hour)
• • • • •
relative humidity, measured 2 m aboveground (percent) solar radiation, measured 2 m aboveground (watts/m2) air temperature, measured 2 m and 15 cm aboveground (oC) soil temperature, measured at a depth of 7.5 cm (oC) soil moisture deficit, measured at a depth of 7.5 cm and 22.5 cm (bars).
Vapor pressure deficit (kPa) was calculated using relative humidity and air temperature at 2 m. Sensors for these microclimatic variables were wired to a multiplexer unit that relayed the signal from the sensor to the data logger. Every hour, the data logger triggered the recording of sensor readings and saved the data in the memory of the data storage module. Once a month, technicians visited the sites for maintenance; the module containing the data was Table 1—Treatment methods and the associated target residual basal area for pine and hardwooda Target residual basal area Pine Hardwood - - - - - - - m 2/ha - - - - - - -
Treatment method
Clearcutting Group selection Shelterwood, pine Shelterwood, pine-hardwood Single-tree selection Unmanaged control
0 13.8 9.2 6.9 11.5 22.9
0.46 – 1.15 0a 0.46 – 1.15 2.3 2.3 6.9
a No residual pines or hardwoods were retained in group selection openings. Pines were harvested in the matrix of the group selection stands; the target residual basal area of 13.8 m2/ha is an average across the entire stand, encompassing both the area in groups and the matrix between groups.
swapped with a fresh module with a cleared memory. Data were then returned to the lab, downloaded, and processed. Data were collected at the stations over a 4.75-year period. The initial setup of the stations was in July 1994, and stations were decommissioned in April 1998. The maximum number of hourly observations potentially recorded in the dataset during this period was approximately 250,000. However, interruptions in service at one or more of the stations frequently occurred during the study. Prominent reasons for these disruptions included activity of wild animals, activity of domestic animals, and vandalism. Some of these interruptions occurred for all variables in the study, such as when power to the storage modules was interrupted. Others occurred when a given sensor was affected by some exogenous interference. A partial list of disruption events includes the following: • “soil moisture blocks and temperature sensors pulled up by cows” (October 1994) • “marine battery stolen” (January 1995, May 1996, October 1996, and December 1996) • “solar panel shot 7 times” (January 1995) • “soil probe wires gnawed completely through” (May 1996) • “cables into Easylogger cut” (November 1996) • “steel data enclosure shot twice, bullets missed data logger” (December 1996) • “muzzleloader bullet holes in solar panel and steel case—Easylogger and multiplexer destroyed” (January 1997) The effect of this activity was exacerbated because scheduled maintenance calls were made only on a monthly basis. Thus, service disruptions were typically not detected until either the next regularly scheduled monthly visit in cases of obvious damage or vandalism, or until the initial inspection of data after downloading for sensor malfunctions not apparent from visual inspection. Thus, the dataset has extended periods during which measurements of one or more variables were not taken at one or another of the sites. The varying interruptions in service present a complication in comparing conditions at the different stations. For purposes of the comparisons reported here, it was decided to include those observations for a given variable only for a given date and time when that variable was being recorded at all six stations concurrently between 1994 and 1998. No variable was concurrently collected on all six stations more than about 33 percent of the time. For example, in the analysis of treatment means by month, data for the month of July were not presented because there was no point in any of the 4 July months during the study when all six stations were concurrently collecting data. Statistical analyses conducted on the dataset included the calculation of means and standard deviations for each treatment for the duration of the study—by year, by month, and by hour. Tests of statistical significance and mean differences were made using one-way analysis of variance and Tukey’s mean separation test. Because data were analyzed only for those periods when all six stations were operating concurrently, comparisons for a given variable across year, month, and hour may not be directly comparable from one interval to the next. For example, the mean air temperature at 2 m may vary from year to year if 93
020_Guldin.pmd
93
2/26/2004, 2:10 PM
data from a given month were concurrently collected during one year but not another. Despite this limitation, it was thought that comparisons among treatments for a given variable in the dataset would be illuminating, especially given that all such comparisons are based on common periods of data collection across all six treatments.
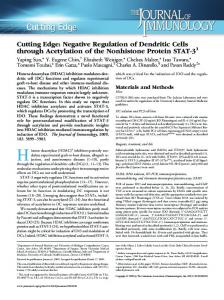
RESULTS Air Temperature at 2 m The group selection treatment was significantly hotter than all other treatments in the study [table 2(A)]. This trend did not initially appear until 1996 but lasted through the end of the study. There was also a monthly effect, such that the group selection treatment was significantly warmer than other treatments from February through October but not during November, December, or January. The diurnal effect was most striking (fig. 1) in which significantly warmer temperatures in the group selection treatment were observed from 1200 hours to 2000 hours, inclusive.
Air Temperature at 15 cm The clearcut had the highest air temperature at 15 cm, followed by the single-tree selection and the pine-hardwood shelterwood, and then the remaining three treatments [table 2(B)]. The mean temperature difference between the hottest and coldest treatments was slightly less than that for the air temperature at 2 m variable. The diurnal effect (fig. 2) shows that the group selection treatment exceeds all other treatments during a few midafternoon hours, the clearcut is the hottest treatment in the morning hours, the group selection is hottest in the midafternoon hours, and the unmanaged control is the hottest throughout the night. In all treatments, the air temperature at 15 cm was greater than the air temperature at 2 m, except for the late afternoon–early evening readings from the group selection treatment.
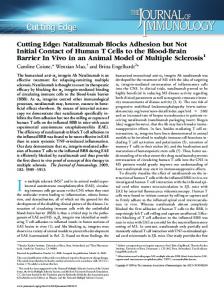
Soil Temperature at -7.5 cm The clearcut had the highest soil temperature of all treatments at depth 7.5 cm, and the unmanaged control and group selection treatments had the lowest soil temperature at that depth [table 2(C)]. The range in means was from 18.6 to 16.4 oC. For each treatment, the mean soil temperature was higher than the corresponding mean for air temperature at 15 cm. However, relative to the air temperature readings, the diurnal range of variation had a lower difference between the midafternoon high reading and the midmorning low reading (fig. 3).
Relative Humidity at 2 m The pine shelterwood had the highest mean relative humidity, followed by the unmanaged control; the clearcut had the lowest mean value [table 2(D)]. The diurnal pattern in relative humidity readings showed a maximum at 0700 hours and a minimum at 1500 to 1600 hours, with a difference of 30 percent between maximum and minimum values (fig. 4). The pine shelterwood showed the highest relative humidity levels and the clearcut the lowest values, at night. Conversely, the unmanaged control had the highest relative humidity values and the group selection the lowest values, during the day.
Vapor Pressure Deficit at 2 m Vapor pressure deficit (VPD) integrates air temperature and relative humidity into a variable that reflects the dryness of the air and the physiological plant response in terms of transpiration potential. In this study, mean VPD was highest for the group selection treatment and lowest for the unmanaged control treatment [table 2(E)]. The greatest diurnal variation was found in the group selection treatment (fig. 5), which varied by more than 2 kPa. All other treatments varied diurnally by 1 kPa or less. Figure 5 also shows the peak VPD readings from 1200 hours to 1900 hours, which parallels the peak reported for air temperature at 2 m in the group selection treatment.
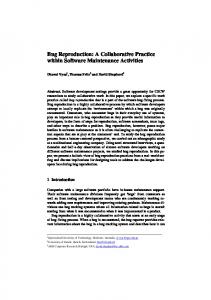
Soil Moisture Deficit at -7.5 cm The soil moisture deficit (SMD) for the 7.5-cm soil depth varied from 4.73 bars in the unmanaged control to 2.34 bars in the clearcut, with significantly different means for each treatment [table 2(F)]. The seasonal effect of SMD was most pronounced (fig. 6). SMDs were < 4 bars for all treatments during the winter and spring months but increased dramatically during summer and early autumn. All treatments reached their mean monthly maximum in August, except for the group selection treatment, which reached its maximum in September. For the 2-month period in August and September, all treatments except the clearcut had monthly mean SMDs exceeding 6 bars. These data point to the SMD to which seedlings will be exposed in the upper layers of the soil in late summer on these sites.
Soil Moisture Deficit at -22.5 cm The SMD data at 22.5-cm depth showed greater variation than the shallow SMD data. Mean SMDs varied from a high of 6.22 bars in the pine-hardwood shelterwood to lows of 1.71 and 1.73 bars in the pine shelterwood and the clearcut treatments, respectively [table 2(G)]. Monthly data also vary widely (fig. 7). Mean SMD values exceed 6 bars from March through September in the pine-hardwood shelterwood, suggesting erroneous readings from the soil moisture block in that stand. Otherwise, the means by treatment and annual patterns indicate a slightly lower SMD at the 22.5cm depth compared with the 7.5-cm depth.
Solar Radiation at 3 m There was greater than a fourfold difference in solar radiation across the treatments, with the mean radiation level highest in the clearcut and lowest in the unmanaged control [table 2(H)]. The diurnal trend showed very similar trends for the clearcut and group selection (fig. 8). The other four treatments showed irregularities in the diurnal pattern: an unusual decline in the afternoon observations from the pine-hardwood shelterwood and marked interruptions in the shape of the normal curve for the single-tree selection and especially the pine shelterwood. The number of observations collected (for each treatment, n = 532 at 1400 hours, n = 532 at 1500 hours, and n = 530 at 1600 hours) suggests the decline in some treatments is due to the physical presence of something that casts shade on the pyranometer, such as a nearby residual overstory or midstory tree.
94
020_Guldin.pmd
94
2/26/2004, 2:10 PM
Table 2—Number of observations per treatment, standard errors, and results of Tukey’s mean separation tests by treatment for variables in the study Treatment
Mean
SE
Dif.
Treatment
no.
Mean
SE
Dif.
no.
GSP CC STS UC SWW SWP
A. Air temperature, 2 m, oC 14,953 17.17 0.095 14,953 15.96 0.073 14,953 15.80 0.073 14,953 15.70 0.070 14,953 15.20 0.075 14,953 15.01 0.075
A B B B C C
UC SWW STS GSP SWP CC
F. Soil moisture deficit, -7.5 cm, bars 7,102 4.73 0.054 A 7,102 4.44 0.060 B 7,102 3.93 0.061 C 7,102 3.37 0.055 D 7,102 3.09 0.051 E 7,102 2.34 0.043 F
CC SWW STS GSP UC SWP
B. Air temperature, 15 cm, oC 13,935 17.66 0.095 A 13,935 17.07 0.092 B 13,935 16.96 0.090 B 13,935 16.28 0.097 C 13,935 16.28 0.075 C 13,935 16.04 0.084 C
SWW STS GSP UC CC SWP
G. Soil moisture deficit, -22.5 cm, bars 7,146 6.22 0.075 A 7,146 3.85 0.059 B 7,146 3.34 0.054 C 7,146 2.02 0.030 D 7,146 1.73 0.019 E 7,146 1.71 0.030 E
CC STS SWP SWW UC GSP
C. Soil temperature, -7.5 cm, 12,258 18.6 0.068 12,258 18.0 0.069 12,258 17.6 0.060 12,258 17.4 0.056 12,258 16.6 0.057 12,258 16.4 0.063
SWP UC GSP SWW STS CC
GSP CC STS SWW SWP UC
o
C A B C C D D
CC GSP SWW STS SWP UC
H. Solar radiation, 12,800 181.4 12,800 162.2 12,800 159.3 12,800 148.2 12,800 114.00 12,800 42.9
watts/m2 2.48 2.43 2.50 2.27 1.81 0.81
A B B C D E
D. Relative humidity, percent 15,002 82.3 0.186 A 15,002 81.2 0.155 B 15,002 79.0 0.181 C 15,002 78.4 0.175 CD 15,002 78.2 0.175 D 15,002 77.4 0.170 E
SWP GSP UC STS SWW CC
I. Hourly 13,215 13,215 13,215 13,215 13,215 13,215
cm/hour 0.0014 0.0012 0.0013 0.0011 0.0008 0.0007
A AB AB BC C C
E. Vapor 14,953 14,953 14,953 14,953 14,953 14,953
CC SWW STS SWP GSP UC
J. Windspeed at 3m, km/hour 11,403 4.23 0.042 11,403 1.52 0.021 11,403 1.31 0.021 11,403 1.09 0.017 11,403 1.02 0.017 11,403 0.67 0.011
pressure 0.75 0.55 0.53 0.52 0.49 0.43
deficit, kPa 0.010 A 0.005 B 0.006 B 0.006 B 0.006 C 0.004 D
rainfall, 0.021 0.019 0.018 0.015 0.013 0.011
A B C D D E
SE = standard errors; Dif. = results of Tukey’s mean separation tests; CC = clearcut; GSP = group selection; STS = single-tree selection; SWP = shelterwood with pine residuals; SWW = shelterwood with pine and hardwood residuals; UC = unmanaged control. In the Tukey’s test, different letters in a column denote statistically significant mean comparisons among treatments.
Hourly Rainfall
Windspeed at 3 m
Means for hourly precipitation over the duration of the study varied by a factor of two, with the pine shelterwood receiving the most precipitation and the clearcut receiving roughly half that amount [table 2(I)]. The hourly values from table 2(I) translate to 182 and 91 cm annually, which bracket the generally accepted values of 137 to 152 cm of precipitation annually in the Ouachita Mountains (Skiles 1981). The annual precipitation pattern is of interest; although the monthly means vary by treatment the trends from month to month reflect the lower amounts of rainfall experienced in the region during the summer months (fig. 9).
Significant differences in windspeed were observed among treatments, though one treatment stands out. All treatments except the clearcut had mean windspeeds < 1.6 km/hour [table 2(J)]. The clearcut has a mean windspeed of 4.23 km/hour, nearly three times the mean windspeed of the pine-hardwood shelterwood and more than six times the mean windspeed of the unmanaged control [table 2(J)]. The diurnal pattern shows that the hourly distribution of windspeed is generally linearly distributed at low levels at night between 2000 hours and 0800 hours, but then follows a normal distribution during the day from 0800 hours to
95
020_Guldin.pmd
95
2/26/2004, 2:10 PM
30
100
80 Relative humidity (percent)
Air temperature at 2 m, ˚C
25
20
15
Clearcut Group selection
10
60
40
Clearcut Group selection Single-tree selection
Single-tree selection 20
Pine shelterwood
5
Pine shelterwood Pine-hardwood shelterwood
Pine-hardwood shelterwood
Unmanaged control
Unmanaged control 0
0
0
400
800
1200
1600
0
2000
400
1200
800
1600
2000
Day (hour)
Day (hour)
Figure 1—Mean hourly air temperature at 2 m by treatment.
Figure 4—Mean hourly relative humidity by treatment.
30
2.5
25
2.0
Clearcut Group selection Single-tree selection
Vapor pressure deficit (kPa)
Air temperature at 15 cm, ˚C
Pine shelterwood
20
15 Clearcut Group selection
10
Pine-hardwood shelterwood Unmanaged control
1.5
1.0
0.5
Single-tree selection Pine shelterwood
5
0.0
Pine-hardwood shelterwood Unmanaged control 0 0
400
800
1200
1600
0
2000
400
1200
800
1600
2000
Day (hour)
Day (hour)
Figure 5—Mean hourly vapor pressure deficit by treatment.
Figure 2—Mean hourly air temperature at 15 cm by treatment.
16
Soil moisture deficit at -7.5 cm, bars
25
20
15 Clearcut Group selection
10
Single-tree selection
Single-tree selection Pine shelterwood
12
Pine-hardwood shelterwood Unmanaged control
10 8 6 4 2
Pine shelterwood
800
1200
1600
Figure 3—Mean hourly soil temperature at a depth of 7.5 cm by treatment.
r
r ce
m
be
be
r be
ct o O
m te
Figure 6—Mean monthly soil moisture deficit at a depth of 7.5 cm by treatment.
96
96
e
Year (month)
Day (hour)
020_Guldin.pmd
Ju n
ay M
ril Ap
2000
De
400
Se p
0
Au gu st
0
0
ar ch
Unmanaged control
ry
Pine-hardwood shelterwood
M
5
Ja nu a
Soil temperature at -7.5 cm, ˚C
Clearcut Group selection
14
30
2/26/2004, 2:10 PM
Soil moisture deficit at -22.5 cm, bars
Clearcut
Pine shelterwood
Clearcut
Pine shelterwood
Group selection
Pine-hardwood shelterwood
Group selection
Pine-hardwood shelterwood
Single-tree selection
Unmanaged control
Single-tree selection
Unmanaged control
16
0.040
14
0.035 0.030
Rainfall (cm/hr)
12 10 8 6
0.025 0.020 0.015 0.010
4 0.005
2
er No ve m be r De ce m be r
be
Se p
O
te m
ct ob
r
us t
e Ju n
Au g
il
ay M
Ap r
y M
ar
ar
ry
ru Fe b
Ja nu a
r be
De c
Se
O
ct
em
ob
be
r
er
t us
em
e
pt
Au g
M
Ju n
ay
ril Ap
ch ar M
ru
ar
y
ry Fe b
Ja nu a
ch
0.000
0
Year (month)
Year (month)
Figure 9—Mean monthly rainfall by treatment. Figure 7—Mean monthly soil moisture deficit at a depth of 22.5 cm by treatment. Clearcut Group selection
Pine shelterwood
Single-tree selection
Unmanaged control
Pine shelterwood
Single-tree selection
Unmanaged control
Pine-hardwood shelterwood
7
Pine-hardwood shelterwood
700
6
Windspeed at 3 m (km/hr)
600
Solar radiation (watts/m2)
Clearcut Group selection
500 400 300 200 100
5
4
3
2
1
0
0 0
-100 0
500
1000
1500
400
800
1200
1600
2000
Day (hour)
2000
Day (hour)
Figure 8—Mean hourly solar radiation by treatment.
2000 hours p.m., with a peak at roughly 1400 hours (fig. 10). The differences between the clearcut and the other treatments are such that the nighttime values for the clearcut treatment are roughly equal to the highest afternoon values for the other treatments, and the mean windspeed for the clearcut at its maximum is greater than 6 km/hour.
DISCUSSION A ranking of the mean differences among variables by treatment suggests that the microclimatic effects associated with different reproduction cutting methods vary considerably in magnitude. Variables for which the greatest treatment mean is more than double that of the least are windspeed,
Figure 10—Mean hourly windspeed at 3 m aboveground by treatment.
solar radiation, and the soil moisture block at 22.5-cm depth (5.26, 3.23, and 2.64 times greater, respectively). Variables for which the difference between greatest and least treatment means is < 20 percent include the air temperature at 2 m, soil temperature, air temperature at 15 cm, and relative humidity (14, 13, 10, and 6 percent, respectively.) The management of shade has been cited as a key element in reproduction cutting methods that rely upon natural regeneration (Baker and others 1996); these results suggest that it is certainly among the most noticeable effects. When comparing the microclimatic conditions of a clearcut vs. a group selection opening, results suggest that there are important differences. The clearcut is more fully open 97
020_Guldin.pmd
97
2/26/2004, 2:10 PM
and exposed than the group selection, as judged by higher means for the solar radiation, windspeed, soil temperature, and air temperature at 15-cm variables. Though temperatures are higher in the clearcut in the microclimatic zone immediately above and below the soil surface, the windspeed suggests that turbulent flow helps promote convective heat dissipation, and as a result, seedlings would not be subject to VPDs as high as those reported for the group selection. Prescriptions that call for the use of group selection as a substitute for clearcuts must be made with the acknowledgment that there will be important microclimatic differences between the two treatments.
control and the single-tree selection: when prescribing the latter, enough cutting must be done to allow sunlight to reach the forest floor at levels high enough to support seedling establishment and survival. Solar radiation levels and means for other microclimatic variables in the study might be sufficient in the unmanaged control treatment to support seedling establishment, but levels of photosynthesis required to support acceptable height growth of pine seedlings in that treatment are not likely to be achieved. That in itself is the most important microclimatic difference between the unmanaged control and the single-tree selection treatments.
Something unusual is occurring in the group selection openings. The data for the air temperature at 2 m in the group selection appears to be more than an instrumentation problem, because the air temperature sensor in the group selection treatment was repeatedly checked and was replaced during the course of the study. The most obvious possibility is the existence of a localized thermal inversion within the group opening, the effect of which is increased due to the lack of airflow. More work is needed to better establish and characterize the existence of this phenomenon in group openings.
Further work is needed to develop an analytical process that allows one to compare variables when one or more stations are offline. The requirement that data be included in this study only during concurrent station operations led to the exclusion of a majority of the observations. Analysis of those data under a better process could produce a more robust quantitative comparison, by promoting annual, monthly, or hourly comparisons over time. In addition, unpublished data exist that measure seedling growth during this study; further work is needed to relate seedling growth to these microclimatic variables.
Data do not point to a clearly discernible microclimatic effect in the retention of a hardwood component in the shelterwood treatments. The major differences between treatments are the higher means for the relative humidity in the pine shelterwood and the higher means for the two SMD and VPD variables in the pine-hardwood shelterwood. That may point to an influence in the hardwood component reducing soil moisture and subjecting the stand to a higher moisture stress from transpirational water loss. However, any such influence is far from convincingly demonstrated. For those variables where one might expect the pine shelterwood to have higher means than the pine-hardwood shelterwood, such as solar radiation and windspeed, the opposite was observed.
ACKNOWLEDGMENTS
Finally, most of the microclimatic differences between the single-tree selection and the unmanaged control were minimal. The unmanaged control had higher relative humidity, lower VPD, lower windspeed, and lower soil temperature than the single-tree selection, though most of those variable means were not the highest or lowest across all treatments in the study. The one microclimatic difference of tremendous importance between the unmanaged control and the single-tree selection, and in fact between the unmanaged control and all other treatments, was the mean for the solar radiation variable. The unmanaged control had the lowest solar radiation of all treatments, and more than three times lower than the single-tree selection treatment. This points to the major difference between the unmanaged
Thanks to former Southern Research Station employees John McGilvray, who installed and repaired the stations, and Leif Anderson, who conducted monthly visits. Thanks also to Tim Martin of the University of Florida, who gave valuable advice on the calculation of the VPD variable.
LITERATURE CITED Baker, J.B. 1994. An overview of stand-level ecosystem management research in the Ouachita/Ozark National Forest. In: Baker, J,B., comp. Symposium on ecosystem management research in the Ouachita Mountains: pretreatment conditions and preliminary findings. Gen. Tech. Rep. SO-112. New Orleans: U.S. Department of Agriculture, Forest Service, Southern Forest Experiment Station: 18-28. Baker, J.B.; Cain, M.D.; Guldin, J.M. [and others].1996. Unevenaged silviculture for the loblolly and shortleaf pine forest cover types. Gen. Tech. Rep. SO-118. Asheville, NC: U.S. Department of Agriculture, Forest Service, Southern Research Station. 65 p. Guldin, J.M.; Baker, J.B.; Shelton, M.G. 1994. Midstory and overstory plants in mature pine/hardwood stands of the Ouachita/Ozark National Forests. In: Baker, J.B., comp. Symposium on ecosystem management research in the Ouachita Mountains: pretreatment conditions and preliminary findings. Gen. Tech. Rep. SO-112. New Orleans: U.S. Department of Agriculture, Forest Service, Southern Forest Experiment Station: 29-49. Skiles, A. 1981. Arkansas climate atlas. Little Rock, AR: Arkansas Energy Office. 93 p.
98
020_Guldin.pmd
98
2/26/2004, 2:10 PM