This article has been accepted for publication in a future issue of this journal, but has not been fully edited. Content may change prior to final publication. Citation information: DOI 10.1109/JPHOT.2018.2811758, IEEE Photonics Journal
Microdisk resonator with negative thermal optical coefficient polymer for refractive index sensing with thermal stability Tao Ma1,2, Jinhui Yuan1,3,*, Feng Li3,*, Lei Sun1, Zhe Kang3, Binbin Yan1, Qiang Wu4, Xinzhu Sang1, Kuiru Wang1, Heng Liu2, Fang Wang2, Bo Wu2, Chongxiu Yu1, and Gerald Farrell5 1
State Key Laboratory of Information Photonics and Optical Communications, Beijing University of Posts and Telecommunications (BUPT), Beijing 100876, China 2 College of Electronic and Electrical Engineering, Henan Normal University, Xinxiang 453007, China 3 Photonics Research Centre, Department of Electronic and Information Engineering, The Hong Kong Polytechnic University, Hung Hom, Kowloon, Hong Kong, China 4 Department of Physics and Electrical Engineering, Northumbria University, Newcastle Upon Tyne, NE1 8ST, United Kingdom 5 Photonics Research Center, School of Electronic and Communications Engineering, Dublin Institute of Technology, Kevin Street, Dublin 8, Ireland
Abstract: In this paper, we propose a microdisk resonator with negative thermal optical coefficient (TOC) polymer for refractive index (RI) sensing with thermal stability. The transmission characteristics and sensing performances by using quasi-TE01 and quasi-TM01 modes are simulated by three-dimensional finite element method. The influences of the TOC, RI, and thickness of the polymer on the sensing performances are also investigated. The simulation results show that the RI sensitivity Sn and temperature sensitivity ST with different polymers are in the ranges of 25.1~26 nm/RIU and 67.3~75.2 pm/K for quasi-TE01 mode, and 94.5~110.6 nm/RIU and 1.2~51.3 pm/K for quasi-TM01 mode, respectively. Moreover, figure-of-merit of the temperature sensing for quasi-TM01 mode is in the range of 2×10⁴~8×10³, which can find important application in the implementation of the adiabatic devices.
Keywords: Microdisk resonator; sensors; refractive index; temperature
1. Introduction Silicon based photonic integrated circuit (PIC) platform has attracted much interest in past decades [1]. Particularly, silicon photonic configurations were widely adopted as optical sensors in environmental and biomedical applications. Silicon is suitable for many spectroscopic sensing applications benefiting from its wide transparent spectral window, which covers from
* Corresponding author. Email address:
[email protected] (Jinhui Yuan),
[email protected] (Feng Li) 1943-0655 (c) 2018 IEEE. Translations and content mining are permitted for academic research only. Personal use is also permitted, but republication/redistribution requires IEEE permission. See http://www.ieee.org/publications_standards/publications/rights/index.html for more information.
This article has been accepted for publication in a future issue of this journal, but has not been fully edited. Content may change prior to final publication. Citation information: DOI 10.1109/JPHOT.2018.2811758, IEEE Photonics Journal
1100 nm to 6500 nm. The rapid development of complementary metal-oxide semiconductor (CMOS) technique has greatly promotes the evolution of the PIC technology [2, 3]. Up to now, silicon-on-insulator (SOI) platform is mostly adopted in the design and fabrication of PICs due to the CMOS compatibility. Moreover, SOI waveguide has a large refractive index (RI) contrast between the silicon core and the silica substrate, which can reduce the cross section of waveguide to nanometer scale. In the course of miniaturization of photonic devices, high quality factor (Q factor) micro-resonators, including micro-rings, racetracks, toroids, microdisks, and spheres, have attracted much attention due to their remarkable enhancements of light-matter interaction and wide applications in sensing, metrology and nonlinear optics [4-9]. Among these micro-resonators, microdisk resonators as whispering gallery resonators are CMOS compatible and can be easily fabricated. Compared with micro-ring resonators, microdisk resonators can achieve small footprint, wide free spectral ranges (FSRs), and high Q factors [10, 11]. These advantages are beneficial to improve the sensing performances for sensing applications [12, 13]. However, the SOI microdisks show vulnerability to the temperature change due to high thermo-optic coefficient of the silicon material (1.86×10⁴K1) and wavelength selectivity of the microdisks [14]. To reduce or eliminate the temperature effect, reference configurations [15], temperature control devices [16], and negative thermal optical coefficient (TOC) polymer [17] cladding are proposed. Compared with reference configurations and temperature control devices, temperature compensation by negative TOC polymers, which are also used to fabricate microfluidic channels in biological and chemical sensing, has advantages including convenient preparation, power saving, and easy integration. Furthermore, the polymer layers can also be used as the effective enrichment layers for specific analytes to functionalize the microdisk resonator based sensor devices [18]. In this paper, we propose an SOI based microdisk resonator with a negative TOC polymer cover layer for RI sensing with thermal stability. The propagating modes and transmission response of the microdisk resonator are characterized by three-dimensional finite element method (3D-FEM). The effective RI (neff) and waveguide sensitivity (Swg) of both quasi-TE01 and quasi-TM01 modes are investigated. The transmission spectra and coupling properties with different coupling gaps (Wgap) are also demonstrated. Subsequently, the RI sensing 1943-0655 (c) 2018 IEEE. Translations and content mining are permitted for academic research only. Personal use is also permitted, but republication/redistribution requires IEEE permission. See http://www.ieee.org/publications_standards/publications/rights/index.html for more information.
This article has been accepted for publication in a future issue of this journal, but has not been fully edited. Content may change prior to final publication. Citation information: DOI 10.1109/JPHOT.2018.2811758, IEEE Photonics Journal
performances including sensitivity and figure-of-merit (FOM) are analyzed. The microdisk resonator proposed can be easily fabricated with standard CMOS technique.
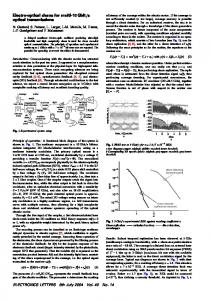
2. Microdisk resonator design The schematic of the proposed SOI microdisk resonator with a polymer cladding is shown in Fig. 1(a). A layer of negative TOC polymer (polymethyl methacrylate, PMMA, RI of 1.49) is deposited on the silicon layer (RI~3.5) of an SOI wafer before the fabrication of the waveguide. The polymer and silicon layers are etched with a same pattern thus the silicon waveguide is sandwiched between the top polymer cladding and the bottom silica substrate (RI~1.45). The cross-section of the waveguide (y-z plane) is shown in Fig. 1(b), where the geometrical dimensions are labeled. The diameter (D) of the microdisk resonator is 4 μm. The width of the bus waveguide is w. The thicknesses of the silicon and polymer layers are h1 and h2 respectively. The gap separation between the bus waveguide and the microdisk is Wgap. Wgap, w, h1, and h2 will be optimized in the following simulations. The probe optical signal can be coupled in/out the waveguide from/to an optical fiber via an in-plane grating coupler [19]. In order to investigate the sensing performance, a prefabricated U shaped microfluidic channel is inversely placed to cover the microdisk resonator. Thus the whole resonator and the coupling section of the bus waveguide will be immersed in the flowing solutions with RI nc injected into the microfluidic channel [20].
Fig. 1. (a) Schematic architecture of the double-layers microdisk resonator and (b) the cross-section of the y-z plane of the waveguide.
The propagating modes and transmission response of the microdisk resonator will be investigated by 3D-FEM, which is widely used in the characterization of integrated photonic devices [21, 22]. 1943-0655 (c) 2018 IEEE. Translations and content mining are permitted for academic research only. Personal use is also permitted, but republication/redistribution requires IEEE permission. See http://www.ieee.org/publications_standards/publications/rights/index.html for more information.
This article has been accepted for publication in a future issue of this journal, but has not been fully edited. Content may change prior to final publication. Citation information: DOI 10.1109/JPHOT.2018.2811758, IEEE Photonics Journal
3. Characterization of the mcirodisk resonator 3.1 Mode characteristics During the propagation in the long bus waveguide between the input grating and the coupling point to the microdisk resonator, the light other than the propagation modes supported by the bus waveguide will leak out. We consider the propagation modes of the bus waveguide only as the input field, which are obtained by boundary mode analysis with scattering boundary condition in simulation. The wavelength of the input light is fixed at 1550 nm. The upper cladding of the microdisk is aqueous solution (RI~1.33).
Fig. 2. Effective refractive indices of (a) quasi-TE mode and (b) quasi-TM mode of the bus waveguide as a function of w with different h2 and a fixed h1 of 220 nm at the wavelength of 1550 nm. The insets show the corresponding mode field distributions of the quasi-TE mode and quasi-TM mode calculated at 1550 nm, respectively, the white and black arrows indicating the electric and magnetic field directions.
The mode field distributions and corresponding effective refractive indices with different w and h2 are shown in Figs. 2(a) and 2(b), respectively. The propagation modes are classified into two groups as quasi-TE or quasi-TM modes. Since the confinement of mode field in the silicon layer of quasi-TE modes is better than that of quasi-TM modes, the quasi-TE modes have much larger neff than quasi-TM modes. With a given h2, the number of modes increases as w increases. The influences of h2 on neff for quasi-TM modes are much greater than that for 1943-0655 (c) 2018 IEEE. Translations and content mining are permitted for academic research only. Personal use is also permitted, but republication/redistribution requires IEEE permission. See http://www.ieee.org/publications_standards/publications/rights/index.html for more information.
This article has been accepted for publication in a future issue of this journal, but has not been fully edited. Content may change prior to final publication. Citation information: DOI 10.1109/JPHOT.2018.2811758, IEEE Photonics Journal
quasi-TE modes because of the larger penetration depth into the polymer layer of quasi-TM modes. When w is chosen as 500 nm, only quasi-TE01 and quasi-TM01 modes exist in the bus waveguide. We consider them as the injected modes in the following simulations.
Fig. 3. Effective refractive indices of the modes propagate in the bus waveguide as a function of w with different h1 and a fixed h2 of (a) 110 nm and (b) 220 nm at the wavelength of 1550 nm.
The mode field distributions and corresponding effective refractive indices with different w and h2 are shown in Figs. 2(a) and 2(b), respectively. The propagation modes are classified into two groups as quasi-TE or quasi-TM modes. Since the confinement of mode field in the silicon layer of quasi-TE modes is better than that of quasi-TM modes, the quasi-TE modes have much larger neff than quasi-TM modes. With a given h2, the number of modes increases as w increases. The influences of h2 on neff for quasi-TM modes are much greater than that for quasi-TE modes because of the larger penetration depth into the polymer layer of quasi-TM modes. When w is chosen as 500 nm, only quasi-TE01 and quasi-TM01 modes exist in the bus waveguide. We consider them as the injected modes in the following simulations. Besides h2, the thickness of silicon layer h1 is also simulated. With h2 values of 110 and 220 nm, the neff curves of the propagation modes with different h1 are shown in Figs. 3(a) and 3(b), respectively. With the increase of h1, the portion of mode field that confined in the silicon layer will increase, which will increase the neff and simultaneously the number of modes. If the mode field is well confined in the silicon layer, obviously the impact of the polymer layer will be 1943-0655 (c) 2018 IEEE. Translations and content mining are permitted for academic research only. Personal use is also permitted, but republication/redistribution requires IEEE permission. See http://www.ieee.org/publications_standards/publications/rights/index.html for more information.
This article has been accepted for publication in a future issue of this journal, but has not been fully edited. Content may change prior to final publication. Citation information: DOI 10.1109/JPHOT.2018.2811758, IEEE Photonics Journal
weakened. It can be observed from Fig. 3 that the differences between the neff curves with h2=110 and 220 nm are gradually reduced along the increase of h1. The sensitivity (S) is a crucial parameter for evaluating the sensing performance. Here, the RI sensitivity (Sn) and temperature sensitivity (ST) are respectively defined as the resonant wavelength shift (Δλres) versus the solution RI change (Δnc) and the temperature change (ΔT) of the analytes as follows Sn
Δ Δ Δneff Sdev Swg,n , Δnc Δneff Δnc
ST
Δ Δ Δneff Sdev Swg,T , ΔT Δneff ΔT
(1)
where Δneff is the change of neff and Sdev=Δλ/Δneff is the device sensitivity. Swg,n=Δneff/Δnc and Swg,T=Δneff/ΔT are the waveguide sensitivities of the RI and temperature sensing, which depend on the waveguide structures.
Fig. 4. Influences of h2 on (a) ΔSwg,n and (b) ΔSwg,T for quasi-TE01 and quasi-TM01 modes.
In order to enhance the overall sensitivity, it is necessary to optimize both the device and waveguide sensitivities. Here, the variations of Swg,n and Swg,T versus h2 for quasi-TE01 and quasi-TM01 modes are shown in Figs. 4(a) and 4(b), respectively. From Figs. 4(a) and 4(b), both Swg,n and Swg,T reduce with the increase of h2 where the sensitivity variation of quasi-TE01 mode is more significant than that of quasi-TM01 mode. While comparing the sensitivities of the two modes, the sensor has a much higher RI sensitivity Swg,n but a lower temperature sensitivity Swg,T for quasi-TM01 mode than that of quasi-TE01 mode. 3.2 Transmission responses 1943-0655 (c) 2018 IEEE. Translations and content mining are permitted for academic research only. Personal use is also permitted, but republication/redistribution requires IEEE permission. See http://www.ieee.org/publications_standards/publications/rights/index.html for more information.
This article has been accepted for publication in a future issue of this journal, but has not been fully edited. Content may change prior to final publication. Citation information: DOI 10.1109/JPHOT.2018.2811758, IEEE Photonics Journal
Besides the sensitivity, the Q factor of the microdisk will determine the spectral resolution and affect other performance of the sensor in the measurement of spectral shift [23]. Q factor can be calculated by Q /,
(2)
where λres is the central wavelength and δ is the full width at half maximum of the resonant peak used for sensing. Another important parameter for evaluating the sensing performance of the microdisk resonator is the extinction ratio (ER), which is defined as ER 10log10 H m ax H min ,
(3)
where Hmax and Hmin are respectively the maximum and minimum on the transmission spectrum of the device. The transmission spectra with different Wgap for the quasi-TE01 and quasi-TM01 modes are simulated. The Q factor and ER of the resonance peaks near wavelength 1550 nm are obtained from the transmission spectra, as shown in Figs. 5(a) and 5(b), respectively. The different curves are obtained with different h2 varying from 0 to 440 nm. The Q factor increases monotonically with the increase of Wgap from 0 to 200 nm. However, the ER first increases to the maximum value with a critical coupling, and then decreases sharply. With the increase of h2 from 22 to 440 nm, Wgap of the critical coupling increases from 43 to 60 nm. Therefore, there is a trade-off between the Q factor and ER. A larger Wgap will result in a higher Q factor but a smaller ER. When a value of 80 nm is chosen for Wgap, the corresponding ER varies from 9 to 14.5 dB when h2 varies from 22 to 440 nm. For the quasi-TM01 mode, critical coupling can also be obtained when Wgap is ~30 nm. The Q factor of quasi-TM01 mode is much lower than that of quasi-TE01 mode. The variations of the Q factor and ER curves are similar to that of the quasi-TE01 mode except for the curves with near zero h2. From Fig. 5(a), the quasi-TE01 mode is very sensitive to the polymer layer. The introduction of a very thin polymer layer with h2=22 nm leads to great changes of the curves for quasi-TE01 mode. But the changes of the curves for quasi-TM01 mode are very minor with such thin polymer layer. Due to the different polarized directions of the quasi-TE01 mode and the quasi-TM01 mode, their coupling strengths between the bus waveguide and microdisk resonator have different changes after introducing the polymer layer. Then the coupling strength induces the significantly different variations of the Q 1943-0655 (c) 2018 IEEE. Translations and content mining are permitted for academic research only. Personal use is also permitted, but republication/redistribution requires IEEE permission. See http://www.ieee.org/publications_standards/publications/rights/index.html for more information.
This article has been accepted for publication in a future issue of this journal, but has not been fully edited. Content may change prior to final publication. Citation information: DOI 10.1109/JPHOT.2018.2811758, IEEE Photonics Journal
factor and ER curves in Figs. 5(a) and 5(b).
Fig. 5.The variations of Q factor and ER versus Wgap with different h2 for (a) quasi-TE01 mode and (b) quasi-TM01 mode. The transmission spectra of (c) quasi-TE01 mode and (d) quasi-TM01 mode with h2 of 0 and 110 nm. (e) The optical field distributions with a 1550 nm CW pump for quasi-TE01 mode (A,B) and quasi-TM01 mode (C,D) in microdisk resonators with (A,C) and without (B,D) the 110 nm polymer layer.
When Wgap is chosen as 80 nm, the transmission spectra of the microdisk resonator for the quasi-TE01 and quasi-TM01 modes are shown in Figs. 5(c) and 5(d), respectively. The free spectral range (FSR) of the transmission spectra is ~60 nm for both modes. The black solid (h2=0 nm) and red dashed (h2=110 nm) curves represent the transmission spectra with and without the upper polymer layer, respectively. When the upper polymer layer is introduced, the ER of the transmission spectrum decreases for quasi-TE01 mode but increases for quasi-TM01 mode. It should be noted that the wavelength 1550 nm is the resonant wavelength of both quasi-TE01 and quasi-TM01 modes with the 110 nm polymer layer. Without the polymer layer, the wavelength 1550 nm will be off-resonant for both modes. 1943-0655 (c) 2018 IEEE. Translations and content mining are permitted for academic research only. Personal use is also permitted, but republication/redistribution requires IEEE permission. See http://www.ieee.org/publications_standards/publications/rights/index.html for more information.
This article has been accepted for publication in a future issue of this journal, but has not been fully edited. Content may change prior to final publication. Citation information: DOI 10.1109/JPHOT.2018.2811758, IEEE Photonics Journal
The optical field distributions in microdisk resonators with and without the 110 nm polymer layer, which are pumped with a 1550 nm CW light, are shown in Fig. 5(e). For the quasi-TE01 mode, the on-resonant state with the polymer layer and the off-resonant state without the polymer layer are shown in the insets A and B, respectively. The field distributions for the quasi-TM01 mode are shown in C and D accordingly. From Fig. 5(e), high intensity optical fields in the microdisk resonator are established with an on-resonant pump but the intra cavity fields are very weak with an off-resonant pump.
4. Sensing performances and proposed fabrication process 4.1 RI sensing and thermal stability analysis In applications, the solutions flowing in the microfluidic channel will have different RIs with different concentrations. For aqueous solutions, the RI nc will be a little higher than the RI of water. We characterize the transmission spectra of the microdisk resonator with h2 of 110 nm and a varying nc from 1.33 to 1.39. The transmission spectra with the quasi-TE01 and quasi-TM01 modes are shown in Figs. 6(a) and 6(b), respectively. The resonant wavelengths are shifted towards long wavelength by 1.42 nm for quasi-TE01 mode and 6.38 nm for quasi-TM01 mode with the increase of nc for both modes. With increasing of nc, the ER of quasi-TE01 mode increases along the shift but a decrease of ER is observed for quasi-TM01 mode. When the cladding RI (nc) increases, the field confinement in core of waveguide weaken. On the other hand, the electric fields in cladding of waveguide enhance. As a results of the different polarized directions of the quasi-TE01 mode and the quasi-TM01 mode, their enhancement of electric fields in cladding are on different directions. For the quasi-TE01, the electric field increases in the horizontal direction (y axis). It is benefit for the coupling between the bus waveguide and microdisk resonator. The couple state remains closer to the critical coupling from under coupling, hence the ER of the transmission increases as shown in Fig. 6(a). However, for the quasi-TM01, the couple state has the opposite effect due to its electric field increases on the vertical direction (z axis). Therefore, the ER of the transmission decrease as shown in Fig. 6(b). The temperature sensitivity ST is used to evaluate the thermal
stability. To analyze ST, we
include the TOCs of the materials to calculate the RI changes of the waveguide caused by the 1943-0655 (c) 2018 IEEE. Translations and content mining are permitted for academic research only. Personal use is also permitted, but republication/redistribution requires IEEE permission. See http://www.ieee.org/publications_standards/publications/rights/index.html for more information.
This article has been accepted for publication in a future issue of this journal, but has not been fully edited. Content may change prior to final publication. Citation information: DOI 10.1109/JPHOT.2018.2811758, IEEE Photonics Journal
temperature variation. At the temperature of 295 K and wavelength of 1550 nm, the TOCs of Si, SiO2, PMMA and water are about 1.8×10⁻⁴/K, 2.8×10⁻⁵/K, −1.1×10⁻⁴/K and −9.9×10⁻⁵/K, respectively [24]. The thermal shifts of the resonances for quasi-TE01 and quasi-TM01 modes are investigated with a temperature variation of 20 K, as shown in Figs. 6(c) and 6(d). When the relative temperature T varies from 20 K to 20 K, the resonant wavelength increases by 2.92 nm for quasi-TE01 mode and 1.54 nm for quasi-TM01 mode, respectively. The sensitivities Sn and ST with different h2 are shown in Fig. 6(e). Compare with Fig. 4 and Fig. 6 (e), the changes of waveguide sensitivity (Swg,n and Swg,n) are similar with the total sensitivity (Sn and ST). As shown in Fig. 4 and Fig. 6(e), with the increase of h2, Sn and ST for quasi-TM01 mode decrease sharply when h2 is less than 110 nm, and then the variations become very slow. For quasi-TE01 mode, the variations of Sn and ST are much lower than that of quasi-TM01 mode. To understand the difference of the two modes, the vertical intensity distributions in the waveguide along the z direction are shown in Fig. 6(f) with different h2. The dashed vertical lines indicate the positions of the top surface of the polymer layer with different thickness. For quasi-TE01 mode, the field intensity in the polymer layer is much lower than that in the Si layer. In contrast, the field intensity of quasi-TM01 mode is much stronger in the polymer layer and upper cladding (solutions) than that in the Si layer. Thus, the RI sensitivity Sn for quasi-TE01 mode is smaller than that for quasi-TM01 mode because of the lower intensity in the upper cladding. On another side, high intensity in the negative TOC polymer layer of the quasi-TM01 mode has naturally reduced its temperature sensitivity ST comparing with that of quasi-TE01 mode. With the increase of h2, the interaction between the optical field of quasi-TM01 mode and the surrounding solutions are significantly affected especially when the top surface of the polymer layer is close to the peak position of the field intensity. Hence the sensitivities Sn and ST are both reduced quickly in this region. When the top surface of the polymer layer is far from the peak of the field intensity, the impact of the polymer layer thickness becomes very weak. For quasi-TE01 mode, the variations of Sn and ST caused by the increase of h2 are much smaller than that of quasi-TM01 mode.
1943-0655 (c) 2018 IEEE. Translations and content mining are permitted for academic research only. Personal use is also permitted, but republication/redistribution requires IEEE permission. See http://www.ieee.org/publications_standards/publications/rights/index.html for more information.
This article has been accepted for publication in a future issue of this journal, but has not been fully edited. Content may change prior to final publication. Citation information: DOI 10.1109/JPHOT.2018.2811758, IEEE Photonics Journal
Fig. 6. Transmission spectra with different nc for (a) quasi-TE01 mode and (b) quasi-TM01 mode. Transmission spectra with different T for (c) quasi-TE01 mode and (d) quasi-TM01 mode.(e) Sn and ST with different h2, and (f) field energy of the waveguide along z axis with different h2.
To be more realistic, we investigate the sensing performance with adoption of several different polymers including CYTOP, PDMS, PMMA, DR1/PMMA, and SU-8 as a 110 nm coating layer. The RI (np) and TOCs (tp) of these polymers are listed in Table 1. For comparison, the difference of sensitivities between these polymers and the CYTOP is shown in Fig. 7. ΔSn and ΔST represent the relative changes of Sn and ST comparing with the CYTOP layer covered resonator. Sn for quasi-TE01 and quasi-TM01 modes with the CYTOP layer are 94.5nm/RIU and 25.1nm/RIU, respectively. The relative change ΔSn with different polymers are shown in Fig. 7(a) at different np for the different polymers. With the increase of np, ΔSn increases by 16 nm/RIU for quasi-TM01 mode but only 0.8 nm/RIU for quasi-TE01 mode. ST for quasi-TE01 and quasi-TM01 modes are 75.2 pm/K and 51.3 pm/K respectively with CYTOP layer. The influence on ΔST by different tp of different polymers is shown in Fig. 7(b). ΔST decreases quickly for quasi-TM01 1943-0655 (c) 2018 IEEE. Translations and content mining are permitted for academic research only. Personal use is also permitted, but republication/redistribution requires IEEE permission. See http://www.ieee.org/publications_standards/publications/rights/index.html for more information.
This article has been accepted for publication in a future issue of this journal, but has not been fully edited. Content may change prior to final publication. Citation information: DOI 10.1109/JPHOT.2018.2811758, IEEE Photonics Journal
mode with decrease of tp. When tP decreases to 4.66×10⁻⁴K-1 by using PDMS polymer, ΔST is ~50 pm/K for quasi-TM01 mode but only 8 pm/K for quasi-TE01 mode. The influence of the TOC on ΔST for quasi-TM01 mode is greater than that for quasi-TE01 mode. Table 1 RI and TOCs of several polymers Polymers
RI
TOC (×10 K )
Ref.
CYTOP
1.34
0.5
[25]
4
1
PDMS
1.41
4.66
[26]
PMMA
1.49
1.1
[27]
DR1/PMMA
1.49~1.51
1.1~1.35
[28]
SU-8
1.58
1.8
[29]
Fig. 7. Changes of (a) ΔSn and (b) ΔST of Sn and ST for the polymers with different np and TOCs. Table 2 Comparison of the RI and temperature sensing performances between different configurations Sn(nm/RIU)
ST(pm/K)
δ (nm)
FOM of RI sensing
FOM of Ref. temperature sensing
Waveguide grating -
-
88.5
1.61
-
0.055
[30]
Cascaded ring
-
-
293.9
0.155
-
1.9
[31]
Microsphere
WGM
-
245
0.0015
-
163
[32]
Microbubble
WGM
-
200
0.00172
-
116
[33]
Racetrack
-
70
-
0.75
934
-
[34]
Slot ring
TE
-
27
1.56
-
0.18
[35]
TE0
104
78.7
371
0.28
TM0
319
34.1
1139
0.12
101~104
0.25~0.28
Configuration
Microring Microdisk
modes
WGM(TE01) 25.1~26 WGM(TM01) 94.5~110.6
67.3~75.2 1.2~51.3
0.28 0.25 5.9
16~19
[36]
4
2×10 ~8×10
our 3
work
To compare the sensing performance with other sensing structures, the figure-of-merit (FOM) is used to evaluate the sensing performance [30, 37]. It is defined as the ratio between the sensitivity S and δ as following FOM S S Q res .
(4)
In our work, the δs of the transmission spectra for quasi-TE01 and quasi-TM01 modes are 1943-0655 (c) 2018 IEEE. Translations and content mining are permitted for academic research only. Personal use is also permitted, but republication/redistribution requires IEEE permission. See http://www.ieee.org/publications_standards/publications/rights/index.html for more information.
This article has been accepted for publication in a future issue of this journal, but has not been fully edited. Content may change prior to final publication. Citation information: DOI 10.1109/JPHOT.2018.2811758, IEEE Photonics Journal
~0.25 and ~5.9 nm, respectively. Taking into account of the negative TOC polymers, the FOMs of the Sn and ST for quasi-TE01 mode are in the ranges of 101~104 and 0.25~0.28, respectively. Meanwhile FOMs of Sn and ST for quasi-TM01 mode are in the ranges of 16~19 and 2×10⁴~8×10³, respectively. The RI and temperature sensing performances for different configurations are compared in Table II. The proposed microdisk resonator based sensor achieves the lowest ST of 1.2 pm/K and FOM of 2×10⁴, which are beneficial to reduce the thermal effect of integrated devices. Moreover, the proposed CMOS compatible sensor is easy to fabricate and integrate compared with cascaded microring [31], microsphere [32], and microbubble [33]. 4.2 Proposed fabrication process In experiments, the microdisk resonator can be fabricated by using the standard CMOS technique [19] and nanoimprint technique [38, 39]. The nanoimprint technique is widely applied to a variety of polymers due to its precise dimension control, low cost, and simple process. The pre-fabricated flexible microfluidic channel will be installed after the fabrication of the microdisk resonator [34]. The microfluidic channels can be fabricated with polyethylene (PE), polypropylene (PP), polydimethylsiloxane (PDMS), SU-8, PMMA, or SiO2 [41-45]. The proposed fabrication process is illustrated in Fig. 8 as follows (1) The nanoimprint process is performed, A mold with reverse patterns of the microdisk and the bus waveguide is press into a thin polymer film on a silicon substrate. (2) The double-layer waveguide and microdisk are formed by silicon etching. (3) The microfluidic channel is inversely mounted on the top of the platform.
Fig. 8. Schematic diagram of the fabrication process of the proposed microdisk resonator. 1943-0655 (c) 2018 IEEE. Translations and content mining are permitted for academic research only. Personal use is also permitted, but republication/redistribution requires IEEE permission. See http://www.ieee.org/publications_standards/publications/rights/index.html for more information.
This article has been accepted for publication in a future issue of this journal, but has not been fully edited. Content may change prior to final publication. Citation information: DOI 10.1109/JPHOT.2018.2811758, IEEE Photonics Journal
5. Conclusion In summary, a microdisk resonator with negative TOC polymer layer is proposed for RI sensing with thermal stability. The transmission spectra and sensing performances of the proposed microdisk resonator are characterized by the 3D-FEM. The simulation results show that the influence of the polymer upper cladding on the RIs for quasi-TM01 mode is greater than that for quasi-TE01 mode. Moreover, the investigations on Q factor and ER of the microdisk resonator indicate that the critical coupling also exists as that in the traditional microdisk resonators. The thickness of the polymer layer affects Sn and ST greatly for quasi-TM01 mode but slightly for quasi-TE01 mode. With different negative TOC polymers, Sn of 25.1~26 nm/RIU and ST of 67.3~75.2 pm/K are obtained for quasi-TE01mode. For quasi-TM01 mode, Sn and ST are 94.5~110.6 nm/RIU and 1.2~51.3 pm/K, respectively. A low temperature sensitivity of 1.2 pm/K is achieved with the proposed microdisk resonator, which is important for development of thermal stable and integrated sensing devices.
Acknowledgments This work is supported in part by the Government of Ireland Scholarship in the College of Engineering & Built Environment, the National Natural Science Foundation of China (61475023), the Beijing Youth Top-notch Talent Support Program (2015000026833ZK08), the Natural Science Foundation of Beijing (4152037), the Fund of State Key Laboratory of Information Photonics and Optical Communications (BUPT) P. R. China (IPOC2016ZT05 and IPOC2017ZZ05), the Key Project of Henan Education Department (15A510029), and the Young Foundation of Henan Normal University (2015QK05).
References [1] A. Novack, M. Streshinsky, R. Ding, Y. Liu, A. E. Lim, G. Lo, T. Baehr-Jones, and M. Hochberg, "Progress in silicon platforms for integrated optics ," Nanophotonics, vol. 3, no. 4-5,pp. 205-214, 2014. [2] W. Bogaerts, S. K. Selvaraja, P. Dumon, J. Brouckaert, K. De Vos, D. Van Thourhout, and R. Baets, "Silicon-on-Insulator Spectral Filters Fabricated With CMOS Technology," IEEE Journal of Selected Topics in Quantum Electronics, vol. 16, no. 1, pp. 33-44, Jan. 2010. [3] S. K. Selvaraja, W. Bogaerts, P. Dumon, D. Van Thourhout, and R. Baets, "Subnanometer Linewidth Uniformity in Silicon Nanophotonic Waveguide Devices Using CMOS Fabrication Technology," IEEE Journal of Selected Topics in Quantum Electronics, vol. 16, no. 1, pp. 316-324, Jan. 2010. 1943-0655 (c) 2018 IEEE. Translations and content mining are permitted for academic research only. Personal use is also permitted, but republication/redistribution requires IEEE permission. See http://www.ieee.org/publications_standards/publications/rights/index.html for more information.
This article has been accepted for publication in a future issue of this journal, but has not been fully edited. Content may change prior to final publication. Citation information: DOI 10.1109/JPHOT.2018.2811758, IEEE Photonics Journal
[4] A. Van Eeghem, S. Werquin, J. W. Hoste, A. Goes, E. Vanderleyden, P. Bienstman, and P. Dubruel, "Double positive effect of adding hexaethyelene glycol when optimizing the hybridization efficiency of a microring DNA detection assay," Applied Surface Science, vol. 405, pp. 321-328, May. 2017. [5] A. Ramachandran, S. Wang, J. Clarke, S. J. Ja, D. Goad, L. Wald, E. M. Flood, E. Knobbe, J. V. Hryniewicz, and S. T. Chu, "A universal biosensing platform based on optical micro-ring resonators," Biosensors & Bioelectronics, vol. 23, no. 7, pp. 939-944, Feb. 2008. [6] K. J. Vahala, "Optical microcavities,"Nature, vol. 424, pp. 839-846, Aug. 2003. [7] R. W. Boyd and J. E. Heebner, "Sensitive disk resonator photonic biosensor," Applied Optics, vol. 40, no. 31, pp. 5742-5747, Nov. 2001. [8] S. Yang, Y. Wang, and H. Sun, "Advances and Prospects for Whispering Gallery Mode Microcavities," Advanced Optical Materials, vol. 3, no. 9,pp. 1136-1162, Aug. 2015. [9] J. Wang, T. Zhan, G. Huang, P. K. Chu, and Y. Mei, "Optical microcavities with tubular geometry: properties and applications," Laser & Photonics Review, vol. 8, no. 4, pp. 521-547, 2014. [10] M.Soltani, Q. Li, S.Yegnanarayanan, and A. Adibi,"Toward ultimate miniaturization of high Q silicon traveling-wave microresonators," Optics Express, vol. 18, no. 19, pp. 19541-19557, Sep. 2010. [11] B.Momeni, S.Yegnanarayanan, M.Soltani, A. A.Eftekhar, E. S. Hosseini, and A.Adibi,"Silicon nanophotonic devices for integrated sensing," Journal of Nanophotonics, vol. 3, no. 1, p. 031001, Apr. 2009. [12] S. C.Eom, and J. H. Shin, "Design and Optimization of Horizontal SlotMicrodisk Sensors," IEEE Photonics Technology Letters, vol. 25, no. 19, pp. 1859-1862, Oct. 2013. [13] I. S.Grudinin, and N. Yu, "Finite-element modeling of coupled optical microdisk resonators for displacement sensing," Journal of the Optical Society of America B, vol. 29, no. 11, pp. 3010-3014, Nov. 2012. [14] K.Padmaraju, and K. Bergman, "Resolving the thermal challenges for siliconmicroring resonator devices," Nanophotonics,vol. 3, no. 4-5, pp. 269–281, Aug. 2014. [15] H. S. Lee, G. D. Kim, and S. S. Lee, "Temperature Compensated Refractometric Biosensor Exploiting Ring Resonators," IEEE Photonics Technology Letters, vol. 21, no. 16, pp. 1136-1138, Aug. 2009. [16] Q. Fang, J. Song, X. Luo, L. Jia, M. Yu, G. Lo, and Y. Liu, "High Efficiency Ring-Resonator Filter With NiSi Heater," IEEE Photonics Technology Letters, vol. 24, no. 5, pp. 350-352, Mar. 2012. [17] J. Teng, P. Dumon, W. Bogaerts, H. Zhang, X. Jian, X. Han, M. Zhao, G. Morthier, and R. Baets, "Athermal
Silicon-on-insulator
ring
resonators
byoverlaying
a
polymer
cladding
on
narrowedwaveguides," Optics Express, vol. 17, no. 17,pp. 14627, Aug. 2009. [18] V. Singh, P. Lin, N. Patel, H. Lin, L. Li, Y. Zou,F. Deng, Ch. Ni, J. Hu, J.Giammarco,A. P.Soliani, B.Zdyrko, I.Luzinov, S. Novak,J. Novak, P,Wachtel, S. Danto, J. D. Musgraves,K. Richardson, L. C.Kimerling and A. M Agarwal,"Mid-infrared materials and devices on a Si platform for optical sensing," Science and Technology of Advanced Materials, vol. 15, no. 1, p. 014603, Feb. 2014. [19] W. Bogaerts, R. Baets, P. Dumon, V. Wiaux, S. Beckx, D. Taillaert, B. Luyssaert, J. Van Campenhout, P. Bienstman, and D. Van Thourhout, "Nanophotonic waveguides in silicon-on-insulator fabricated with CMOS technology," Journal of Lightwave Technology, vol. 23, no. 1, pp. 401-412, Jan. 2005. 1943-0655 (c) 2018 IEEE. Translations and content mining are permitted for academic research only. Personal use is also permitted, but republication/redistribution requires IEEE permission. See http://www.ieee.org/publications_standards/publications/rights/index.html for more information.
This article has been accepted for publication in a future issue of this journal, but has not been fully edited. Content may change prior to final publication. Citation information: DOI 10.1109/JPHOT.2018.2811758, IEEE Photonics Journal
[20] D. X. Xu, M. Vachon, A. Densmore, R. Ma, S. Janz, A. Delâge, J. Lapointe, P. Cheben, J. H. Schmid, and E. Post, "Real-time cancellation of temperature induced resonance shifts in SOI wire waveguide ring resonator label-free biosensor arrays," Optics Express, vol. 18, no. 22, pp. 22867-22879, Oct. 2010. [21] O.
C. T.
R. Zienkiewicz, The Finite Element Method: Its Basis and Fundamentals.
Butterworth-Heinemann: Elsevier, 2013. [22] T. I. Zohdi, An Introduction to the Finite-Element Method, in Mechanical Engineers' Handbook: Materials and Mechanical Design, Volume 1, Third Edition (ed M. Kutz) vol. 1. Hoboken: John Wiley & Sons, Inc., 2005. [23] C. Ciminelli, C. M. Campanella, F. Dell Olio, C. E. Campanella, and M. N. Armenise, "Label-free optical resonant sensors for biochemical applications," Progress in Quantum Electronics, vol. 37, no. 2, pp. 51-107, Mar. 2013. [24] D. Lee, J. Bae, S. Hong, H. Yang, and Y. B. Kim, "Optimized antireflective silicon nanostructure arrays using nanosphere lithography," Nanotechnology, vol. 27, no. 21, pp. 215302, May 2016. [25] A. Lacraz, M. Polis, A. Theodosiou, C. Koutsides, and K. Kalli, "Femtosecond Laser Inscribed Bragg Gratings in Low Loss CYTOP Polymer Optical Fiber," IEEE Photonics Technology Letters, vol.27, no.7, pp. 693-696, Jan. 2015. [26] C. Morenohernández, D. Monzónhernández, E. O. Lópezfigueroa, I. Hernándezromano, J. Villatoro, M. Torrescisneros, M. A. Cruzgarcia, and O. E. Paredesgallardo, "Optical fiber temperature sensor based on a microcavity with polymer overlay," Optics Express, vol. 24, no. 5, pp. 5654-5661, Mar. 2016. [27] R. S. Moshrefzadeh, M. D. Radcliffe, T. C. Lee, and S. K. Mohapatra, "Temperature dependence of index of refraction of polymeric waveguides," Journal of Lightwave Technology, vol. 10, no. 4, pp. 420-425, Apr. 1992. [28] F. Qiu, F. Yu, A. M. Spring, and S. Yokoyama, "Athermal silicon nitride ring resonator by photobleaching of Disperse Red 1-doped poly(methyl methacrylate) polymer," Optics Letters, vol. 37, no. 19, pp. 4086-4088, Oct. 2012. [29] L. Liang, C. Zheng, Y. Yan, X. Sun, F. Wang, C. Ma, and D. Zhang, "Low-power and high-speed thermo-optic switch using hybrid silica/polymer waveguide structure: design, fabrication and measurement," Journal of Modern Optics, vol. 59, no. 12, pp. 1084-1091, Jul. 2012. [30] Y. Jr Hung, C. J. Wu, T. H. Chen, T. H. Yen, and Y. C. Liang, "Superior Temperature-Sensing Performance in Cladding-Modulated Si Waveguide Gratings," Journal of Lightwave Technology, vol. 34, no. 18, pp. 4329-4335, Sep. 2016. [31] H. T. Kim and M. Yu, "Cascaded ring resonator-based temperature sensor with simultaneously enhanced sensitivity and range," Optics Express, vol. 24, no. 9, pp. 9501-9510, May 2016. [32] C. H. Dong, L. He, Y. F. Xiao, V. R. Gaddam, S. K. Ozdemir, Z. F. Han, G. C. Guo, and L. Yang, "Fabrication of high-Q polydimethylsiloxane optical microspheres for thermal sensing,"Applied Physics Letters, vol. 94, pp. 231119, Jun. 2009. [33] J. M. Ward, Y. Yang, and S. N. Chormaic, "Highly Sensitive Temperature Measurements With Liquid-Core Microbubble Resonators," IEEE Photonics Technology Letters, vol. 25, no. 23, pp. 1943-0655 (c) 2018 IEEE. Translations and content mining are permitted for academic research only. Personal use is also permitted, but republication/redistribution requires IEEE permission. See http://www.ieee.org/publications_standards/publications/rights/index.html for more information.
This article has been accepted for publication in a future issue of this journal, but has not been fully edited. Content may change prior to final publication. Citation information: DOI 10.1109/JPHOT.2018.2811758, IEEE Photonics Journal
2350-2353, Sep. 2013. [34] C. Wang, Q. Quan, S. Kita, Y. Li, and M. Lončar, "Single-nanoparticle detection with slot-mode photonic crystal cavities," Applied Physics Letters, vol. 106, no. 26, p. 261105, Jun. 2015. [35] L. Zhou, K. Okamoto, and S. J. B. Yoo, "Towards athermal slotted silicon microring resonators with UV-trimmable PMMA upper-cladding," in Lasers and Electro-Optics and Conference on Quantum electronics and Laser Science Conference (CLEO/QELS) Maryland: Optical Society of America, 2009, CTuBB3. [36] P. Liu and Y. Shi, "Simultaneous measurement of refractive index and temperature using a dual polarization ring," Applied Optics, vol. 55, no. p. 3537-3541, May 2016. [37] Y. Ma, N. Nguyen-Huu, J. Zhou, H. Maeda, Q. Wu, M. Eldlio, J. Pištora, and M. Cada, "Mach–Zehnder Interferometer-Based Integrated Terahertz Temperature Sensor," IEEE Journal of Selected Topics in Quantum Electronics, vol. 23, pp. 4601607, Jul. 2017. [38] S. Y .Chou, P. R. Krauss, and P. J. Renstrom, "Imprint Lithography with 25-Nanometer Resolution," Science, vol. 272, no. 5258, pp. 85-87, Apr. 1996. [39] C. Chao and L. J. Guo, "Polymer Microring Resonators Fabricated by Nanoimprint Technique," Journal of Vacuum Science & Technology B, vol. 20, no. 6, pp. 2862-2866, Nov/Dec. 2002. [40] V. de Katrien, B. Irene, S. Etienne, B. Peter, and B. Roel, "Silicon-on-Insulator microring resonator for sensitive and label-free biosensing," Optics Express, vol. 15, no. 12, pp. 7610-7615, Jun. 2007. [41] X. Hu, G. Xu, L. Wen, H. Wang, Y. Zhao, Y. Zhang, D. R. S. Cumming, and Q. Chen, "Metamaterial absorber integrated microfluidic terahertz sensors," Laser & Photonics Reviews, vol. 10, no. 6pp. 962-969, Oct. 2016. [42] B. R. Watts, Z. Zhang, C. Xu, X. Cao, and M. Lin, "Integration of optical components on-chip for scattering and fluorescence detection in an optofluidic device," Biomedical Optics Express, vol. 3, no. 11, pp. 2784-2793, Nov. 2012. [43] A. Densmore, M. Vachon, D. X. Xu, S. Janz, R. Ma, Y. H. Li, G. Lopinski, A. Delâge, J. Lapointe, C. C. Luebbert, Q. Y. Liu, P. Cheben, and J. H. Schmid, "Silicon photonic wire biosensor array for multiplexed real-time and label-free molecular detection," Optics Letters, vol. 34, no. 23, pp. 3598-3600, Dec. 2009. [44] G. Gervinskas, D. J. Day, and S. Juodkazis, "Optofluidic Fabry-Pérot sensor for water solutions at high flow rates," Optical Materials Express, vol. 2, no. 3, pp. 279-286, Mar. 2012. [45] M. Soltani, J. Lin, S. Saraf, R. Forties, M. Lipson, and M. Wang, "Optofluidic Electrical Manipulation of Individual Biomolecules with nm-scale Precision," in CLEO: 2013 San Jose, California : Optical Society of America, 2013, p. AM4M.3.
1943-0655 (c) 2018 IEEE. Translations and content mining are permitted for academic research only. Personal use is also permitted, but republication/redistribution requires IEEE permission. See http://www.ieee.org/publications_standards/publications/rights/index.html for more information.