letters to nature
Acknowledgements. This work was supported by the National Science Foundation Materials Research Science and Engineering Center at the University of Massachusetts.
non-crystalline minerals declined, and more stable crystalline minerals accumulated. Soil organic carbon content followed a similar trend, accumulating to a maximum after 150,000 years, and then decreasing by 50% over the next four million years. A positive relationship between non-crystalline minerals and organic carbon was also observed in soils through the climate gradient, indicating that the accumulation and subsequent loss of organic matter were largely driven by changes in the millennial scale cycling of mineral-stabilized carbon, rather than by changes in the amount of fast-cycling organic matter or in net primary productivity. Soil mineralogy is therefore important in determining the quantity of organic carbon stored in soil, its turnover time, and atmosphere–ecosystem carbon fluxes during long-term soil development; this conclusion should be generalizable at least to other humid environments. Our primary gradient was a chronosequence of six sites (300 yr to 4,100 kyr) located at the same elevation and climate in areas dominated by native Metrosideros polymorpha trees and Cibotium tree ferns (Table 1)3,4. The soils formed from volcanic ash overlying either lava or a lava-ash mixture. Soil organic carbon and radiocarbon a
Soil carbon (%) 0
10
20
30
40
50
0 Substrate age 0.3 kyr 20 2.1 kyr 20 kyr
Depth (cm)
3. Zhang, G., Fournier, M. J., Mason, T. L. & Tirrell, D. A. Biological synthesis of monodisperse derivatives of poly(a, L-glutamic acid): model rodlike polymers. Macromolecules 25, 3601–3603 (1992). 4. Bujard, H. et al. A T5 promoter-based transcription-translation system for the analysis of proteins in vitro and in vivo. Meth. Enzymol. 155, 416–433 (1987). 5. Le Grice, S. F. J. & Gruninger-Leitch, F. Rapid purification of homodimer and heterodimer HIV-1 reverse transcriptase by metal chelate affinity chromatography. Eur. J. Biochem. 187, 307–314 (1990). 6. Wulfman, D. S., Yousefian, S. & White, J. M. The synthesis of aryl diazomethanes. Synth. Commun. 18, 2349–2352 (1988). 7. Robinson, C. & Ward, J. C. Liquid-crystalline structures in polypeptides. Nature 180, 1183–1184 (1957). 8. Wee, E. L. & Miller, W. G. Liquid crystal-isotropic phase equilibria in the system poly-g-benzyl-a, Lglutamate) solutions. Nature 346, 44–45 (1990). 10. Flory, P. J. Phase equilibria in solutions of rod-like particles. Proc. R. Soc. Lond. A 234, 73–89 (1956). 11. Kricheldorf, H. R. a-Aminoacid-N-carboxy-anhydrides and Related Heterocycles 170–176 (Springer, New York, 1987). 12. Du Pre, D. B. & Samulski, E. T. in Liquid Crystals The Fourth State of Matter (ed. Saeva, F. D.) 203–247 (Dekker, New York, 1979). 13. Stroobants, A. & Lekkerkerker, H. N. W. Evidence for one-, two-, and three-dimensional order in a system of hard parallel spherocylinders. Phys. Rev. A 36, 2929–2945 (1987). 14. Watanabe, J. in Ordering in Macromolecular Systems (eds Teramoto, A., Kobayashi, M. & Norisuye, T.) 99–113 (Springer, Berlin, 1993). 15. Livolant, F. & Bouligand, Y. Liquid crystalline phases given by helical biological polymers (DNA, PBLG and xanthan). Columnar textures. J. Phys. (Paris) 47, 1813–1827 (1986). 16. Wen, X., Meyer, R. B. & Caspar, D. L. D. Observation of smectic-A ordering in a solution of rigid-rod like particles. Phys. Rev. Lett. 63, 2760–2763 (1989). 17. Albrecht, C., Lieser, G. & Wegner, G. Lamellar morphology of polydiacetylene thin films and its correlation with chain lengths. Prog. Colloid Polym. Sci. 92, 111–119 (1993). 18. Radzilowski, L. H. & Stupp, S. I. Nanophase separation in monodisperse rodcoil diblock polymers. Macromolecules 27, 7747–7753 (1994). 19. Chen, J. T., Thomas, E. L., Ober, C. K. & Mao, G.-p. Self-assembled smectic phases in rod-coil block copolymers. Science 273, 343–346 (1996). 20. Duke, R. W., Du Pre, D. B., Hines, W. A. & Samulski, E. T. Poly(g-benzyl L-glutamate) helix-coil transition. Pretransition phenomena in the liquid crystal phase. J. Am. Chem. Soc. 98, 3094–3101 (1976). 21. Demus, D. & Richter, L. Textures of Liquid Crystals (Chemie, Weinheim, 1978). 22. Samulski, E. T. & Tobolsky, A. V. Solid ‘‘liquid crystal’’ films of poly-g-benzyl-L-glutamate. Nature 216, 997 (1967). 23. Block, H. Poly(g-benzyl-L-glutamate) and Other Glutamic Acid Containing Polymers 135–142 (Gordon & Breach, New York, 1993). 24. Stupp, S. I., Son, S., Lin, H. C. & Li, L. S. Synthesis of two-dimensional polymers. Science 259, 59–63 (1993).
Correspondence and requests for materials should be addressed to D.A.T. (e-mail:
[email protected]. edu).
40
150 kyr 1,400 kyr 4,100 kyr
60
80
100
∆14C of SOM (‰)
b
Mineral control of soil organic carbon storage and turnover
-1,000 0
-600
-200
200 Turnover time of deepest horizon
20
No decay
* Earth System Science Department, University of California, Irvine, California 92697-3100, USA † Department of Geography, University of California, Santa Barbara, California 93106, USA ‡ Department of Biological Sciences, Stanford University, Stanford, California 94305-5020, USA § Department of Soil and Water Science, University of Arizona, Tucson, Arizona 85721, USA .........................................................................................................................
A large source of uncertainty in present understanding of the global carbon cycle is the distribution and dynamics of the soil organic carbon reservoir. Most of the organic carbon in soils is degraded to inorganic forms slowly, on timescales from centuries to millennia1. Soil minerals are known to play a stabilizing role, but how spatial and temporal variation in soil mineralogy controls the quantity and turnover of long-residence-time organic carbon is not well known2. Here we use radiocarbon analyses to explore interactions between soil mineralogy and soil organic carbon along two natural gradients—of soil-age and of climate— in volcanic soil environments. During the first ,150,000 years of soil development, the volcanic parent material weathered to metastable, non-crystalline minerals. Thereafter, the amount of 170
Depth (cm)
1,000 yr
Margaret S. Torn*, Susan E. Trumbore*, Oliver A. Chadwick†, Peter M. Vitousek‡ & David M. Hendricks§
40
27,000 yr 170,000 yr
60
27,000 yr 37,000 yr
80
100
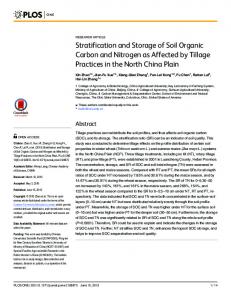
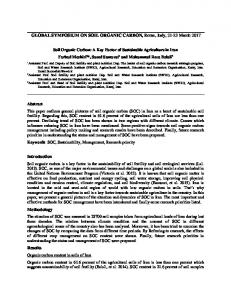
Figure 1 Chronosequences: a, carbon in soil organic matter (SOM) versus depth; b, D14C of soil organic matter versus depth. Key for both panels in a. The depth shown is the midpoint of each horizon. See Methods for details of analysis and modelling. For the four youngest sites, modelled SOM turnover items are slow relative to substrate age. They indicate that the soils are not at steady state and are still accumulating C. At 300 yr, carbon and 14C content were best explained by assuming a constant C accumulation rate and infinitely slow turnover (the C stabilized on minerals had effectively no turnover over 300 yr). The best fit for the 150-kyr site, assuming constant C inputs, was turnover of 175,000 yr. (The precipitation gradient site with similar age, climate, and vegetation, Kohala-L, had comparably depleted SOM; see Fig. 3.) If we model the same data assuming that C ceased accumulating at the 150-kyr site tens of thousands of years ago, the calculated turnover time is closer to 50,000 yr. The two oldest sites, with SOM turnover much less than substrate age, can be assumed to be at steady state. The third horizon (Bhs) at Kauai is a plinthite (stable iron oxide) layer with sharply depleted radiocarbon content.
Nature © Macmillan Publishers Ltd 1997
NATURE | VOL 389 | 11 SEPTEMBER 1997
letters to nature oldest site (Fig. 2a). Carbon inventory in the surface horizons (O and A horizons) reached its maximum at 20 kyr, and varied less with age than did deep soil C. A similar pattern was observed in the top 50 cm of these soils, based on 10 replicate soil pits per soil age4. Most of the carbon sequestered after the first few thousand years of soil development accumulated below 20 cm, in the passive fraction. Similarly, most of the organic C lost in later soil development was from the subsurface soil. The decline in the quantity of soil C stored on older substrates could result from a decline in productivity and/or an increase in turnover. Net primary productivity does peak at 150 kyr, but is only 15% less at 4,100 kyr (ref. 8)—too small a decrease to explain the 50% loss of soil C. The profile-integrated turnover rate, however, doubles between 150 and 4,100 kyr. Most of the decrease in soil organic C late in soil development therefore can be attributed to faster turnover of passive C, rather than to a decrease in plant productivity. What controls these changes in the storage and turnover of soil organic C? Volcanic soils undergo dramatic changes in mineral composition as they develop. Young volcanic soils are characterized by high organic content and an abundance of non-crystalline minerals (allophane, imogolite and ferrihydrite), which are the primary weathering products. These relatively amorphous minerals have a high degree of hydration, extensive surface area, and variable charge9,10. As a result, they can form stable organic–mineral bonds through anion and inner-sphere ligand-exchange reactions, and their geometry may be well suited for physically protecting organic matter2,11. Non-crystalline minerals are metastable. Given enough a
a
60 40 20 0 0.1
1
10
100
21 20 15
Soil carbon (%)
Soil organic C (kg m–2 )
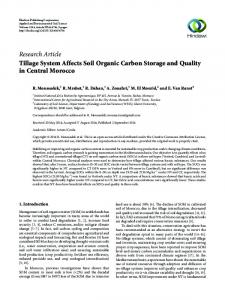
content were measured by horizon down to the depth at which relatively unweathered parent material was encountered (Table 1). Soil depth remained nearly constant to 1 Myr, as a result of soil collapse due to congruent dissolution of minerals. At the 4,100-kyr site, however, the weathered lava extended .3 m deep. Between 1.2 and 1.3 m, organic content fell by nearly 100-fold to 0.01%, and we stopped sampling at 1.5 m. At all sites, carbon (C) content declined with depth, with the steepest decline from the surface to 20–30 cm depth (Fig. 1a). Nevertheless, a significant fraction of each site’s soil organic matter (SOM) was below 20 cm, ranging from 33% at the two youngest sites to 70% at the two intermediate-aged sites. Radiocarbon content decreased with depth at all sites, with slope depending on soil age (Fig. 2)5–7. To estimate average turnover time of SOM (the reciprocal of the decomposition rate), we used 14C/12C ratios to constrain a non-equilibrium model of carbon stocks and flows (see Methods). The surface horizons were dominated by fastcycling organic matter, shown by positive (‘bomb’) D14C values (Fig. 1b, Fig. 2b). In the subsurface horizons, soil C was depleted in 14 C, yielding modelled turnover times slower than 10,000 yr at the 20-kyr, 1,400-kyr and 4,100-kyr sites, and slower than 20,000 yr at the 150-kyr site (Fig. 1b). The mineral horizons were clearly dominated by long-residence-time C, often referred to as the passive fraction of SOM1. At the youngest site, radiocarbon content in the lowest soil horizons was consistent with C accumulating at a constant rate with virtually no turnover. The total stock of organic C in soil increased with substrate age up to 150 kyr, to 60 kg m−2, and then decreased to 31 kg m−2 at the
1,000 5,000
10
5
R 2 = 0.45
b
0 0
0
45
200
0.1 500
Non-crystalline minerals (kg m–2 )
30
60
b
-400
-800 1
10
100
1,000 5,000
c
R 2 = 0.63 excluding 4,100 kyr site
0 -200 -400 -600 -800
250
-1,000 0
15
30
45
60
75
Non-crystalline minerals (%)
0 0.1
1
10
100
1,000 5,000
500
Crystalline minerals (kg m–2 )
15
Non-crystalline minerals (%)
∆ 14C of SOM (‰)
∆ 14C of SOM (‰)
400
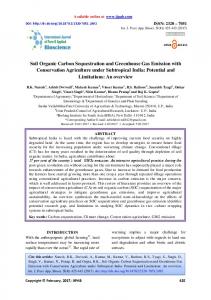
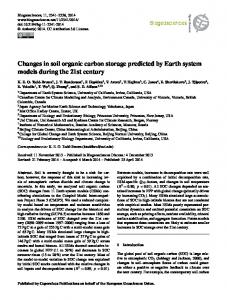
Figure 3 The quantity and turnover of soil C versus non-crystalline mineral
d
content for the six chronosequence sites. a, Soil C versus non-crystalline content of mineral horizons (that is, excluding O and A horizons) from the chronosequence sites. R2 ¼ 0:44, n ¼ 35. Plotting symbols as in Fig.1a. b, D14C versus non-
250
crystalline content of all horizons from the chronosequence sites. The solid line shows the regression between mineral abundance and D14C with chrono0 0.1
1
10
100
sequence
1,000 5,000
data,
excluding
4,100-kyr
site;
R2 ¼ 0:62,
n ¼ 39;
model:
D14 C ¼ 184 2 20 (noncrystalline %). The dashed line shows the regression for
Substrate age (kyr)
the soil-age and precipitation gradients combined (precipitation gradient n ¼ 16,
Figure 2 Soil inventory of carbon in soil organic matter (SOM; a), D14C of SOM (b),
described in Table 1); model: D14 C ¼ 119 2 17 (noncrystalline %); R2 ¼ 0:63 for
non-crystalline minerals (c), and crystalline minerals (d) versus age of soil
data from all sites except 4,100 kyr, n ¼ 55. Plotting symbols for chronosequence
substrate. Filled circles, total profile; filled triangles, surface (O and A) horizons.
data as in Fig. 1a; symbols for precipitation gradient data are L, 150 kyr, and W,
See Methods for details of soil inventory determinations.
400 kyr.
NATURE | VOL 389 | 11 SEPTEMBER 1997
Nature © Macmillan Publishers Ltd 1997
171
letters to nature Table 1 Site descriptions Site
Age of parent material (yr)
Soil order
Elev. (m)
Mean annual temp. (8C)
Mean annual precip. (mm)
Dominant vegetation
Horizons
Depth (cm)
...................................................................................................................................................................................................................................................................................................................................................................
Chronosequence sites
...................................................................................................................................................................................................................................................................................................................................................................
Thurston Olaa Laupahoehoe Kohala Kolekole Kokee
300 2,100 20,000 150,000 1,400,000 4,100,000
Inceptisol Inceptisol Andisol Andisol Ultisol Oxisol
1,176 1,200 1,170 1,122 1,210 1,134
16 16 16 16 16 16
2,500 2,500 2,500 2,500 2,500 2,500
Metrosideros forest Metrosideros forest Metrosideros forest Metrosideros forest Metrosideros forest Metrosideros forest
Oe-4Bwb Oe-C3 Oe-2CR Oe-4CR1 Oa-CR2 Oe-Crg
0–38 0–64 0–110 0–98 0–100 0–125
...................................................................................................................................................................................................................................................................................................................................................................
Precipitation gradient sites
...................................................................................................................................................................................................................................................................................................................................................................
Kohala-A
170,000
Andisol
77
23
160
Bufflegrass pasture (Cenchrus ciliaris) Bufflegrass pasture Bufflegrass pasture Bufflegrass pasture
Kohala-B Kohala-D Kohala-E
170,000 170,000 170,000
Mollisol Andisol Andisol
185 356 674
23 22 20
180 220 570
Kohala-H
170,000
Andisol
992
18
1,060
Kohala-J
170,000
Andisol
1,158
18
1,380
Kikuyu pasture (Pennisetum clandestinum) Kikuyu pasture
Kohala-L
170,000
Andisol
1,254
17
3,000
Metrosideros forest
Amalu
400,000
Andisol
1,494
14
2,000
Metrosideros forest
Bw3
69–104
Bw2 Cr1 Bw3 BC1 Bw2 Bw3 Bw2 Bw3 Bw1 Bw2 Cr1 2Bw1 2Bw2 2Bw3 2Bw4
37–65 70–113 44–62 62–85 36–52 52–71 47–67 67–92 25–40 40–56 56–73 25–31 31–46 46–62 62–80
................................................................................................................................................................................................................................................................................................................................................................... All the sites were located on the Island of Hawaii, except the 1,400-kyr (Kolekole, Molokai) and 4,100-kyr (Kokee, Kauai) chronosequence sites, and were on undissected shield surfaces or broad ridge tops.
time, they dehydrate to crystalline clays, including halloysite, kaolinite, gibbsite, goethite and haematite10,12, that have a lower surface area and charge density, and consequently a lower affinity for SOM. Mineral composition varied substantially with site age along the chronosequence. The amount of non-crystalline minerals increased up to 150 kyr and then declined with greater age (Fig. 2c). In contrast, the amount of crystalline minerals remained low until 150 kyr, then increased steeply between 1,400 and 4,100 kyr (Fig. 2d), tracking the transition from Andisol to Oxisol. We found that the abundance of non-crystalline minerals accounted for .40% of the variation in organic C content across all the mineral horizons, substrate ages, and soil orders (excluding the O and A horizons dominated by fast-cycling plant litter; Fig. 3a). Non-crystalline minerals also strongly influenced turnover of SOM. Organic-matter D14C was highly and negatively correlated with abundance of non-crystalline mineral (R2 ¼ 0:62) except in the oldest site, which had ,10% non-crystalline content (Fig. 3b). In contrast, there was no discernible correlation between the abundance of crystalline minerals and C content or turnover across sites. The amount of C stabilized per gram was much greater for noncrystalline than for crystalline minerals. Can this relationship between non-crystalline minerals and organic C be used to predict turnover at other sites? To test this, we analysed soil samples from a precipitation gradient of eight sites formed on volcanic soils on the Island of Hawaii. Due to the effects of climate on weathering processes, the six drier sites of this gradient differed substantially in soil development and mineral composition from the chronosequence soils. The amount of non-crystalline minerals increased with precipitation across the precipitation gradient (data not shown). We sampled 16 horizons (Table 1) and found that the relationship between non-crystalline minerals and D14C along the precipitation gradient was nearly identical to that along the chronosequence (Fig. 3b). A linear regression from the chronosequence accounted for 46% of the variance in D14C on the precipitation gradient; a regression with the two data sets combined (n ¼ 55) yielded a coefficient of determination R2 ¼ 0:63 (Fig. 3b). We conclude that the ability of these soils to retain C is due to the capacity of non-crystalline minerals to stabilize large quantities of organic C for thousands of years. 172
The mechanisms identified here may be generalizable to many soils of humid environments, where weathering initially produces metastable, reactive minerals that later transform to stable, lessreactive products. In such environments common parent materials— such as granite, siltstone, sandstone and basalt—that contain feldspar, olivine, pyroxene or glass initially weather to non-crystalline minerals. In addition, in cool, wet environments, pedogenic processes create spodic horizons which have high concentrations of non-crystalline minerals and organic matter, on a wide variety of coarse-textured parent materials. In both cases, the non-crystalline minerals transform over time to weakly reactive crystalline kaolin and sesquioxide minerals13 that have a much lower capacity to stabilize C. The weathering of other common minerals follows a similar sequence of reactivity in humid environments. Biotite and muscovite micas initially weather to 2 : 1 clays such as vermiculite and smectite; these in turn weather to kaolin (1 : 1 clay) and gibbsite with large losses of mineral surface area and reactivity. These changes are not as large as those observed in volcanic soils (Fig. 3)—globally, as well as on our chronosequence, Andisols contain twice as much organic soil C per m2 as do Oxisols or any other soil order except Histosols14 —but the pattern of change in C storage and turnover should be similar in kind to that shown here15. As mineral stability increases over time, soil minerals lose capacity to stabilize SOM. These results allow prediction of the direction and magnitude of C fluxes caused by mineralogical changes associated with millennial timescales of soil development. For example, ,25% of the world’s SOM is stored in soils that began developing after the last major deglaciation16,17; the capacity of the mineral soils to store C will change as they undergo further development, and they may eventually become long-term sources of atmospheric CO2. Among the big uncertainties in our understanding of the global carbon cycle are the current distribution of soil organic C, and how much of this large reservoir of C exchanges with the atmosphere on centennial and shorter timescales compared with millennial timescales. An understanding of mineral control over SOM storage and turnover can improve our ability to model terrestrial carbon cycling. In addition to the influence on long-term storage and turnover shown here, C stabilization by non-crystalline minerals also influences nutrient availability9 and decomposition of labile
Nature © Macmillan Publishers Ltd 1997
NATURE | VOL 389 | 11 SEPTEMBER 1997
letters to nature substrates18 in surface soils. Ecosystem models at present represent the mineral soil environment with a soil-texture parametrization which is used to partition flows of organic C into fast- and slowcycling pools19,20. We suggest that these models should include soil mineralogy as well as texture in determining storage and turnover times, based on the varying influence of different minerals18. Soil mineral composition can be estimated from soil maps tied to soil classification schemes, which reflect climate, parent material and developmental stage of soil. Our results show that across landscapes and over long timescales, the largest changes in the quantity and turnover of soil organic carbon may be due to variation in passive (mineral-stabilized) carbon deep in the soil. Passive carbon pools in turn are controlled by soil mineralogy, which exerts an influence on soil carbon storage of the same magnitude as that attributed to climate or vegetation in other studies21–24. The predictability of soil mineralogy, as it varies spatially as a function of climate and parent material and temporally as a function of soil development25,26, means that an understanding of how minerals influence soil carbon dynamics should yield significant improvements to our understanding of the role of soils M in the global carbon cycle. .........................................................................................................................
Methods Carbon analysis and turnover calculation. Soils for carbon analysis were
oven-dried at 110 8C for 48 h, sieved (2 mm), ground, and analysed with a Carlo Erba NA1500 autoanalyser. Radiocarbon content of SOM, measured by Accelerator Mass Spectrometry at Lawrence Livermore National Laboratory on targets prepared by sealed-tube, zinc reduction27, is expressed as D14C, calculated as (R 2 1)1,000. R, or fraction modern, is the per mil deviation from 14 12 C/ C ratio of oxalic acid in 195028. Analytical error averaged 8‰ for values close to modern. Carbonate was removed from Kohala B soils with dilute HCl before radiocarbon analysis. Fast-cycling C (turnover time, years–century) has positive D14C because it has incorporated a significant proportion of the 14C that was released by atmospheric nuclear weapons testing from 1959 to 19635. Before weapons testing, atmospheric D14C was approximately zero. Slowcycling C (turnover centuries–millennia) has negative D14C owing to extensive radioactive decay relative to 14C inputs from more recently photosynthesized organic material. We used a non-steady-state model to estimate turnover from our measurements of C and radiocarbon content, and substrate age. Carbon accumulation was modelled as CðtÞ ¼ ITð1 2 e 2 t=T Þ; radiocarbon content of SOM was modelled as RSOM ðtÞ ¼ ½Ratm ð1 2 e 2 ðlþ1=TÞt ÿ=½ð1 þ TlÞð1 2 e 2 t=T Þÿ, where T is turnover time, C 0 ¼ 0, I is the annual C input to soil, Ratm is fraction modern of the atmosphere, assumed equal to that of plant C input to soil, l is half-life of 14C (5,568 yr) and t is years of soil development. We assume that C loss due to erosion is negligible relative to the rate of decomposition. Soil inventory determination. The C inventory is the sum of [(% C)(bulk density)thickness] for each horizon. An analogous formula was used for inventory of the mineral groups. The profile-total radiocarbon content is the sum of [R(% C)(bulk density)thickness] for each horizon divided by total C content of the profile, where R is fraction modern, defined above. Bulk density of wax-coated clods was determined by displacement4. Soils for mineral analysis were air-dried, sieved (,2 mm), ground and subject to sequential extractions, with mass balance at each step, before analysis of Al, Fe, Si, and mineral structure29. Organic matter was removed with hydrogen peroxide and acetate. Non-crystalline mineral content was estimated by ammonium oxalate dark extraction30. Crystalline sesquioxides and kaolin were extracted with citrate dithionite31 and NaOH29, respectively. These operationally defined mineral fractions are expressed on a total-soil basis (including soil organic matter). Mineral structures were identified by X-ray diffraction and Fouriertransform infrared spectroscopy. Coarse fraction was negligible in the chronosequence soils. To quantify collapse of the soil during weathering, zirconium was used as a conservative element. Received 30 December 1996; accepted 30 June 1997. 1. Schimel, D. S. et al. Climatic, edaphic, and biotic controls over storage and turnover of carbon in soils. Glob. Biogeochem. Cycles 8, 279–294 (1994). 2. Oades, J. M. The retention of organic matter in soils. Biogeochemistry 5, 35–70 (1994). 3. Vitousek, P. M., Turner, D. R. & Kitayama, K. Foliar nutrients during long soil development in Hawaiian montane rain forest. Ecology 76, 712–720 (1995).
NATURE | VOL 389 | 11 SEPTEMBER 1997
4. Crews, T. E. et al. Changes in soil phosphorus fractions and ecosystem dynamics across a long chronosequence in Hawaii. Ecology 76, 1407–1424 (1995). 5. Goh, K. M., Rafter, T. A., Stout, J. D. & Walker, T. W. The accumulation of soil organic matter and its carbon isotope content in a chronosequence of soils developed on aeolian sand in New Zealand. J. Soil Sci. 27, 89–100 (1976). 6. Scharpenseel, H. W. & Becker-Heidmann, P. Twenty-five years of radiocarbon dating soils: paradigm of erring and learning. Radiocarbon 34, 541–549 (1992). 7. Wang, Y., Amundson, R. & Trumbore, S. A model for soil 14CO2 and its implications for using 14C to date pedogenic carbonate. Geochim. Cosmochim. Acta 58, 393–399 (1994). 8. Herbert, D. Primary productivity and resource use in Metrosideros polymorpha forest as influenced by nutrient availability and hurricane Iniki. Thesis, Univ. Hawaii, Manoa (1995). 9. Jackman, R. H. Accumulation of organic matter in some New Zealand soils under permanent pasture. II. Rates of mineralization of organic matter and the supply of available nutrients. NZ J. Agric. Res. 7, 472–479 (1964). 10. Wada, K. in Minerals in Soil Environments (eds Dixon, J. B. & Weed, S. B.) 283–304 (Soil Sci. Soc. Am., Madison, 1986). 11. Martin, J. P. & Haider, K. in Interactions of Soil Minerals with Natural Organics and Microbes (eds Huang, P. M. & Schnitzer, M.) 283–304 (Soil Sci. Soc. Am., Madison, 1986). 12. Schwertmann, U. & Taylor, R. M. in Minerals in Soil Environments (eds Dixon, J. B. & Weed, S. B.) 379–438 (Soil Sci. Soc. Am., Madison, 1989). 13. Allen, B. L. & Hajek, B. F. in Minerals in Soil Environments (eds Dixon, J. B. & Weed, S. B.) 199–278 (Soil Sci. Soc. Am., Madison, 1989). 14. Post, W. M. in The Global Carbon Cycle (ed. Heimann, M.) 277–302 (Springer, Berlin, 1983). 15. Kononova, M. M. in Soil Components Vol. 1, Organic Components (ed. Gieseking, J. S.) 475–520 (Springer, New York, 1975). 16. Schlesinger, W. H. Evidence from chronosequence studies for a low carbon-storage potential of soils. Nature 348, 232–234 (1990). 17. Harden, J. W., Sundquist, E. T., Stallard, R. F. & Mark, R. K. Dynamics of soil carbon during deglaciation of the Laurentide ice sheet. Science 258, 1921–1924 (1992). 18. Saggar, S., Tate, K. R., Feltham, C. W., Childs, C. W. & Parshotam, A. Carbon turnover in a range of allophanic soils amended with 14C-labelled glucose. Soil Biol. Biochem. 26, 1263–1271 (1994). 19. Jenkinson, D. S. & Raynor, J. H. The turnover of soil organic matter in some of the Rothemsted classical experiments. Soil Sci. 123, 298–305 (1977). 20. Parton, W. J., Schimel, D. S., Cole, C. V. & Ojima, D. S. Analysis of factors controlling soil organic matter levels in Great Plains grasslands. Soil Sci. Soc. Am. J. 51, 1173–1179 (1987). 21. Townsend, A. R., Vitousek, P. M. & Trumbore, S. E. Soil organic matter dynamics along gradients in temperature and land-use. Ecology 76, 721–733 (1995). 22. Trumbore, S. E., Chadwick, O. A. & Amundson, R. Rapid exchange between soil carbon and atmospheric carbon dioxide driven by temperature change. Science 272, 393–396 (1996). 23. Eswaren, H., Berg, E. V. D. & Reich, P. Organic carbon in soils of the world. Soil Sci. Soc. Am. J. 57, 192– 194 (1993). 24. Post, W. M., Emanuel, W. R., Zinke, P. J. & Stangenberger, A. G. Soil carbon pools and world life zones. Nature 298, 156–159 (1982). 25. Jenny, H. Factors of Soil Formation (McGraw-Hill, New York, 1941). 26. Hudson, B. D. The soil survey as paradigm-based science. Soil Sci. Soc. Am. J. 56, 836–841 (1992). 27. Vogel, J. S. A rapid method for preparation of biomedical targets for AMS. Radiocarbon 34, 344–350 (1992). 28. Stuiver, M. & Polach, H. Reporting of 14C data. Radiocarbon 19, 355–363 (1977). 29. Jackson, M. L., Lim, C. H. & Zelazny, L. W. in Methods of Soil Analysis. Part 1; Physical and Mineralogical Properties (ed. Klute, A.) 102–149 (Am. Soc. Agronomy: Soil Sci. Soc. Am. Madison, 1986). 30. Parfitt, R. L. & Henmi, T. Comparison of an oxalate extraction method and an infrared spectroscopic method for determining allophane in soil clays. Soil Sci. Plant Nutr. 28, 183–190 (1982). 31. McKeague, J. A. & Day, J. H. Dithionite- and oxalate-extractable Fe and Al as aids in differentiating various classes of soils. Can. J. Soil Sci. 46, 13–22 (1966). Acknowledgements. We thank S. Zheng and T. Crews for technical assistance; Lawrence Livermore National Laboratory’s Center for Accelerator Mass Spectrometry for radiocarbon analysis; The Nature Conservancy, US National Park Service, Parker Ranch, Kahua Ranch, Hawaii Division of Forestry and Wildlife, Hawaii Division of State Parks, and the Joseph Souza Center for access to field sites; and E. Davidson, J. Gaudinski and J. Harden for comments on the manuscript. This work was supported by National Science Foundation, Mellon Foundation, Joan Irvine Trust, and Jet Propulsion Lab-California Institute of Technology on contract to NASA. Correspondence should be addressed to M.S.T. (e-mail:
[email protected]).
Eclogite xenoliths in west African kimberlites as residues from Archaean granitoid crust formation Hugh Rollinson Department of Geography and Geology, Cheltenham and Gloucester College of Higher Education, Francis Close Hall, Swindon Road, Cheltenham GL53 0BL, UK .........................................................................................................................
Eclogites are a comparatively rare but petrologically important member of kimberlite xenolith suites. Their broadly basaltic chemistry has led many authors to propose that they represent ancient, subducted ocean crust1–3. Recent studies4–6, however, have suggested an alternative origin and propose that kimberlitic eclogites are residues from the process of Archaean granitoid crust formation. Geochemical arguments in support of this new
Nature © Macmillan Publishers Ltd 1997
173