Jan 4, 1977 - In dark-adapted retinula cells of the locust, the miniature potentials or ... by Dodge, Knight & Toyoda (1968) and subsequently demonstrated.
J. exp. Biol. (1977), 68, 137-149 fWith 9 figures Printed in Great Britain
137
MINIATURE POTENTIALS, LIGHT ADAPTATION AND AFTERPOTENTIALS IN LOCUST RETINULA CELLS BY Y. TSUKAHARA* AND G. A. HORRIDGE Department of Neurobiobgy, Research School of Biological Sciences, Australian National University, Canberra, A.C.T. Australia (Received 4 January 1977)
SUMMARY
In dark-adapted retinula cells of the locust, the miniature potentials or bumps have amplitudes of 3-7 mV when recorded in the dark-adapted state with bevelled electrodes at very low light levels. For a sample of N = 378 they had a mean amplitude of 4*55 mV and s.D. 1-59 mV. These are called dark-adapted bumps, and their distribution of amplitudes is presumably a component of the noise of the visual signal in addition to the irregularity of occurrence of bumps. The afterpotential which follows an intense flash is caused by the summation of bumps which become individually visible as they decline in frequency over a period of many minutes after the stimulus. When recorded over a period from 17 to 23 min after the stimulus, the amplitude of these light-induced dark bumps in a sample of N = 231 had a mean of 2-89 mV and s.D. of 0-92 mV. They also have a shorter duration than dark-adapted bumps. Light-adapted bumps, which are denned as bumps which arise when light of low intensity falls on light-adapted cells, are statistically indistinguishable in amplitude or duration from light-induced dark bumps. The reduction in size, as compared to dark-adapted bumps, cannot be attributed to a change in membrane potential or to an increase in membrane conductance, which actually decreases during the period of decline of the after-depolarization. Therefore in the light-adapted state, each bump is caused by the opening of fewer sodium channels, or of less effective sodium channels than in the dark-adapted state. INTRODUCTION
We begin with an observation made in this laboratory (M. Wilson, unpublished) that the amplitude of the receptor potential of a locust retinula cell sometimes does not fully recover for more than an hour after stimulation with an intense flash. At the present time a reduction in sensitivity of insect retinula cells on adaptation can be attributed to three different types of change induced by light. First, there may be a reduction in the concentration of the rhodopsin, as is well documented in the fly eye (Hamdorf & Schwemer, 1975). Secondly, there may be changes in the optical pathway so that less light reaches the receptor, as already described in the locust (Horridge & Barnard, 1965), and thirdly there may be a reduction in the size of bumps, • Present address: Research Center for Applied Information Sciences, Tohoku University, "Katahira-cho, Sendai, 980 Japan
138
Y. TSUKAHARA AND G. A. HORRIDGE
as first inferred by Dodge, Knight & Toyoda (1968) and subsequently demonstrated in Limulus, but only for short periods following an earlier bump (Srebro & Behbehani, 1974). Changes in bump size have so far been reported only in Limulus. In the following experiments we take advantage of the relatively large bumps that can be recorded at low light levels from locust retinula cells when the signal-to-noise ratio is improved by the use of bevelled electrodes. Although bumps, or miniature potentials, have played a large part in the analysis of the effect of light on Limulus photoreceptors, there is still discussion as to whether one bump in Limulus is the electrical sign of the effective capture of one photon (Yeandle & Spiegler, 1973). In the locust a statistical analysis of bumps is in agreement with the theory that the production of a bump does not require the coincidence of more than one photon (Scholes, 1966). Even so, a photon could still on occasion give rise to more than one bump. Records at different intensities show that bumps fuse together at higher light intensities to form the receptor potential. Therefore, when the stimulus is a constant number of photons, a reduction in the receptor potential could be caused by a reduction in the contribution of each bump or to a reduction in the number of bumps, or to both effects together. Although a brief decrease of the ' peak current generated per photon' is well described in Limulus (Lisman & Brown, 1975) there has so far been no suggestion that a decrease in bump size upon light adaptation is a cause of reduced sensitivity in insects. In fact, the opposite is at present indicated, at least in the fly, where the sensitivity is found to be directly proportional to the rhodopsin concentration (Hamdorf & Schwemer, 1975), from which we must infer that changes in average bump size do not contribute to sensitivity changes on adaptation. On the other hand, we have found that in the locust there is no particular wavelength which can restore the sensitivity of light-adapted retinula cells by illumination, as happens when red light acts on the blue-adapted retinula cells of the fly. In this respect, locusts differ from most other insect preparations known, and this has the consequence that in the locust the changes in sensitivity cannot also be related to the photoconversion of rhodopsin to metarhodopsin. The optical changes upon light adaptation in the locust are better known. Vacuoles of the endoplasmic retdculum migrate towards the rhabdom in the dark and away from it in the light, and it has been suggested that the reduction in refractive index around the rhabdom in the dark tends to increase sensitivity by retaining light within (Hoi ridge, 1966). The possible narrowing of the collar of pigment forming a pupil at the neck of the cone is another optical mechanism of long-term sensitivity changes. These changes, however, like the loss of rhodopsin by photoconversion, cause a reduction in the proportion of photons that are effectively caught and are not likely to have an influence on the amplitude of bumps. MATERIALS AND METHODS
The locusts (Locusta migratoria), of an Australian strain, were reared in the laboratory on wheat under a 24 h light cycle; usually 12 h light, 12 h darkness. The stimulating and recording equipment was standard in every way, as described previously (Horridge, Mimura & Hardie, 1976). Stray light of every kind must be excluded when1
Light adaptation in locust retinula cells
139
438 nm 50 mV I
\
k
\
I 1111111111 1 I ! I I I ! I I I II I
Fig. 1. Recordings with the bridge circuit to demonstrate the time course of the change in membrane resistance with a stimulus of »'5 x io1* photons cm"1 s"1 at 438 nm. The bridge is balanced in the dark with a current of a x 10"* A in pulses of aoo ms at 2 Hz. The period of the light stimulus is shown by a horizontal line. The peak, plateau, and afterdepolarization are accompanied by a reduction inresistance.Then, at the arrow, as can be seen from the appearance of the transients in the record, there begins an extended period of increased membrane resistance following the afterdepolarization. The record is continued on two lower lines for a total period of 60 s.
working on bumps: even a small panel-indicator light reflected from light-coloured clothes can be an effective stimulus. Electrodes were prepared from high-meltingpoint Pyrex glass capillary of 1 mm diameter with a glass fibre previously inserted (Tasaki et al. 1968), and filled with 3 M-KC1. They were then sharpened until the resistance fell from about 200 MQ to about 30 M£2, by the method of Brown & Fleming (1975). The only additional point that we can add to our previous description of the methods is that for recording at low noise levels it is important to adjust the backing voltage on the electrode precisely to zero to keep the cell stable.
RESULTS
The effect of strong light on locust retinula cells
When a locust retinula cell is stimulated by a strong light of any wavelength, the induced change in membrane potential consists of three or four components. There is an initial peak or dynamic phase, followed by a sustained phase called the plateau; after the stimulus is turned off there is a slowly decaying afterdepolarization, which is followed in turn by an afterhyperpolarization. The membrane resistance is decreased during the first three of these phases (Fig. 1) and the change in membrane resistance is closely proportional to the change in membrane potential. The afterdepolarization is usually followed by a small negative;oing potential change, called the afterhyperpolarization. Even if it is small, however, e afterhyperpolarization is accompanied by a definite increase in membrane resis-
140
Y. TSUKAHARA AND G. A. HORRIDGE 552 nm 50 mV
J J . J J . I 1,1 I I I I M i I I I 1I 11I I 1I
'1 W W W r W r V rVrVrVHM V I ' I V I 'i 'i 'i 'i 'i 'i 'i 'i 'i 'i 'i 'i 'i I'I 'i 'i 'i 'i 'i'' Fig. 2. Recording as in Fig. 1, but with stimulus of 55a nm.
tance which lasts for a much longer period than the afterhyperpolarization itself. Unlike the situation in the fly, the shape of the receptor potential, the duration of the afterdepolarization and the decrease in membrane resistance of the cell that accompanies them, are exactly the same when the stimulus is on the short wavelength side of the peak (Fig. 1) as when it is on the long wavelength side (Fig. 2). The change in membrane resistance that accompanies the afterhyperpolarization is also independent of the wavelength of the stimulus in its inception and duration (Figs, i, 2). We demonstrate this resistance increase to rule out a possible persistent decrease in membrane resistance as a cause of reduced receptor potentials or smaller bumps that follow an adapting stimulus. The same observations show that during the period when we measure bump amplitudes and bump durations, following the end of the afterdepolarization, the membrane is slightly hyperpolarized. If anything, this would be expected to increase the size of bumps but, in fact, we find they are diminished. The changes in bump size described below must therefore be attributed to some other active process which has not yet been mentioned. Afterdepolarization and bumps When recording a receptor potential with a low resistance electrode and satisfactory signal-to-noise ratio, a close examination of the record reveals that the trace becomes noisier during the afterdepolarization. As the afterdepolarization falls towards the resting potential, the fluctuations in the record turn gradually from indefinite noise into a clear sequence of bumps. This is shown in Fig. 3, in which the cell had previously been stimulated for 270 s at 3 x io 13 quanta cm"8 s - 1 at 393 nm. We call these bumps light-induced dark bumps as they are caused by light but appear for up to 15-20 min after the stimulus has terminated. The light-induced dark bumps clearly show that after the light has terminated there is an unseen process which is giving rise to bumps. The existence of the light-induced dark bumps appears to account fulljl
Light adaptation in locust retinula cells A
141
B
Fig. 3. The transition from noisy afterdepolarization to light-induced dark bumps. (A) 50 s after the end of aflashof 3 x i o u quanta cm"* s"1 at 393 nm for 270 s. (B) 460 s after the end of the flash. (C) 700 s after the flash. (D) 900 a after the flash. Note the progressive increase in size of the bumps during this period. The DC level is not shown here because the trace was moved down at each traverse for the sake of clarity.
for the afterdepolarization, which has so far been a puzzling phenomenon of unknown origin. The size of bumps
The bumps that are induced by very weak light in a dark-adapted cell are called dark-adapted bumps. The bump amplitude is between 3 and 7 mV. The records in Fig. 4A were from a cell which had been dark-adapted for more than 4 h and then stimulated at 2-5 x io10 quanta cm~2 s~x at 634 nm. At this wavelength the spectral sensitivity is less than 001 of that at peak. The 378 nm dark-adapted bumps plotted in Fig. 5 had a mean peak height of 4*55 mV± 1-59 s.D. Following a period of recording dark-adapted bumps, the cell was stimulated for 270 s at 3 x io 13 quanta cm"2 s"1 at 393 nm and bumps were recorded during the period from 17 to 23 min after the adapting light had been switched off. This is the period when the small afterhyperpolarization has appeared and is gradually disappearing. The bump amplitude is now between 1-5 and 3-5 mV (Fig. 4B). During this period, when the light-induced dark bumps were recorded, and after it, the amplitude of the bumps gradually increases, and the frequency of their appearance decreases. From the way that the bumps emerge from the afterdepolarization and from the noise on the afterdepolarization itself, we can conclude that the afterdepolarization is the result of the summation of many light-induced bumps. The 231 light-induced dark bumps plotted in Fig. 5 had a mean peak height of 2-89 mV ± 0-92 S.D. and are clearly on average smaller than the dark-adapted bumps. Following 10
BIB
68
142
Y. TSUKAHARA AND G . A . HORRIDGE
5mV
Fig. 4 . Sample records from which the measurements were taken. (A) Dark-adapted bumps excited by light of 634 nm at 3-5 x io10 quanta cm"1 s"1 (B) Light-induced dark bumps recorded 19 min after turning off a light of about 10' times the photon flux.
Bump amplitude (mV) Fig. 5. The distributions of amplitudes for dark-adapted bumps and light-induced dark bumps (afterpotential bumps) for the same cell. The amplitudes are almost halved by the lightadaptation.
a weaker adapting flash, the reduction in bump amplitude is less than that shown in Fig. 5. The effect of light on the distribution of bump dimensions might suggest that the dark-adapted bumps are of a different and larger kind which are inhibited by strong light and replaced by a smaller class of bump composing the afterdepolarization. The simplest conclusion, however, is that there is a single population of bumps of a mean size that is reduced by the action of light. We can now examine whether the smaller amplitude of the light-induced dark bumps is a feature which is peculiar to them alone or whether bumps that are directly
Light adaptation in locust retinula cells
Bump amplitude (mV) Fig. 6. The distribution of amplitudes for light-induced dark bumps and for light-adapted bumps, which are taken from the same cell in alternating periods. The bumps are the same irrespective of the great difference in latency (in this case, 20 min).
induced by light during the light-adapted period (which we call light-adapted bumps) are smaller than dark-adapted bumps. The light-adapted bumps were obtained by stimulating with an intermittent weak light for periods of 50 s at 8 x io10 quanta cm~2 s - 1 at 634 nm during the same period as that in which the light-induced dark bumps were recorded. Among the bumps attributed to the light stimulus at this time, there must be some that should be classified as light-induced dark bumps. As the total frequency of bumps is increased from about O'S/s to 2/s by the illumination, however, it is safe to assume that most of the bumps recorded during the periods of light are caused by the light and can therefore be called light-adapted bumps. Despite a detailed study of bump height, bump duration and by visual inspection we could find no significant difference between the additional light-adapted bumps and the light-induced dark bumps recorded in a comparable period (Fig. 6). In every way the two sets of bumps have the same appearance, although they have a latency difference of 20 min in Fig. 6. The effect of light adaptation on the fraction of photons caught
In the preceding section we showed that the size of the bumps is approximately halved by light-adaptation for a long period after the afterdepolarization has subsided to the original resting potential. This effect is therefore a significant component of the
144
Y. TSUKAHARA AND G. A. HORRIDGE
decrease in sensitivity caused by adaptation to light. In addition to the decrease in bump amplitude, another possible contribution to the sensitivity decrease comes from a reduction in the fraction of photons falling on the eye surface that are effectively caught, either by a change in the optics or by a reduction in the rhodopsin concentration. To test this possibility the number of bumps which are induced by a continuous illumination of 2-5 x io 10 quanta s - 1 cm~* at 634 nm were counted every 20 8 over a 5 min period. The average number of bumps per 20 s before the light adaptation was 35*6 and the standard deviation for 15 measurements was 9-5. On the other hand, during the period between 61 and 66 min after the standard adapting light the number of bumps per 20 s was 8-7 ± 3-9 S.D. The significant points to notice are the relatively long period of waiting for more than an hour in darkness and, even so, the large reduction in the fraction of photons effectively caught. As the rhodopsin cycle of the locust retinula cell is not yet known, it is still an open question whether this reduction in the fraction of photons caught is caused by the change in the optics or by a reduction of rhodopsin concentration. We can certainly conclude, however, that the prolonged decrease in the sensitivity of the receptor potential after an intense light is caused by capturing a smaller fraction of the photons as well as by the reduced size of the individual bumps. The shapes of the histograms and the changes in bump waveform show that we are not witnessing a progressive disappearance of the smallest bumps into the electrode noise. Further analysis of bump waveforms
Taking the opportunity offered by the large size of the locust bumps in relation to electrode noise, we went on to measure the areas of bumps as recorded, and their duration at 50 % amplitude as well as their peak heights. One reason for so doing was to show that the reduction in peak height of bumps on light-adaptation is not compensated by an increased bump duration, as might be the case if a photon capture causes the opening of a constant number of sodium channels that are differently distributed in time. Another reason was to search for classes of bump on the basis of height, duration and area because the presence or absence of such classes eliminates some models of the transduction process. These measurements, in Figs. 7-9, are from a different cell from that shown in Figs. 5 and 6. Area versus peak amplitude is plotted in Fig. 7 for dark-adapted bumps. There is an increase in area with amplitude, but the area is clearly not proportional to the square of the height, and we know that bumps are not of constant proportions. The distribution of bump areas is not grouped; bumps of a given height are not grouped according to area or vice versa. A bump of a given height can take on a wide range of values of bump area, and vice versa. Therefore, if we assume that each sodium channel makes an equal contribution to bump area, or to bump height, or to some function of both, we have to acknowledge that there must be a distribution in the number of sodium channels opened as well as a wide distribution of activation times for individual sodium channels. It is more fundamental, in our view, to establish this from individual bumps than from receptor potentials. From our measurements we have no sign that a bump is caused by the opening of a small number of sodium channels which might be revealed by clusters in the distributions. We can conclude also that peak height is as good a measure as any of bump magnitude.
Light adaptation in locust retinula cells
146
Y . TSUKAHARA AND G . A . HORRIDGE
4 «
•
•
6 * •
5
•
•
•
4 -
• • • -*
•
•
i
3
«.
•
t
2
•
•
f
r
i
6-6
i
i
6-0
5-3
: i
r
i
i
it'
b
i
s •
* ••
1 :
•
>
*
i:
•
•
i
i
4-7 40 3-6 3-3 Duration at 50 % (ms)
t
t |>
j
t.
#
• t i
1
3-0
2-66
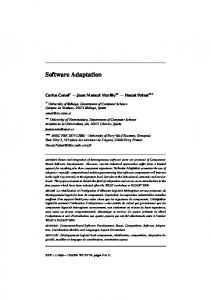
Fig. 8. The height* of dark-adapted bumps plotted as a function of the width of each at 5° % amplitude. The durations of the bumps are plotted on a reciprocal scale to emphasize a possible inverse relationship between width and height, if one exists. There is, however, no particular relationship, and no clustering of the measurements along the vertical lines.
Peak height versus duration at 50% amplitude is plotted in Figs. 8 and 9, giving further information about the time course of the electrical response and the effect of light adaptation. Again a wide range of scatter is observed on both axes. There is no sign that certain bump durations, or that certain bump amplitudes are favoured. From these two sets of two-dimensional distributions it is clear that the effect of light-adaptation is a decrease of amplitude and duration simultaneously, with no marked change in the factors that cause the scatter in both measurements. The lightadapted bumps are smaller and yet steeper in their decay than the dark-adapted bumps. The light-induced dark bumps are statistically indistinguishable from lightadapted bumps. We have already shown that the decreased amplitude and duration of light-adapted bumps cannot be related to a decrease in membrane resistance (Figs. 1, 2). Therefore, for at least an hour after a bright flash, fewer or less effective sodium channels are activated in the formation of a bump, and their activation is completed sooner.
Light adaptation in locust retinula cells
r
e
i
4
147
I"
i
r
4-7
40
'
3-6 3-3 30 Duration at 50 % (ms)
2-66
2-3
Fig. 9. Aa in Fig. 8, but for light-adapted bumps. There is no clustering of bump features, from which we conclude that each bump is caused by the opening of a large number of sodium channels.
DISCUSSION
The bumps of locust retinula cells, recorded by bevelled electrodes, have a better signal-to-noise ratio than has been reported so far in other preparations. They are therefore potentially useful for analysis of the transduction process. The electrical response in insect photoreceptors is caused mainly by an increase in conductance of sodium channels (Fulpius & Baumann, 1969) and a fundamental question is whether one sodium channel is opened by the excitation of one rhodopsin molecule. Our data show quite clearly that such a model is inapplicable because the bumps vary smoothly in amplitude, duration and area over a wide range, and they change in a graded way with light or dark adaptation. It appears more likely that some intermediate process which acts in a graded way comes between the excitation of a rhodopsin molecule and the opening of the sodium channels. For the same reason we can say that excitation of one rhodopsin molecule does not open a small number (say less than 5) sodium channels otherwise the increments would be noticed as groups in Figs. 7-9. Therefore, as in Limuhis (Baylor & Fuortes, 1970) or cephalopod (Yoshikami & Hagins, 1971), there must be an intermediate stage of amplification or transmitter which causes the opening of many (and a variable number) of sodium channels. It has been estimated that a single photon produces a 12-25 fN P&k response in turtle cones and 130 fiV in rods (Baylor & Hodgkin, 1973). The much larger bumps of Locusta, up to 10 mV, are therefore presumably a sign that many more channels are opened. Our data on variability of bump duration also shows, on this theory, that there is a distribution of activation for the opening of sodium channels once the bump is initiated. This in turn
148
Y. TSUKAHARA AND G. A. HORRIDGE
means that bumps of a given height or area could be caused by activation of different numbers of sodium channels. Secondly, the afterpotential can no longer be considered as the sign of persistently opened sodium channels which are activated during the receptor potential and remain open. We show that even the last stages of the longest afterpotential consist of bumps, and possibly the afterpotential is composed entirely of bumps, although their latency is extraordinary. Recently, Bader, Baumann & Bertrand (1976) have found in bee retinula cells that an entry of calcium ions is associated with the fall from peak to plateau, and is accompanied by a decrease in sensitivity. The effect continues after the background light has been extinguished. The measurements were made on the receptor potential and therefore it is impossible to distinguish between a reduced electrical response per photon and a reduced number of photons reaching the rhodopsin molecules. Our observation on bumps show that both of these effects occur. Furthermore, when changes in the number of photons effectively caught by the optics are excluded, the effect called light-adaptation, which continues in locust cells for at least an hour after a stimulus, is indistinguishable from the reduction to bump amplitude and bump duration that is observed in light-adapted bumps. Therefore, as a hypothesis for future studies, we infer that the component of light-adaptation in locust and bee retinula cells that is caused by the entry of Ca2+ ions during a previous response is a reduced bump size. The second aspect of our findings is the demonstration that the afterdepolarization is indistinguishable from a summation of light-induced dark bumps. Recently Minke, Wu & Pak (1975), working with a (trp) mutant Drosophila in which receptor potentials rapidly decay, inferred that the afterdepolarization noise arises from bumps, and that the afterpotential shares some common transducer pathway with the receptor potential. They were unable to discern a change in bump amplitude, however, possibly because flies are different in this respect from the locust. We might well ask how bumps can arise long after the stimulus if bumps are the signs of the capture of photons. A slow process of amplification intervenes between the photon capture and the sudden electrical response. The final aspect of our findings that we would like to emphasize is that the noise measured in photoreceptors is by no means all attributable to shot noise due to the random arrival of photons. Because bumps appear in a range of heights and durations, there is an additional source of noise which we call transducer noise. We give quantitative statistical data for the variation in bumps in Figs. 6-8. The transducer noise is difficult to quantify for the purpose of measuring the fundamental feature of the retinula cell, the signal-to-noise ratio, because the variation in bump shape and amplitude seen by the electrode is not necessarily the same as that seen by the retinula cell axon. A difference between the two can arise from the cable properties of the cell. The bumps may be recorded from the distal parts of the cell body, whereas the noise limitations in vision are governed by the signal which arrives proximally at the terminal of the retinula axon. In fact, the general impression gained from a study of the cable properties of the retinula cells and their axons in the fly (Scholes, 1969; Zettler & Jarvilehto, 1971) and in other insects (Ioannides & Walcott, 1971), is that there is little degeneration of the signal, even between the retinula cell and the tip of its axon several hundred microns distant. From this we
Light adaptation in locust retinula cells
149
infer that the distance between the origin of a bump and the tip of the electrode within the soma has little effect on the shape and size of the recorded bump. Therefore the scatter of measurements in Figs. 6-8 are real indications of transducer noise. Before the transducer noise measured in the retinula cell can be assessed as a contribution to the noise in vision, it will be necessary to make independent measurements further down the line proximally, to find out whether there is a noise contribution additional to the photon noise. These tests can be made on the behaviour or on higherorder cells. Our observations certainly indicate that noise caused by the random arrival of photons is not the only source of noise in primary photoreceptors. REFERENCES BADER, C. R., BAUMANN, F. & BERTRAND, D. (1976). Role of intracellular calcium and sodium in light adaptation in the retina of the honeybee drone {Apis mdlifera L.). J. gen. Pkysiol. 67, 475—91. BAYLOR, A. D. & FUORTES, M. G. F. (1970). Electrical responses of single cones in the retina of the turtle. J. Physiol., Land. 207, 77-92. BAYLOR, D. A. & HODGKIN, A. L. (1973). Detection and resolution of visual stimuli by turtle photoreceptors. J. Physiol., Lond, 334, 163-96. BROWN, K. T. & FLEMING, D. G. (1975). Instrumentation and technique for beveling fine micropipette electrodes. Brain Res. 86, 172-180. DODGE, F. A., KNIGHT, B. W. & TOYODA, J. (1968) Voltage noise in Limulus visual cells. Science, Wash. 160, 88-90. FULPIUS, B. & BAUMANN, F. (1969). Effect of sodium, potassium and calcium ions on slow and spike potentials in single photoreceptor cells. J. gen. Physiol. 53, 541-61. HAMDORF, K. & SCHWBMBR, J. (1975). Photoregeneration and the adaptation process in insect photoreceptors. In Photoreceptor Optics (ed. A. W. Snyder and R. Menzel). Heidelberg: Springer. HORRTDGB, G. A. (1966). The retina of the locust. In The Functional Organization of the Compound Eye (ed. C. G. Bernhard). Oxford: Pergamon Press. HORRIDGE, G. A. & BARNARD, P. B. I. (1965). Movement of palisade in locust retinula cells when illuminated. Q. Jl microsc. Sci. 106, 131—5. HORRIDOB, G. A., MIMURA, K., & HARDIE, R. C. (1976). Fly photoreceptors. III. Angular sensitivity
as a function of wavelength and the limits of resolution. Proc. R. Soc. Lond. B 194, 151-77. IOANNIDES, A. C. & WALCOTT, B. (1971). Graded illumination potentials from retinula cell axons in the bug Lethocerus. Z. vergl. Physiol. 71, 315-26. LISMAN, J. E. & BROWN, J. E. (1975). Light-induced changes in sensitivity in Limulus ventral photoreceptors. J. gen. Physiol. 66, 473. MINKE, B., Wu, C.-F. & PAK, W. L. (1975). Induction of photoreceptor voltage noise in the dark in Drosophila mutant. Nature, Lond. 358, 84-6. SCHOLES, J. H. (1966). Discontinuity of the excitation process in locust retinula cells. Cold Spring Harb. Symp. quant. Biol. 30, 517-37. SCHOLES, J. (1969). The electrical responses of the retinal receptors and the lamina in the visual system of the fly Musca. Kybernetik 6, 149-62. SREBRO, R. & BEHBEHANI, M. (1974). Light adaptation in the ventral photoreceptor of Limulus. J. gen. Physiol. 64, 166-185. TASAKI, K., TSUKAHARA, Y., ITO, S., WAYNER, M. J. & Yu, W. Y. (1968). A simple, direct and rapid
method for filling microelectrodes. Physiol. Behav. 3, 1009-10. YRANDLE, S. & SPIEOLER, J. B. (1973). Light-evoked and spontaneous discrete waves in the ventral nerve photoreceptor of Limulus. J. gen. Physiol. 61, 552-571. YOSHIKAMI, S. & HAGINS, W. A. (1971). Ionic basis of dark current and photocurrent of retinal rods. Biophys. Soc. A. Mtg Abstr. n , 47a. ZBTTLER, F. & JARVILEHTO, M. (1971). Decrement-free conduction of graded potentials along the aron of a monopolar neuron, Z. vergl. Physiol. 73, 402-ai.