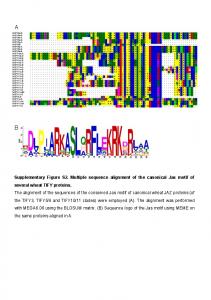
Supplementary Figure S2. Multiple sequence alignment of the canonical Jas motif of several wheat TIFY proteins. The alignment of the sequences of the ...
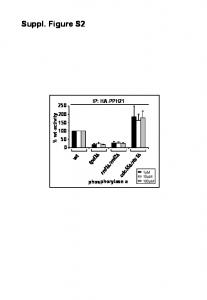
1µM. 10µM. 100µM phosphorylase a w t rrd1. â. /rrd2. â tpd3. â cdc55. â. /rts1. â. 0. 50. 200. 150. 100. 250. IP: HA-PPH21. % w. t-a c tiv ity. Suppl. Figure S2.
Supplementary Figure S3. Multiple sequence alignment of the CCT motif and GATA domain of several wheat TIFY proteins. The alignment of the sequences of ...
Page 1. SDS resistant. PA7mer. MEK1 cleavage. Latrunculin. Control. Increase in pP. A. 7mer. % of MEK1(N) @ t=0.
Page 1. TEM8. Vinculin. Talin. Ctrl TEM8-1. TEM8-2. IP-HA. MyH9 (myosin II). A. B.
YAL013W, YAR003W, YBR. 103W, YML121W protein catabolic process ( GO:0030163. ) SPAC1142.07c, SPAC13A11.04c,. SPBC1734.06, SPBC215.14c, SP.
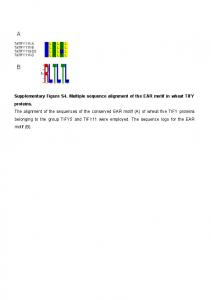
Supplementary Figure S4. Multiple sequence alignment of the EAR motif in wheat TIFY proteins. The alignment of the sequences of the conserved EAR motif (A) ...
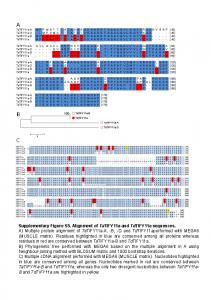
Supplementary Figure S5. Alignment of TaTIFY11a and TdTIFY11a sequences. A) Multiple protein alignment of TaTIFY11a-A, -B, -D and TdTIFY11aperformed ...
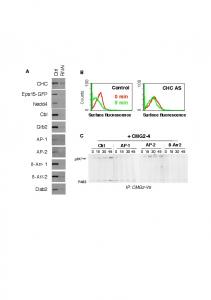
Page 1. CHC AS. B. A. Grb2. AP-1. AP-2. CHC. Cbl Ã-Arr- 1 Ã-Arr-2. Dab2. Ctrl RNAi. Eps15-GFP. Nedd4. Control. 0 min. 5 min. Surface fluorescence. Surface ...
H: HpaII C'CGG (m-sensitive). M: MspI C'CGG. H/M. H/M. H M H M H M H M. C array band. ATP1-S2 probe array band ~2.4 kb. + + + +. 1 kb la d d e r.
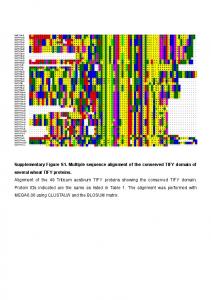
Supplementary Figure S1. Multiple sequence alignment of the conserved TIFY domain of several wheat TIFY proteins. Alignment of the 49 Triticum aestivum ...
Tumor 05 A. Chr. Position. PB5 f chr11. 41573884. 23.2% intergenic chr18. 16209166. 17.4% intergenic chr1. 87855454. 9.1% Dgkd chr8. 38677940.
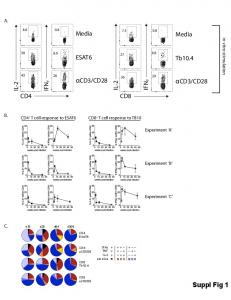
d28 d84 d308. IL-2. TNF. IFNγ pie slice. Suppl Fig 1. C. A. Experiment 'A'. Experiment 'B'. Experiment 'C'. CD4+ T cell response to ESAT6. CD8+ T cell response ...
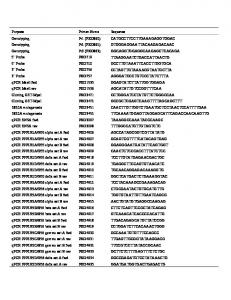
Specific primers used in qPCR of Solanum lycopersicum cv. Glamour plants. Gene locus. Solyc07g042170. Solyc12g009220. Solyc03g122190.
Page 1. Dele on at nucleo de posi on G2477, A2478 and C2488 reference DNA sequences. Figure S5.
Analysis of cellular fractions from iodixanol gradients to identify MIRE vesicles. Anti-GFP. Anti-RSV N. Anti RSV F. Anti-Calnexin. Anti-dIgA. 1 2 3 4 5 6 7 8 9 10 ...
Figure S2. Analysis of cellular fractions from iodixanol gradients to identify MIRE vesicles
5% 1 2 3 4 5 6 7 8 9
34% Iodixanol 10 11 12 13 14 15 16 17 18
19 20 21 22 23 24 25 26 27
Anti-GFP Anti-Calnexin Anti-dIgA Anti-RSV N Anti RSV F
0.16 0.08
Total Protein (mg/mL)
0
Lipid DID When the density gradient was analyzed for the myosin Vb-tail endosomes, we observed three peaks of myosin Vb localization. The first fraction of myosin Vb vesicles floated to the top of the gradient between fractions 6-10. The two additional peaks were located at fractions 18 and 25. Yet the latter two peaks were overlapping with the ER and other endosome components. When the density fractions were analyzed for the ER marker calnexin, the ER was found to localize across nearly the entire gradient peaking at fraction 18. A marker for the transcytotic pathway, dIgA, also showed three peaks. All three peaks are similar in localization to that of myoVb-tail expression. The transcytotic pathway moves from the basolateral early endosome to the common endosome before arriving at the ARE. Because cells were loaded with dIgA at the basolateral membrane, it is thought that the three peaks on the western blots may correlate with these three organelles, and the peak at fraction 25 may be the basolateral endosome. We reasoned that the more contaminating cellular structures that can be removed, the more accurate the proteomic analysis would be. The total protein concentration and lipid marker DiD show that the least contamination occurred within the 6-10 fraction peak of myosin Vb-tail expressing cells. Because fractions 6-10 were the least contaminated, and contained both myosin Vb-tail and dIgA, we decided to pool these fractions for further purification through fluorescence-activated sorting.