Mobile Positioning via Fusion of Mixed Signals of Opportunity Chun Yang Sigtem Technology, Inc. Thao Nguyen Air Force Research Lab/RYWN Erik Blasch Air Force Research Lab/RIEA
INTRODUCTION GPS is known to be susceptible to interference, jamming, blockage, and attenuation especially in urban and indoor environments. The development of positioning systems in GPS-limited environments is of great interest for both military and commercial location-based applications. In such environments, signals of opportunity (SOOP) can be explored to supplement GPS and other navigation systems [5], [9], [10]. By SOOP, we mean those signals that are not originally intended (designed) for positioning but they are ubiquitous: freely available all the time and everywhere (within a certain range). A number of terrestrial wireless communications and broadcast SOOP complement the satellite-based navigation systems for position location and navigation. Examples of such SOOP include digital television (DTV) signals [1], [3], [4], [17], [19], [30], AM/FM radio signals [6], [8], cellular mobile phone signals, and wireless local area network (WLAN or Wi-Fi) signals [2], [12], [20], [21], among others [13], [14], [15]. These signals are designed primarily for indoor reception and are available in populated areas where GPS often fails to operate properly. However, there are technical challenges using SOOP transmitters for indoor positioning. Examples of inherent technical difficulties faced by position location using broadcast digital transmissions such as DTV signals are the clock bias and drift of the signal timing source at a transmitter, which are unknown to the user [24], [25]. Due to limited height of terrestrial transmitters, the solution is most likely two-dimensional (2-D) rather than three-
Authors’ current address: C. Yang, Sigtem Technology, Inc., 1343 Parrott Drive, San Mateo, CA 94402, E-mail: (chunyang@ sigtem.com). T. Nguyen, Air Force Research Lab/RYWN, 2241 Avionics Circle, Bldg 620, Wright-Patterson AFB, OH 45433, E-mail: (
[email protected]). E. Blasch, Air Force Research Lab/RIEA, 525 Brooks Rd, Rome, NY 13441, E-mail: (erik.
[email protected]). Manuscript SYSAES-2013-0105 received June 12, 2013 and ready for publication October 20, 2013. DOI. No. 10.1109/MAES.2013.130105. Review handled by R. Wang. 0885/8985/14/ $26.00 © 2014 IEEE 34
dimensional (3-D). Another issue of importance is integrity because the signals are of opportunity and signal authentication is not always granted. At reception, severe multipath is of concern, particularly in an urban environment. A prerequisite for navigation and position location using the conventional positioning techniques is the accurate knowledge of base station locations for a cellular phone networks, satellite orbits for GPS, reference transceiver locations for dedicated radio beacons, transmitter tower locations for DTV and AM/FM, and access point (AP) locations for Wi-Fi. In this article, we investigate three types of signals of opportunity, namely, DTV, Global System for Mobile Communications (GSM), and CDMA2000 (1xRTT) for navigation and positioning. A hardware test-bed was built from commercial off-the-shelf (COTS) components to validate the ranging and positioning algorithms. The test-bed consists of a multichannel software-defined radio (SDR) and associated software receivers. The performance of tracking these signals of opportunity and their fusion for positioning was demonstrated for mobile scenarios.
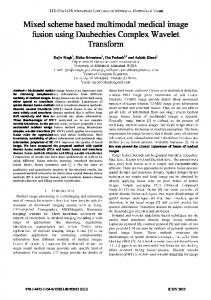
BUILDING MOBILE TEST-BEDS Mobile test-beds are built using COTS components [11], [28], [29], each consisting of a multichannel software-defined radio and associated software receivers. Figure 1 shows photos of our second prototype unit completed in 2012 [29]. The first prototype unit built in 2011 can be found in [11], [28]. The units are built based on the same principle that all controls of the radio-frequency (RF) front ends are made in run time from the server via either a universal serial bus (USB) or a gigabit Ethernet. However, there are six major differences between the first and second units: CC
A new design of the broadband configurable RF receiver Bitshark USRP RX (BURX) from Epiq Solutions (Schaumburg, IL) is used, which incorporates new design features including better filtering.
CC
A new version of Universal Software Radio Peripheral (USRP), namely, N210 from Ettus Research (Mountain View, CA) is used. N210 has more stable designs with
IEEE A&E SYSTEMS MAGAZINE
APRIL 2014
better analog to digital converters (ADC) than USRP2 used in the first unit. CC
Instead of being burnt onto a SD card as with USRP2, the offline field-programmable gate array (FPGA) design for N210 is now on a flash chip and is loaded onto FPGA upon power up.
CC
A more sturdy aluminum frame is used with a larger light emitting diode (LED) display and a lithium battery.
CC
In addition to seven radio channels, the second unit also contains an MMQ-50 inertial measurement unit (IMU) to provide gyro and accelerometer measurements to be used for future study.
CC
Finally, the server is running under the Arch Linux (vs. Ubuntu Linux in the first unit), with fast memory management and data packing and unpacking schemes.
In a typical scenario for our experiments, the seven channels of the test-beds are assigned to GPS L1, the downlink frequency in either the cellular or personal communications
system (PCS) band for CDMA, the downlink frequency in the cellular band for GSM, and four hearable DTV stations. The seven channels can be operated individually or simultaneously in any combination. For simultaneous multichannel operation, it is coherent and synchronized. Software tools in MATLAB® have been developed, which can either process logged real data or simulate a desired signal with chosen characteristics for processing, analysis, and evaluation. These software tools provide the basic modules for real-time processing in software receivers. Software tool boxes for GPS, ATSC-8VSB, GSM, and CDMA2000 are available. Future additions will include orthogonal-frequency division multiplexing (OFDM) modulations and AM/FM signals among others.
ANALYSIS OF SIGNALS OF OPPORTUNITY The three types of signals of opportunity, namely, DTV, GSM, and CDMA2000, are analyzed in this section. In a sense, partial GPS signals may be treated as signals of opportunity. Software tools as shown in Figure 2 are used to acquire and track these signals and to fuse ranging measurements into position solutions.
PARTIAL GPS SIGNALS AS SOOP An interesting example of partial GPS is shown in Figure 3. This example of poor geometric dilution of precision (GDOP) for GPS underlines the need for navigation enhancement that can be provided by using signals of opportunity.
DIGITAL TV SIGNALS AS SOOP Digital television is a “frequencydivision” system of wide bandwidth (6 MHz for each channel). The DTV signal structure is speci-
Figure 1.
Mobile test-beds for signals of opportunity (SOOP).
APRIL 2014
IEEE A&E SYSTEMS MAGAZINE
35
Mobile Positioning via Fusion of Mixed Signals of Opportunity (a total of 728 symbols known in advance), and (iii) RF watermarking codes. The baseband signal has a symbol rate of 10.76 mega symbols/s (Msps), which is slightly higher than GPS P(Y)code chipping rate of 10.23 mega chips/s (Mcps). The DTV signal bandwidth of 5.38 MHz is narrower than that of P(Y) code of 10.23 MHz but the signal is much stronger. Assume a timing accuracy of 10% of a chip or symbol duration (i.e., code phase). The expected code ranging accuracy for DTV signals is about 3 to 4 m statically. Figure 5 shows the spectrum of a typical DTV signal with a strong pilot tone on the lower edge. The pilot signal is used to estimate the underlying frequenFigure 2. cy offset and to shift the specMATLAB software tools. trum to the baseband. Figure 6 depicts DTV sync code processing. The bottom left plot details the peak (the top left plot), which shows the correlation function of a field sync code searched over a segment. At a sampling rate of 20 Msps, the time resolution is about 15 m. Interpolation can find the peak location to a fraction of 15 m. The two right plots of Figure 6 show the correlation peaks per segment when the replica is the sync code for the first and second Figure 3. fields, respectively. Note that bePoor GDOP for GPS. The left sky plot, as encountered in an urban canyon case, shows that the tween two detected fields are 313 available GPS satellites form a poor geometry for positioning (i.e., linear versus wide distributsegments per field. ed). Since the range updates are along the northwest and southeast direction, the position errors After successfully acquiring a are elongated along the northeast and southwest (the right plot). field sync segment, the estimates of code phase and carrier phase errors can be obtained, fied by the American Television Standard Committee (ATSC) which enables the closure of a pilot phase lock loop (PLL) [1]. The signal uses 8-ary vestigial sideband modulation and a field sync code delay lock loop (DLL) for continuous (8VSB). Figure 4 illustrates the 8VSB ATSC DTV structure of tracking. Although the DTV PN sequence is not continuous, frames, where each frame has two fields, each field has 313 we develop DLL and PLL structures to track both the code segments, and each segment has 832 symbols. The first segand carrier [26], [29]. ment is a field synchronization segment, which starts with A second-order DLL is implemented with a noise bandwidth four symbols, {-1, 1, 1, -1} used for segment synchronization. of 2 Hz and a damping ratio of 0.707. The loop is updated There are four pseudorandom number (PN) sequences (i.e., once per field of 24.2 ms. The tracking results are shown as one PN511 sequence and three PN63 sequences) embedded in the left two plots in Figure 7 where the top plot shows the each field sync segment. The longest PN sequence, PN511, is code delay errors in symbols from the delay error discrimiused to estimate the channel impulse responses. nator (less than 0.1 symbols in standard deviation) and the Some known characteristics of DTV signals can be used for bottom left plot shows the symbol rate errors in symbols per estimating the time of arrival (TOA). This includes (i) segment sec from the code numerically controlled oscillator (NCO). sync codes (four symbols per segment), (ii) field sync segments 36
IEEE A&E SYSTEMS MAGAZINE
APRIL 2014
Yang, Nguyen, and Blasch
Figure 4.
8VSB ATSC DTV as SOOP.
Figure 5.
Spectrum of a DTV signal with pilot tone.
The pilot PLL also uses a second-order loop filter with noise bandwidth of 5 Hz and damping ratio of 0.707. The loop is updated once every segment of 78 µs. The tracking results are shown as the right two plots in Figure 7 where the top right plot shows the phase errors in degrees from the phase error discriminator (less than 5°, peak to peak) and the bottom right plot shows the frequency errors in hertz from the carrier NCO. The pilot carrier frequency error of 2506 Hz can be related to the symbol rate error of 49 symbols per sec (a ratio of 51.14) via the ratio between the pilot frequency (the center frequency of the channel is 551 MHz) and symbol rate (10.76 Msps) of 51.21. The complex correlation (corresponding to the prompt channel) is shown on the left plot of Figure 8 where the real part dominates and the imaginary part exhibits a small bias. This bias is likely due to the fact that the replica code used for field synchronization is not balanced. The TOA estimate as shown in the right plot of Figure 8 has a standard deviation of 0.26 samples or 0.14 symbols, which is less than 4 m. Results between 1 to 15 m (1σ) have been observed from static to mobile experiment conditions.
GSM SIGNALS AS SOOP As the first cellular standard created and commercially implemented, GSM applies both frequency division multiple access (FDMA) and time division multiple access (TDMA) technologies. The frequency band available for GSM is divided into frequency channels (carriers) with a bandwidth of 200 kHz each. In the time domain, the radio channel resource is divided into frames and slots (also called bursts). A frequency correction burst (FCH) is used to adjust the frequency errors for mobile users
Figure 6.
Acquisition of field sync segments.
APRIL 2014
IEEE A&E SYSTEMS MAGAZINE
37
Mobile Positioning via Fusion of Mixed Signals of Opportunity frame (TS0 ~ TS7). One burst lasts 15/26 ms; thus one TDMA frame is 120/26 ms. There are either 10 or 11 frames between two consecutive FCH. As a result, four 10 frames and one 11 frames constitute a 51 multiframe (235.4 ms each multiframe). Twentysix multiframes make up a superframe (6.12 s long) and 2048 superframes constitute a hyperframe of the longest recurrent time period in GSM. For the purpose of ranging, two time slots, namely, the FCB and SCB are of particular interest. The FCB is a simple tone of 67.708 kHz above the nominal carrier frequency. The top left plot of Figure 9 shows the change of phase over a number of bursts. A sudden drop in the phase change indicates the detected FCB. Its detection allows for estimation of frequency offset for correction and facilitates the acquisition of SCB that follows. SCB contains a 64-bit long training sequence at a rate of 270.833 ksps, which is differentially encoded and drives a Gaussian minimum shift keying (GMSK) modulation as shown in the bottom left plot of Figure 9. Just like FCB, the detection of SCB can be done through correlating the incoming signal with a locally generated training sequence replica, which provides an estimate of TOA of the SCB at the receiver.
Figure 7.
Field sync code DLL (left) and pilot PLL (right).
Figure 8.
Complex correlation and TOA estimates.
while a synchronization burst (SCH) provides time information. We use the 64-bit training sequence in SCH to acquire GSM signals and obtain timing information. GSM signals are transmitted in burst, and one burst refers to one time slot. Each time slot contains 156.25 bits at 270.833 kbits/s. Eight time slots construct a frame. FCH burst (FCB) and SCH burst (SCB), transmitted in broadcast control channel (BCCH) by the base station (BS), are used in acquisition phase of frequency and timing synchronization, respectively, in a receiver or mobile station in communication systems. Timing synchronization works well when frequency mismatch is very small. In GSM, the frequency mismatch between the transmitter and receiver needs to be less than about 500 Hz for performing reliable timing acquisition on a SCH burst. The GSM signal is organized using a 51-frame multiframe where the FCH and SCH repeat every 10 frames. Eight bursts are grouped into one TDMA 38
IS95/CDMA2000 SIGNALS AS SOOP As an operating mode of the CDMA2000 wireless air interface standard, the single carrier radio transmission technology (1x RTT) is back compatible with IS-95. The common frequency bands in the United States are 824-894 MHz (the cellular band) and 1850-1990 MHz (the PCS band) at a chipping rate of 1.2288 MHz. While GSM segregates the spectrum by time, CDMA uses a unique spreading code technique to differentiate the channels. The signal is transmitted below noise level and is received through a correlator for despreading of the desired signal. Its pilot channel has a short PN sequence of 32,768 chips, which can be used to acquire and track CDMA signals. The sync channel carries the base station and network information as well as coarse system time.
IEEE A&E SYSTEMS MAGAZINE
APRIL 2014
Yang, Nguyen, and Blasch
Figure 9.
GSM FCH and SCH processing.
The basic downlink (forward) signal structure as shown in Figure 10 refers to signals sent from a base station to a mobile user, which can be used for positioning purposes. A CDMA network is a synchronous network in which all base stations operate according to a common time base with their clocks synchronized through GPS to within a prespecified accuracy. The same spreading PN code is used by all base stations but each is delayed by a specific amount (a multiple of 64 chips) in such a way that no two codes have the same phase at a mobile user. Actually it is the time offset of the PN code that identifies one base station from another. There are 64 channels per downlink. After source coding and channel coding, data bits arrive at a rate of 19.2 kbps. The channelization is done by multiplying each data stream with one of the 64 mutually orthogonal Walsh functions. Each Walsh function has 64 chips and a whole Walsh sequence is modulated onto a data bit. The chipping rate of the Walsh function is 64 × 19.2 kbps = 1.228 Mcps. The Walsh sequence number zero is assigned to the pilot channel, free of data modulation. Upon power on, each mobile unit operates on the pilot channel and detects the spreading codes by searching through possible code phases. The sync channel is assigned with the Walsh sequence number 32. The sync channel carries time and frame synchronization information as well as its pilot PN offset. There are seven paging channels, and each assigned a Walsh sequence number from one through seven. A paging channel delivers APRIL 2014
control information such as traffic channel number to a mobile unit prior to assigning the traffic channel. There are 55 traffic channels, each assigned with a Walsh sequence number (eight to 31, and 33 to 63) and carrying coded voice signals. Without any prior information, a search algorithm is used for three purposes. First, it detects the presence of any IS95/ CDMA2000 pilot signals. Second, it estimates the time offset of each pilot PN sequence, which serves as the cell or sector identifier (ID). Third, it estimates the time difference of arrival (TDOA) between neighboring base stations. Figure 11 shows the correlation between a block of incoming signal samples and a replica of the full short PN code (32768 chips over 26.67 ms). Clearly, there are at least five base stations (or antenna sectors) hearable. The strongest is most likely the closest. With respect to the first peak, the TDOA estimates can be obtained for the other four peaks (off by an integer number of 64 chips), which are shown in Figure 11. After detection, the initial estimates of code phase and carrier frequency can be used to close the code DLL and carrier PLL as shown in Figure 12 for the strongest peak. A second order PLL is implemented with a noise bandwidth of 10 Hz and a damping ratio of 0.707. The top right plot of Figure 12 shows the phase error. A second-order DLL with a noise bandwidth of 5 Hz and a damping ratio of 0.707 is implemented. The top left plot of Figure 12 shows the code delay error in chips. The outputs of the early, prompt, and late correlators, spaced by a 1/2 chips, are shown on the bottom right plot of Figure 12. As shown in the bottom left plot of Figure 12, the carrier frequency error from PLL can be related to the chipping rate error from DLL via the ratio between the carrier frequency (the center frequency of the channel is 881.52 MHz) and symbol rate (1.2288 Mcps). The quality of carrier phase tracking is evidently superior over the code phase tracking.
RANGING AND POSITIONING ALGORITHMS A difficulty in noncooperative ranging (and positioning) with signals of opportunity is the uncertainty about the signal transmitter clock (e.g., an offset relative to the receiver clock) and the unknown time of transmission. The use of monitor stations to estimate the transmitter clock errors is
IEEE A&E SYSTEMS MAGAZINE
39
Mobile Positioning via Fusion of Mixed Signals of Opportunity described in [17], [30], while the use of a synchronized reference receiver to form differential measurements is presented in [3]. As an infrastructure, the monitors and reference receivers of the above two methods must be placed at well-known locations. Besides, a data link is needed between either the monitors or reference receivers and the mobile users. In this section, we describe an alternative self-calibration method that estimates the clock offset [25].
Figure 10 (above).
IS95/CDMA2000 downlink signal structure.
Figure 11 (left).
CDMA pilot channel acquisition correlation output.
Figure 12 (below).
Code DLL and carrier PLL for a CDMA2000 signal.
RANGING WITH CALIBRATION For the signals of opportunity considered in this study, their respective pseudorandom (PN) code is used for ranging: the field sync segment in DTV, training sequence in GSM, and short PN sequence in CDMA. The event of interest for ranging is the leading edge of the PN code. The time at which this leading edge leaves the transmitter antenna is referred to as the time of transmit (TOT). As shown in Figure 13, the successive times of transmit of DTV fields are related by: , (1) where n = 0, 1, 2, … is the number of fields and Tfield is the nominal period of a field, which is about 24.2 ms or 41.32 Hz, and T0 is an unknown constant. Similar equations can be established for GSM and CDMA signals. The time of arrival (TOA) of the leading edge of the PN code is estimated by determining the location of correlation peaks. In other words, we estimate the TOA by counting the samples between successive correlation peaks (denoted by Pn) and the first peak relative to the first sample (denoted by P0 ). The first sample is set to be zero for the receiver clock, which
40
IEEE A&E SYSTEMS MAGAZINE
APRIL 2014
Yang, Nguyen, and Blasch
Figure 13.
Aperiodic pseudoranges.
differs from the transmitter time by an offset, denoted by t0. As a result, the time of arrival can then be expressed in terms of the correlation peak locations as:
With N + 1 measurements of APRn = APR and Pn, we have the following matrix equation:
. (2) . (5) It is possible to obtain pseudoranges in two ways, namely, taking aperiodic and periodic pseudoranges [22]. If we calculate the pseudorange for and at each time of arrival TOAn, the measurements will not be on a uniform scale due to the random nature of time of arrival. Hence it is called aperiodic pseudoranges, denoted by APRn, as:
The least squares solution gives: (6a)
. (3)
(6b)
In addition to the initial unknown clock offset t0, the clocks may also drift in their frequency, leading to Ns off the nominal values Tfield. For stationary transmitter and receiver, there is no Doppler frequency shift. The changes in symbol rate and sampling rate over time are due to the clock frequency instability. The DTV transmitter locations are known from the Federal Communications Committee (FCC) database. To perform calibration, we start with the receiver at a known location. The range between a DTV station and our receiver can then be calculated, that is, APRn is known, from which we are to estimate t0 and (Tfield − Ns). For the aperiodic pseudorange (Equation 3), we know APRn and Pn but do not know t0 and Tfield (except its nominal value). Equation 3 can be further written as:
. (6c)
. (4)
APRIL 2014
The formulation for periodic pseudorange and its calibration can be found in [22]. Note the fact that starting navigation from a known location is a common practice. The assumption of using the initial known location as a reference for calibration is therefore not restrictive. In fact, a known intersection or a landmark along the trajectory can be taken advantage of for en-route recalibration if needed. Of course, the subsequent positioning accuracy cannot exceed that of the reference point used for calibration and of the initial condition.
POSITIONING WITH MIXED SOOP After calibration with Equation 6, the pseudorange in Equation 3 can be rewritten to relate the unknown mobile user’s location (x, y) to the kth transmitter at the known location of (xk, yk) in the 2-D setting as:
IEEE A&E SYSTEMS MAGAZINE
41
Mobile Positioning via Fusion of Mixed Signals of Opportunity
, (7) where wk is the measurement noise, modeled as zero-mean Gaussian with variance . Note however the measurement noise characteristics may change over time as the user starts moving. Large outliers may appear due to non line-of-sight (NLOS) signals. Given an initial estimate of the user location as ( , ), the error between the measured and predicted ranges can be written as: . (8) Linearizing Equation 7 around ( , ) and bringing it to Equation 8 gives: . (9) For k > 2, the least squares solution in the vector format, denoted by xˆ, and the estimation error covariance denoted by P, can be written as: (10a)
(10b)
, (10c) where , , surement error covariance:
, and R is the mea-
(10d)
rical dilution of precision (GDOP) on the other hand. The GDOP is defined as: . (11) For the 2-D case, the circular probably error (CEP, 50%) is given by [10]: , (12) where s is the standard deviation of ranging errors. GDOP has been used as a performance metric for sensor selection and placement to optimize position fusion [7], [18]. The use of the GDOP measure of metric (MOM) is also useful for resource management and target tracking [23]. The ranging error s is determined by the signal to noise ratio (SNR), signal bandwidth, code structure, and multipath among others. This ranging error s can be reduced by good antenna and RF front-end designs with low noise figure (NF) and advanced baseband signal processing algorithms. The GDOP is determined by the number of independent SOOPs. With a single type of SOOP, their geometric distribution often does not offer a good GDOP in practice. As an advantage shown in the next section on the evaluation of the test scenario, the fusion of mixed signals of opportunity improves the GDOP for better solution. Furthermore, for a mobile user, although he or she has no control of the geometric distribution of SOOP, the user may take a proactive approach to moving around to change the relative geometry, whenever the circumstances allow, obtaining a position solution, which is otherwise unavailable [24]. In addition, advanced data processing algorithms can be used for data fusion with other sensors and digital databases to improve the overall results, which we pursue as part of our ongoing efforts.
. (10e)
EVALUATION IN A TEST SCENARIO Note that the above formulation is generic for all pseudoranges, be it formed by DTV or CDMA signals. For our test-bed as described earlier, sampling of all DTV and CDMA channels is synchronized. However, the pseudoranges can be formed at different rates because of their inherent difference in code periods. As a result, the pseudorange measurements can either be interpolated to the same time to afford an instantaneous mixed solution or updated sequentially. More formulation and analysis can be found in [16], [22].
GDOP IMPROVEMENT WITH FUSION The positioning accuracy given in Equation 10c is determined by ranging errors R on the one hand and by geomet42
Acquisition and tracking of PN codes rely on the despreading power of correlation, which depends on the code structure and chip rate, as well as the code length. It significantly impacts the estimated range accuracy. Table 1 compares these signals under study according to their specifications. Based on the design features of the three signals listed in Table 1, DTV has the highest accuracy due to its highest chipping rate and GSM is the worst among the three (not further studied). The expected accuracy of 10% chip width is 3, 111, and 24 m for DTV, GSM, and CDMA2000 1x RTT, respectively. Urban and indoor areas are the most challenging environment for any radio signal due to multipath and blockage by buildings, but these areas enjoy extensive coverage
IEEE A&E SYSTEMS MAGAZINE
APRIL 2014
Yang, Nguyen, and Blasch by cellular and DTV signals. Suburban and residential areas are relatively mild environments for GPS and terrestrial communication and broadcast signals. However, rural areas provide an unblocked open sky (i.e., best GPS access) but are challenging for terrestrial communication and broadcast signals due to the limited infrastructure deployment for commercial needs. Although the terrestrial communication and broadcast systems are well-populated in metropolitan areas, even indoor environments, they have weaker coverage in rural areas. As a result, intelligence data fusion of GPS, cellular, and DTV is expected to provide significant enhancement to coverage, continuity, dynamic positioning through rural and urban landscapes, and navigation in GPS-denied areas as compared to individual source coverage. For broadcast signals, a disadvantage is that the antennas of different stations may be installed on the same transmitter tower, which results in a poor geometry even with sufficient number of SOOP signal sources. As an example, Table 2 lists hearable TV stations in the UHF band in San Francisco. As Table 2 shows, most of the signals originate from the antennas mounted on transmission towers at two different locations— Sutro Tower in San Francisco and Mount San Bruno in South San Francisco (Figure 14). Due to the limited height of the transmitters, the vertical dilution of position (VDOP) Table 1. Signal Specs of a position estimate is usually large. Therefore, a 2-D solution is sought that uses different signal sources, such as DTV, CDMA, Chip rate (bps) and GSM, to complement each Continuous trans. other to achieve a better geomBandwidth (Hz) etry, and hence accuracy. We conducted a mobile test in Foster City, CA, to evaluate the hybrid positioning algorithm using both DTV and CDMA. The geographical distribution of the SOOP signal sources are illustrated in Figure 15. The red pushpins represent the DTV transmitters (DTV1 and DTV2). There are three DTV antennas located on the same tower at DTV1 in the northwest while one station at DTV2 in the southeast. The yellow pushpin indicates the CDMA transmit tower (in the northwest to the user as well). The cyan square (after the yellow push pin) is estimated GPS standalone solutions. The distances of the two DTV transmitters to the user location are 27 and 35.5 km, respectively, while APRIL 2014
the CDMA transmitter location is 800 m away from the user location. We considered a 2-D solution for the test scenario of Figure 15 where the mobile test-bed moves in the direction from southeast toward northwest. Figure 16 shows the pseudoranges to five DTV stations: 563, 617, 623, and 647 MHz are all located at Sutro Tower in the northwest (decreasing pseudoranges) while 605 MHz is at Monument Peak in the southeast (increasing pseudorange). It also shows the pseudorange to a CDMA tower in the PCS band in the northwest with decreasing pseudorange. The calculated horizontal dilution of position (HDOP) using DTV transmitter locations is approximately 2.0 whereas the HDOP is reduced to 1.6 with the integration of one CDMA transmitter. Note that in the 2-D case, the best HDOP is 1.414. The improvement of HDOP is shown in Figure 17 when the CDMA signal is considered together with DTV signals. The estimated 2-D position fix is plotted in Figure 18 at the TOA measurement rate (24.2 ms) where the blue circles are the DTV-only solutions; the cyan circles are the corrected DTV solutions; and the red crosses represent the position estimates with an integration of DTV and CDMA. This data set was collected over a 90-s time interval. The first 40 s are stationary where the GPS solutions are used as
Comparison DTV
GSM
CDMA
10.76 M
270.833 k
1.2288 M
No
No
Yes
6M
200 k
1.25 M
Code length (chips)
832
64
32768
Code period (ms)
24.2
4.615
26.7
3
111
24
Expected errors (m)* *10% of chip width
Table 2. Characteristics of Hearable DTV Signals
IEEE A&E SYSTEMS MAGAZINE
43
Mobile Positioning via Fusion of Mixed Signals of Opportunity a reference to calibrate the clock offsets between the signal sources and our receiver. The remaining 50 s are mobile in which the vehicle moves from the lower right to upper left (toward the northwest direction). Figure 19 shows the estimates when they were averaged over 1 s. The green triangles represent the GPS solutions; the blue circles are the DTV-only solutions; the cyan circles are the corrected DTV solutions; and the red crosses represent the position estimates with an integration of DTV and CDMA. Both DTV only and DTV + CDMA solutions follow well the GPS solution. Clearly, the fused DTV + CDMA solution shows an improved tracking performance. Additional results can be found in [22], [27]. Table 3 lists the mean, standard deviation, and maximum errors between the GPS solution and the DTV and the mixed DTV + CDMA solutions, respectively. The maximum error of the mixed DTV + CDMA solution is worse than the DTV
Figure 14.
Photo of Sutro Tower taken from Grandview by Justin Beck and released into the public domain. Originally posted on Flickr as “Sutro Tower.” Source:via Wikimedia Commonshttp://upload.wikimedia.org/ wikipedia/commons/b/b7/Sutro_Tower_from_Grandview.jpg.
Figure 15.
Transmitter geographical distribution.
44
Figure 16.
Ranges to five DTV stations and CDMA cell tower.
Figure 17.
HDOP Improvement with DTV + CDMA versus DTV.
IEEE A&E SYSTEMS MAGAZINE
APRIL 2014
Yang, Nguyen, and Blasch solution due to the initial transients. Nevertheless, with a single CDMA cell tower, the mixed DTV + CDMA solution improves both the error mean value (bias) and the standard deviation by 13% and 20%, respectively, as compared to the DTV solution. Additional gains are expected when more CDMA cell towers with spatial diversity are available. This example clearly demonstrates the benefits for mobile positioning via fusion of mixed signals of opportunity.
CONCLUSIONS
Figure 18.
Hybrid position estimates using DTV versus fused DTV and CDMA (raw samples).
In this article, we investigated several SOOPs for mobile positioning without GPS and compared their signal characteristics for navigation and tracking. Critical issues in positioning with SOOP were discussed, which include the lack of independent SOOP (poor GDOP), SOOP clock errors, 2-D vs. 3-D solutions, multipath and NLOS signals, and signal integrity, among others. We described the development of mobile test-beds with hardware and software features and presented field test results. The signals of opportunity that we have successfully acquired and tracked with our test-beds and then used to derive navigation solutions include GPS, DTV, GSM, and IS95/ CDMA2000 (1X RTT) signals. Based on the comparative assessments and test results, this article advocates the use of mixed (hybrid/fused) signals of opportunity, which has the potential to alleviate several technical difficulties faced by positioning with SOOP. Our ongoing effort is to expand our software radios to include other communication and broadcast signals and modulation schemes and to perform cooperative position localization.
ACKNOWLEDGEMENTS
Figure 19.
Hybrid position estimates using DTV versus DTV and CDMA (averaged over 1 s).
Research supported in part under Contract No. FA865010-C-1375, which is gratefully acknowledged. Thanks also go to Drs. Di Qiu, Morgan Quigley, Jared Casper, and Ben Wilson for their contribution to the test-bed building, field testing, data collection, and data processing and analysis.
REFERENCES Table 3. DTV and DTV + CDMA Solutions versus GPS Solution Method/ Error
Mean, m
Std, m
Max, m
(a) DTV Solution
1.93
4.73
10
(b) DTV + CDMA
1.68
3.78
12
Improvement (b vs. a)
13%
20%
−20%
APRIL 2014
[1] ATSC Digital Television Standard (A/53), Revision E, with Amendment No. 1. Dec. 2005, with Amendment No. 1 dated Apr. 2006. [2] Caffery, J. J., Jr., and Stuber, G. L. Overview of radiolocation in CDMA cellular systems. IEEE Communications Magazine, vol. 36, no. 4, pp. 38–45, April 1998. [3] Carter, K., Ramlall, R., Tummala, M., and McEachen, J. Bandwidth efficient ATSC TDOA positioning in GPS-denied environments. Proceedings of the 2013 International Technology Meeting of the Institute of Navigation, San Diego, California, January 28-30, 2013. [4] Do, J. Y. Road to seamless positioning: Hybrid positioning system combining GPS and television. Ph.D. Dissertation, Stanford University, May 2008.
IEEE A&E SYSTEMS MAGAZINE
45
Mobile Positioning via Fusion of Mixed Signals of Opportunity [5] Duckworth, G. Geolocation and navigation via signals of opportunity. DARPA Request for Information, February 2004. [6] Hall, T. D. Radiolocation using AM broadcast signals. Ph.D. dissertation, Massachusetts Institute of Technology, Cambridge, MA, September 2002. [7] Kadar, I. A geometric measure-of-merit for sensor fusion. Proceedings of Fusion’98-- First International Conference on Multisource-Multisensor Information Fusion, Las Vegas, Nevada, July 6-9, 1998. [8] McEllroy, J. A. Navigation using signals of opportunity in the AM transmission band. Master’s thesis, AFIT/GAE/ENG/0604, 2006. [9] NAECON 09 grand challenge problem: Signals of opportunity (SO). In Proceedings of the IEEE 2009 National Aerospace & Electronics Conference (NAECON), Dayton, OH, July 21-23, 2009. [10] Nguyen, T. Cooperative handheld location device using signals of opportunity. DOD SBIR Solicitation Topic, September 2008. [11] Nguyen, T., Yang, C., Quigley, M., and Casper J. A testbed for positioning with mixed signals of opportunity: Initial results. In Proc. of JSDE-ION JNC, Colorado Springs, CO, June 2011. [12] Pesyna, K. M., Jr., Kassas, Z. M., and Humphreys, T. E. Constructing a continuous phase time history from TDMA signals for opportunistic navigation. In Proc. ION/IEEE PLANS, April 2012. [13] Qiu, D., de Lorenzo, D., Lo, S., Boneh, D., and Enge, P. Physical pseudo random function in radio frequency sources for security. In Proc. of ION-ITM’2009, January 2009. [14] Qiu, D., Lynch, R., Blasch, E., and Yang, C. Underwater navigation using location-dependent signatures. In IEEE-AIAA Aerospace Conf, 2012. [15] Qiu, D., Nguyen, T., and Yang, C. Study of two sferic position location mechanisms. In Proc. of ION-GNSS, Portland, OR, September 2010. [16] Qiu, D., Nguyen, T., and Yang, C. Assessing the accuracy of hyperbolic multilateration systems. In ION-ITM, January 2011. [17] Rabinowitz, M., and Spilker, Jr., J. J. A new positioning system using television synchronization signals, IEEE Trans. Broadcasting, Vol. 51, 1 (2005), 51–61. [18] Reza, R. I. Data fusion for improved TOA/TDOA position determination in wireless systems. M.S. thesis, Virginia Polytechnic Institute and State University, 2000.
46
[19] Thevenon, P., Damien, S., Julien, O., Macabiau, C., Bousquet, M., Ries, L., and Corazza, S. Positioning using mobile TV based on the DVB-SH standard. NAVIGATION:The Journal of the Institute of Navigation, Vol. 58, 2 (2011). [20] Wesson, K. D., Pesyna, K. M., Jr., Bhatti, J. A., and Humphreys, T. E. Opportunistic frequency stability transfer for extending the coherence time of GNSS receiver clocks. In Proc. of IONGNSS’ 2010, Portland, OR, September 2010. [21] Woo, S. S., You, H. R., and Kim, T. G. The position location system using IS-95 CDMA networks. In EUROCOMM 2000: Information Systems for Enhanced Public Safety and Security, IEEE/ AFCEA, 2000. [22] Yang, C. Cooperative position location using mixed signals of opportunity. Tech Rep for Contract No. FA8650-10-C-1735, Dec. 2012. [23] Yang, C., Kaplan, L., and Blasch, E. Performance measures of covariance and information matrices in resource management for target state estimation. IEEE Transactions on Aerospace and Electronic Systems, Vol. 48, 3 (2012), 2594–2613. [24] Yang, C., Nguyen, T., Venable, D., White, M., and Siegel, R. Cooperative position location with signals of opportunity. In Proc. of IEEE NAECON, July 2009. [25] Yang C., and Nguyen, T. Self-calibrating position location using signals of opportunities. In ION-GNSS’2009, Savannah, GA, September 2009. [26] Yang, C., and Nguyen, T. Optimization of tracking loops for signals of opportunity in mobile fading environments. In IONGNSS’2013, Nashville, TN, September 2013. [27] Yang, C., Nguyen, T., Blasch, E., and Qiu, D. Assessing terrestrial wireless communications signals as signals of opportunity for positioning and navigation. In ION-GNSS’2012, Nashville, TN, September 2012. [28] Yang, C., Nguyen, T., Qiu, D., Casper, J., and Quigley, M. Positioning with mixed signals of opportunity. In ION-GNSS’2011, Portland, OR, September 2009. [29] Yang, C., Nguyen, T., Qiu, D., Quigley, M., Casper, J., and Wilson, B. Mobile positioning with DTV signals (ATSC 8VSB and M/H standards). In ION-GNSS’2012, Nashville, TN, September 2012. [30] Young, T. TVGPS, a hybrid location and timing solution for GPS-challenged and GPS-denied environments. In Proc. of IONJSFE JNC 2009, Orlando, FL, June 2009.
IEEE A&E SYSTEMS MAGAZINE
APRIL 2014