The Smith-Kettlewell Eye Research Institute, San Francisco, California 94115. Spontaneous .... et al., 1992), recent experiments in developing turtle retinas with.
The Journal
Model for the Pharmacological Activity in Developing Retinas Pierre-Yves
Burgi
and
Norberto
of Neuroscience,
Basis of Spontaneous
December
1994,
14(12):
7426-7439
Synchronous
M. Grzywacz
The Smith-Kettlewell Eye Research Institute, San Francisco, California 94115
Spontaneous waves of bursts of action potentials propagate across the ganglion-cell surface of developing retinas. A recent biophysical model postulated that this propagation is mediated by an increase in extracellular K+, following its ejection from ganglion cells during action potentials. Moreover, the model hypothesized that bursts might terminate due to the accumulation of intracellular Ca2+ and the subsequent activation of a Ca2+-dependent K+ conductance in the cells’ dendrites. Finally, the model proposed that an excitatory synaptic drive causes a neuromodulation of the waves’ properties. To test the feasibility of the model, we performed computer simulations of the network of developing ganglion cells under control and pharmacological-manipulation conditions. In particular, we simulated the effects of neostigmine, Cs+ and TEA, low Ca2+ concentrations, and Co2+. A comparison of the simulations with electrophysiological and pharmacological experimental data recently obtained in turtles (Sernagor and Grrywacz, 1993a), and cats and ferrets (Meister et al., 1991; Wong et al., 1993), showed that the model for the most part is consistent with the behavior of developing retinas. Moreover, modifications of the model to allow for GABAergic inputs onto ganglion cells (Sernagor and Grzywacz, 1994) and poor [K+],,, buffering (Connors et al., 1982) improved the model’s fits. These results lent further support to important roles of extracellular K+ concentration and synaptic drive for the propagation of waves. [Key words: retina/development, biophysicalmodel, spontaneous activity, ganglion cells, Miiller cells, extracellular potassium, synaptic neuromodulation]
Spontaneousbursts of synchronous activity occur in the ganglion-cell layer of developing retinas of rats (Galli and Maffei, 1988) cats and ferrets (Meister et al., 1991; Wong et al., 1993), and turtles (Sernagorand Grzywacz, 1993a).By usingmultielectrode recording, Meister et al. (1991) and Wong et al. (1993) showedthat this activity is organized spatially and temporally
Received Dec. 10, 1993; revised Apr. 7, 1994; accepted May 26, 1994. We thank Dr. Evelyne Sernagor for continuous discussions during the course of this project, and Drs. Evelyne Sernagor, Raimond L. Winslow, and Rachel 0. L. Wong for their fruitful comments on the manuscript. This work was supported by a grant from the Swiss National Fund for Scientific Research (8220-37180) to P.-Y.B., by grants from the National Eye Institute (EY-0892 1) and Office of Naval Research (NO00 14-9 1-J- 1280) and an award from the Paul L. and Phyllis C. Wattis Foundation to N.M.G., and by a core grant from the National Eye Institute to Smith-Kettlewell (EY-06883). Correspondence should beaddressed to Pierre-Yves Burgi, The Smith-Kettlewell Eye Research Institute, 2232 Webster Street, San Francisco, CA 94115. Copyright 0 1994 Society for Neuroscience 0270-6474/94/147426-14$05.00/O
to form wavesthat sweepacrossthe retinal surface.While waves of neural activity are not specific to the developing retinas, as they are also found, for example, in muscular and glandular tissues(Sherman and Rinzel, 1991; Winslow et al., 1993), the speedof propagation of these waves in the retina seemsto be uniquely slow. Becausebursts last a relatively constant amount of time, the waves’ speedaffect directly the spatial extent of the synchronization throughout the tissue.Hence, synchronization is much more localized in the retina than in the heart or pancreas.Sucha localization might be important, sincesynchronous activity might have a role in the refinement of topographic maps in the lateral geniculate nucleusand higher visual areasduring binocular segregation(von der Malsburg and Willshaw, 1976; Shatz and Stryker, 1988; Montague et al., 1991; Bems et al., 1993; Miller, 1994). What makes synchronization particularly localized in the developing retina? The answerliesin the mechanismsimplementing retinal waves. Following suggestionsby Maffei and Galli-Resta (1990) and Meister et al. (199l), Burgi and Grzywacz (1994) proposed a model for the propagation of waves in developing retinas based on the accumulation of extracellular potassium ([K+],,,). According to this model, efflux of K+ from cells during bursts of action potentials would increase[K+],,, and depolarize neighbor cells.Burgi and Grzywacz arguedin favor of this K+ hypothesis, and againstgap-junction and synaptic hypotheses.Although gap junctions exist in fetal retinal ganglion cellsof mammals(Penn et al., 1992),recent experimentsin developing turtle retinas with octanol (Semagor and Grzywacz, 1993a) and dopamine (Sernagor and Grzywacz, 1994) two gap-junction blockers in the retina, suggestthat gap junctions may not be the main mechanism underlying burst synchronization. Moreover, in mammals, burst synchronization occurs (Masland, 1977; Maffei and Galli-Resta, 1990; Meister et al., 1991)prior to the appearance of the first conventional synapsesonto ganglioncells (McArdle et al., 1977; Maslim and Stone, 1986; Horsburgh and Sefton, 1987). Burgi and Grzywacz also argued that the immaturity of the glial system in young preparations (Medzihradsky et al., 1972; Rager, 1979)and consequently, a reduced K+ active uptake, favors a larger accumulation of K+ in young, but not adult retinas. Burgi and Grzywacz alsoemphasizedthat a refractory mechanism must exist to prevent the waves from propagatingbackward. They argued againstthis mechanismbeing an inhibitory interneuron, the depletion of a neurotransmitter, or synapticreceptor desensitization. Instead, they suggestedthat bursts of activity might stop due to a self-inhibitory mechanismin ganglion cells. In particular, they hypothesized a Ca2+-dependent K+ conductance (gAHP),which would be activated upon accumulation of intracellular Ca*+ during the bursts of action po-
The Journal of Neuroscience,
tentials. However, they stressed that the data available at the time were not strong in favor of this gAHphypothesis. One of the goals of the present article is to use more recent data on developing turtle retina to test this hypothesis. Finally, based on turtle data (Sernagor and Grzywacz, 1993a), Burgi and Grzywacz proposed a role for synapses in the propagation of waves. They suggested that a small synaptic input would have a neuromodulatory role in the control of wave properties. Although computer simulations showed that the waves generated by the model proposed by Burgi and Grzywacz (1994) have spatial and temporal properties consistent with experimental data (Meister et al., 1991; Wong et al., 1993) stronger tests of the model should come from pharmacological manipulations. In developing turtle retinas, Sernagor and Grzywacz (1993a) showed that the temporal characteristics of synchronous bursts are affected by application of tetraethylammonium (TEA) and Cs+, two potassium blockers, and neostigmine, a cholinesterase blocker. Application of TEA and Cs+ abolished bursts, which during the early phases of recovery had longer duration and longer intervals separating individual spikes. In contrast, neostigmine had the opposite effect on burst duration and interspike interval, and also reduced the quiet period between bursts. Sernagor and Grzywacz also showed a dramatic reduction of activity with low Ca*+ and high Mg2+ concentrations, or sufficiently high concentration of Co*+. Among other things, these two ionic manipulations should block conventional synaptic activity. A more recent experiment with low concentrations of Co*+ (2-3 PM) allowed bursts to occur, and they had shorter duration and longer interspike interval (Sernagor and Grzywacz, 1994). Different than turtles, a low-Ca*+ experiment in mammals first performed with normal Mg*+ (Meister et al., 199 1) and later with high MgZ+ concentrations (R. 0. L. Wong, personal communication) resulted in shorter burst duration and shorter length of the quiet period between bursts, and did not suppress burst synchronization. We will address the differences between turtles and mammals in the Discussion. The aim of the work reported in this article was to investigate to what extent the model proposed by Burgi and Grzywacz (1994), which is based on extracellular K+ accumulation, a Ca2+dependent K+ conductance, and an excitatory synaptic drive can account for the pharmacological and physiological findings in reptiles and mammals. Our goal was not to obtain the best fits in a wide parameter space, but rather to use conservative parameters to study whether even under the worst conditions, modulation of [K+],,, could carry the waves or at least affect them. This article also presents untested predictions made by the model on the propagation of waves under different drugs. Portion of this work appeared in abstract form (Burgi and Grzywacz, 1993).
Materials
and Methods
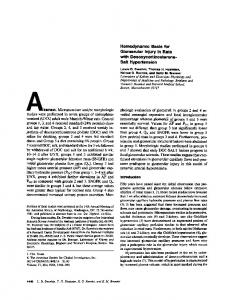
The model consists of ganglioncellsarrangedin a hexagonalarray(Fig. 1A). Each cell comprises two compartments linked by an axial conductance: a soma surrounded by six extracellular spaces and a dendrite (Fig. 1B). Cells have voltage-dependent Na+ and K+ conductances at the soma, and voltage-dependent Ca2+ and Ca2+-dependent K+ conductances (gAHP) at the dendrite. This segregation of conductances prevents the’ rise of [K+],, around the soma from impairing the burststopping (gAHP) mechanism (Burgi and Grzywacz, 1994). Passive-cell channels include leak conductances at the dendrite and soma. The soma leak conductance has K+-dependent and-independent components. Besides the leak, Ca2+, and AHP conductances, the dendrite also receives
December
1994, 74(121 - 27
Poisson wave initiation B Dendrite
Soma
c
i :.... .. . ..leak .. . .. . . . . . : i ii i 9,, 9,+( /i i! il: . i! i! i! I! i! /I !! !. ..... .......... .......... ....... .
Figure 1. A, Model of ga .&on cell layer. In this model, cells are arrangedhexagonally,their respective location is at the center of the gray circles, and theclosestnembrane-to-membrane distancebetween two neighborcellsis 12 pm. The circlesare drawn to illustratethe extracellular spaces between every three cells. The corresponding physical dimensions of the network are 364 pm for the width and 240 pm for the height. Wave initiation occurs randomly at the border cells (located within the dark gray circles), where an external current is injected at times randomly drawn from a Poisson process. The “electrodes” record the activity of five cells whose burst activity is presented in Figure 2. B, Model of a single ganglion cell. Sodium [ZVa(V)] and potassium [K(V)] action potentials at the soma eject K+ into the extracellular space. The extracellular concentration of K+ affects the Nemst potential of K+ for voltage-dependent K+ channels and K+-dependent leak conductances (g,k) in the cell’s neighborhood. Depolarization produces a Caz+ spike [C&V)] that triggers inhibition through the calciumdependent potassium conductance g,,, [K(Ica/, J]. The excitability of the cell is modulated by synaptic inputs (at least partially cholinergic) represented by ZSm.Finally, the model has a dendritic leak conductance (g,), a K+-independent somatic leak conductance (g,-.& and an axial conductance (g-) linking soma and dendrite. an excitatory synaptic current, which was constant for the sake of simplicity. Our model of the individual ganglion cell resembles the neural model of Av-Ron et al. (1993). Equations. The equations, parameters, and boundary conditions used in the model were described in Burgi and Grzywacz (1994). (That article also explains why we used a simplified model for somatic voltagedependent conductances rather than the detailed model for adult amphibian ganglion cells of Fohlmeister et al., 1990.) Here, we only recapitulate those equations directly related to [K+],, and ZAHP,the main variables controlling wave propagation and burst termination (the Appendix describes the other equations briefly). The voltage-dependent K+ current flowing into the jth extracellular space from the ith neuron is determined using reduced Hodgkin-Huxley equations (Av-Ron et al., 199 1) described as follows:
7428
Burgi
and Grzywacz
l
Pharmacology
for Spontaneous
Waves
in Developing
Retinas
where g, is maximal voltage-dependent K+ conductance, E,,, is K+ reversal potential corresponding to the jth extracellular space (the calculations involve the [K+],,, values in each of the six extracellular spaces surrounding a cell; Burgi and Grzywacz, 1994), and s is a channel parameter controlling the gating of K+ channel, as does the variable W, , which is described in the Appendix. Variations of potassium concentration in the jth extracellular space, [K+],,,, , are given by a nonlinear differential equation that takes into account active K+ uptake by Miiller cells (Karwoski and Proenza, 1980):
z 4&o
d[K+],,,,, _ ‘=I>J>J~ ~dt
Fv,
K+lou,, dK+12out., - - 7K -
+ -[K+lre,, + ~dK+lL.st, 7K where F is Faraday constant, v, is extracellular enclosed volume between every three cells,j, ,j,, and j, are indices of the three neurons surrounding each extracellular space (according to hexagonal geometry), rl( is a decay time constant, ok is a constant, and [K+],,, is the resting potassium concentration. We assume [K+],,,, to be homogeneous in each extracellular space between every three ganglion cells; that is, we neglect diffusion within each such spaces, since diffusion would take about 1O25 msec to cover the distance between neighbor cells, a time that is much shorter than the delay (200 msec; Meister et al., 1991) in wave propagation between neighbor cells (see Burgi and Grzywacz, 1994, for more details). The conductance g,,,, essential to stop bursts in the model presented here, was described by the following differential equation (Borg-Graham, 1991):
where g,,, is maximal conductance, (Yand fi are forward and backward rate constants, respectively, and [Ca2+]in,r is intracellular calcium concentration. The variation in [Caz+]i,,Z as a function of Ca2+ current was (4) where the factor of 2 is for Ca*+ valence, v, is dendritic volume, 7c1 is a decay time constant, and [Ca2+lrcStis resting concentration. The Caz+ current that flows into the dendrite (I-,,) was determined by using a two-state gate model (Borg-Graham, 199 l), which is similar to the Hodgkin-Huxley model (see Appendix). Parameters. We used parameter values that were as realistic as possible (see Burgi and Grzywacz, 1994, for a list of all values). Not all parameters were available for developing retinas. For instance, conductances for embryonic ganglion cells are not currently available, except for Na+ and K+ channels, which have been analyzed in dissociated cells (Skaliora et al., 1993a,b). Thus, adult maximal conductances taken from other preparations were used (Yamada et al., 1989; Ekeberg et al., 199 1) with their values divided by 3 to take into account smaller membrane surfaces of young ganglion cells and possibly lower ionic channel density (McCormick and Prince, 1987). The only exception was the dendritic Ca*+ conductance. which had to be adjusted to give [Ca2+],, in the range of g,, operation (0. l-l PM; Blatz-and Magleby,. 1986). The (constant) synaptic current was only -2 pA to be consistent with injected currents that generate trains of action potentials in isolated embryonic ganglion cells (Skaliora et al., 1993a). We used a soma diameter D, of 8 pm (Ramoa et al., 1988). The dendritic volume was approximated by assuming that all dendrites had the same diameter (0.8 pm), their membrane resistivity was the same as the soma’s, and that the ratio between their total conductance and that of the soma is unity (Jack and Redman, 197 1). We did not take dendritic tapering into account, but the resulting volume turned out to be relatively unimportant since scaling it and the calcium conductance by the same factor left the results essentially unchanged (simulations not shown). The extracellular-volume parameter critical for K+ accumulation, and thus for wave’s propagation, was determined by using the extracellular volume fraction, defined as the fraction occupied by the extracellular space in the total volume (Nicholson and Phillips, 198 1). In adult cerebellum and neocortex, the extracellular volume fraction is about 20%
(Van Harreveld, 1972; Nicholson and Phillips, 198 1; Lehmenktlhler et al., 1993). In postnatal developing neocortex, the fraction is higher, ranging between 20% and 40% according to the animal’s age (Lehmenktihler et al., 1993). In our simulations, we used an extracellular volume fraction of 30%, a value in the middle of the cortical postnatal range (see Discussion for consideration on the effect of volume changes during development). The total volume is composed of the neural volume, the glial volume (Mi.iller cells in the retina), the volume occupied by the extracellular matrix, and the extracellular volume. We assumed that the volume occupied by the extracellular matrix and the Mtiller cells was negligible. [This assumption was valid, since gliogenesis appears to be the major factor in reduction of extracellular volume fraction during development (Lehmenktihler et al., 1993) and since Mtiller cells may not be well developed at the stage when synchronized bursts occur.] Hence, the total volume (v,) was assumed to be partitioned between ganglion-cell volume (v,) and extracellular volume (v~), that is, v, = v, + v,. Because the extracellular volume fraction is assumed to be 30%, the ganglion cell occupies 70% of the total volume, that is, V~ = 0.7v,. Consequently, we can calculate the extracellular volume in terms of the ganglion-cell volume as v, = (0.3/0.7)v,. Because a cell was surrounded by six extracellular spaces in our model, the individual volume where one-sixth of the K+ current was ejected was v,/6 or
Another parameter that could affect changes in [K+],,, is the small fraction of cells that do not fire during a wave (Wong et al., 1993). Wong and colleagues (R. 0. L. Wong, personal communication) found that this fraction becomes zero by the addition of 2.5 mM of K+ to the superfusate. Therefore, presumably, cells that fail to fire may not always reach threshold in physiological conditions. In exploratory simulations, we forced up to 10% of the network’s cells to be silent during wave propagation without observing substantial effects on the waves’ properties. Accordingly, it was not necessary to remove cells from the network in the simulations reported in this article. Simulations. Currently, the mechanism responsible for the waves’ initiation is not known. We assumed in our model a higher excitability for cells situated near the retinal border. In normal physiological conditions, this is probable as neurogenesis occurs most abundantly at the border (Polley et al., 1989), creating cells with small somata, and small or no dendrites, and thus cells that have high input resistance. Moreover. in experimental conditions, possible cuttings of dendritic trees may deuolarize cells. Therefore, we modeled border cells by reducing 3 bv half -, ----the dendritic volume and conductances (the rise in input resistance increased the cells’ excitability). Waves were initiated by injecting a small current (-25 PA) for 250 msec into a randomly chosen bordercell pair at times determined by a Poisson process [mean = 10 set in the drug-free (control) condition]. Such an initiation corresponds to having a critical mass of active cells that can elevate [K+],“, sufficiently high near the border to induce the propagation of waves. The evolution of a network composed of 24 1 ganglion cells (Fig. 1A) was analyzed by computer simulation (simulations of networks comprising up to 192 1 cells were also performed for exploratory purposes, and behaved in a similar manner to the results presented here). The differential equations were solved by a numerical method based on exnonential urediction (as described in Ekeberg et al., 1991) rising a time increment of 200 ;sec. During the various simulations, &rig; spike frequency, K+ and AHP currents, [CaZ+],. and [K+],,, were recorded in all cells and extracellular spaces over 200 set in successive 0.5 set intervals. Furthermore, over this period of time, the soma potentials of a group of neighbor cells situated in the middle of the network (shown in Fig. lA), were recorded over successive 200 psec intervals. Pharmacology. In addition to the control condition, several drug conditions were simulated. In our model, we simulated the application of neostigmine by increasing the excitatory synaptic current by threefold. This increase was chosen, since it brought the excitatory current close to the maximal value that did not cause chronic, nonbursty, spontaneous firing. The K+-blocking effect on spontaneous bursts resulting from the annlication of TEA and Cs+ was simulated by reducing the K+ con_-.. du‘ctances (including g,,,). A reduction of 60%was used to emulate the early phases of recovery. This reduction was chosen since it was close to the maximal reduction that still allowed propagation of waves (higher reductions produced too little [K+],,,). In another simulation, we lowered [CaZ+],, from 4 mM to 1 mM to replicate the low Ca*+/high MgZ+ condition in turtle and concomitantly reduced synaptic input to zero.
The Journal
Finally, we simulated the low-Co2+ experiment (2 FM Co2+ ) in turtle by reducing maximal Ca2+ conductance by 5% and synaptic transmission by 20%. To estimate this reduction in Ca*+ conductance, we first used that at 10 mM CaZ+, calcium current is half-blocked by about 1 mM Co>+ in skeletal muscles (Almers et al., 1984). We then used the two-intrachannel calcium-binding-site model (Almers and McCleskey, 1984; Hess and Tsien, 1984), with the assumption that the binding of a single CoZ+ ion is sufficient to block the channel, to extrapolate the percentage of blockade to the experimental Co2+ concentration. The reduction in synaptic transmission with low Co2+ was approximated from the reduction in Ca2+ conductance through the fourth power relationship between synaptic calcium current and transmitter release (Dodge and Rahamimoff, 1967). During the simulations, the rate of wave initiation was similar for control and TEA and Cs+, was three times higher for neostigmine, and three times lower for low Ca2+/high Mg*+ and low Co2+. These threefold modulations took into account variations in excitability at the border due to modulations of excitatory synaptic current (the factor of 3 was arbitrary, but the results indicated that it had little effect).
of Neuroscience,
December
1994,
74(12)
7429
A
0’
100
iI
Time
200
(s)
1
Results Normal conditions The activity of five neighbor cells was recorded over a period of 200 sec.During this period, seven waves propagated across the whole network. This activity is shown in Figure 2A, where
for every instant an action potential occurred, a vertical line is displayed, and where the tracesfrom top to bottom correspond to the recorded cells from top to bottom in Figure IA. All cells had periods of activity alternating with periods of silenceand the activity was synchronized acrosscells. In addition to this synchronous activity, the direction of wave propagation was apparent in the firing order. The first wave hit the upper cell first, indicating a top-to-bottom wave propagation. This order wasreversedduring the secondwave asthe wave hit the bottom cell first. The individual bursts produced by the secondwave are shown in Figure 2B, where the time interval between 19 and 24 set wasexpanded. Propagation of the activity from one cell to a neighbor cell involved a delay of about 500 msec.The bursts’ interspike interval ranged from about 130 to 400 msec (the shortest interval being in the middle of the burst, and the longestat the ends of the burst), and lastedabout 2.5 sec.The interspike intervals were slightly longer than those recorded in cat and ferret (Meister et al., 199I), but were consistent with average values measuredin turtle and rat preparations (Galli and Maffei, 1988; E. Sernagor and N. M. Grzywacz, personal communication). Waves
The spatiotemporal evolution of waves in the entire network is presentedin Figure 3, where a sequenceof 112 framesdisplays the averagespike frequency of the 24 1 cells composingthe network. During this sequence,spanning 111 set, the propagation of sevenwaves(one of which being a failing wave in the middletop border of the 17th frame) can be observed, separatedby periods of silenceduring which no wave propagates(this period is about 1 set between the first and secondwaves, and about 32 set betweenthe secondand third waves). The wave front is initially circular, but straightensafter arriving to the network’s borders, as, for example, in the first wave of Figure 3. This is becausethe higher excitability of border cells causesthe waves to propagate faster at the border. The degree of the effect of border cellsis probably much higher than what one would predict for the real retina, since the number of cells in our simulations is relatively small, making the wave front more sensitive to border effects.
B
II I 19
20
21
22 Time
23
24
(s)
Figure 2. Burst activity in the middle of the network. The network shown in Figure 1 was simulated over 200 set and the activity of five neighbor cells (those with the electrodes in Fig. lA), was recorded. The resulting spike activity is shown in A as five traces whose order (top to bottom) corresponds to the electrodes’ order (top to bottom). Each spike is plotted as an individual vertical line, not discernible in this figure due to its low temporal resolution. Bursts are synchronized across cells, with a cell-to-cell delay varying according to the direction of the wave propagation (as indicated by the two verticaldashed lines). B, The period of time from 19 to 24 set is expanded to show the individual action potentials contained within the second burst in A. It corresponds to a wave propagation from the right lower comer to the left upper comer of the ganglion-cell array. For each cell, the action-potential frequency first increases (due to accumulation of extracellular K+ ) and then decreases (due to the activation of g,,,).
Theseresultssuggestwhat would happen to the wave front if waves beganin the center of the retina. The wave front would be circular until it reached the borders. Lack of spatial uniformity due to the refractory period from previous waves would rarely affect the wave front, becausethe interwave interval is much longer than the refractory period. Consequently, spiral waves or rotors, a universal behavior of excitable media with refractory period (Winfree, 1990) should be rare in the developing retina. (Such waves can occur if the refractorinessvaries acrossthe wave front.) Nevertheless, since for purposesof illustration we useda high rate of wave initiation (more typical values are close to Urnin), Figure 3 contains two examplesof
7430
Burg1 and Grzywacz
* Pharmacology
for Sponti
meous
Waves
in Developing
Retinas
Figure 3. Spatiotemporal evolution of waves in the ganglion-cell network. The average fire frequency of the 241 cells composing the network is shown frame by frame in steps of 1 set for the period of time between 18 and 129 sec. The numbers to the left are the serial numbers of the first frame of each row. Waves are separated by per iods of silence. Apparent in this figure are a failing wave (j?ame 17), a destructive collision between two waves (from the 87th to the 96th frame), 2md the linearization of the wave front (e.g., during the first wave). By using the network sizes, it is possible to measure the wave front speed and its associated spatial spread. The wave’s speed is in average 33 pm/set. The wave’s spatial spread is about 75 pm. Scale is linear from 0 to 10 H; in the rare physiologica~1event of two waves beginning in close temporal proximity. 1[n frame 17, a wave starts at the middle top border, but fails to propagate inward due to residualIAHpfrom the precedingwave. Betweenthe 87th and 96th frames, two waves, one triggered in the left top comer and the other in the right bottom corner, propagate and meet in the middle of the network where they ;imnihilate each other.
what may happen
Two related properties of the wave front are its speedand spatial spread. Spatial spreadcan either be measureddirectly from Figure 3 (about 80 ym) or can be calculatedby multiplying the wave front speedwith burst duration. For instance,in Figure 3, the first wave crossesthe network (from left to right) in about 10 sec.By consideringa typical distancebetweenthe cell’scenters at a relevant stageof development to be 20 Mm(Meister et
The Journal
of IUeuroscience.
December
1994,
74(12)
7431
Spike Freq.
Spike Freq.
11
NdlK)
11
+ L-K1out
11
Spike Freq.
Figure 4. The excitatory cyclefuelingthe waves.In this simulation,injectionof an externalcurrentinto two cellssituatedat the lowerleft comer
of the networktriggeredthe wave. SpikescausedK+ ejectioncurrentsfrom the cells’somatato their surroundingextracellularspace,resultingin an increasein [K+],,,. Finally, abovea critical [K+],,, (about5 mMin our model),neighborcellsstartedfiring to continuethe cyclethat keepsthe wavepropagating.Framesspan15set in stepsof 1 set;the serialnumberof the first frameof eachrow is indicatedto the left. Scalesarelog(O.1 PA) to log(1nA) for K+ current,O-12mMfor [K+],,,, andO-10Hz for averagespikefrequency. al., 199l), we get 364 wrnfor the horizontal size of our network. The propagation speed for the first wave of Figure 3 is thus approximately 36 pm/set. By calculating the product speed x burst duration, one gets 36 pm/set x 2.27 set = 81.7 pm asan approximation for the wave’s spatial spread. Besidesthe averagespikefrequency, it is interestingto observe the evolution of Zk, ZAHP,[K+],,,, and [Ca*+],” during a wave’s propagation. In Figure 4, the excitatory chain of events that leadsto action potentials is illustrated over a period of 14 set (15 frames). A wave is initiated at the left bottom comer. Ac-
tivation of a group of cells triggers K+ currents that induce extracellular K+ accumulation in the cells’ neighborhood. This K+ accumulation causesmembranedepolarization in neighbor cells that fire when their associated[K+],,, risesabove approximately 5 mM. One can appreciate well the temporal lead of IK over the rise in [K+],,, in the eighth and ninth framesof Figure 4, but it is difficult from this figure to appreciate the lead of potassium concentration over spike frequency (seeBurgi and Grzywacz, 1994, for a demonstration of this latter lead). The figure also showsthat the spatial spreadof the [K+],,, wave is
7432
Burgi
and
Grzywacz
f Pharmacology
for Spontaneous
Waves
in Developing
Retinas
Spike Freq.
lICa2+lin log0Ad Spike Freq.
Lca2+lin logb-lP) 11
11
11 Figure 5. Inhibitory chain of events that terminate bursts. Concomitantly to Hodgkin-Huxley spikes at the soma, Ca*+ spikes appear at the dendrite where [Ca*+&. builds up. An increase in [Ca2+linactivates the Ca*+-dependent K+ conductance (AHP), which eventually becomes strong enough to inhibit the cell. Such an inhibition impedes waves from propagating backward and imposes a refractory period during which no wave can propagate. Frames span 15 set in steps of 1 set; the serial number of the first frame of each row is indicated to the left. Scales are O-10 Hz for average spike frequency, O-700 nM for [Ca2+lin,and log(O.1 PA) to log( 100 PA) for AHP current. wider than that of the Z, and spike-frequency waves, due to the slow removal process of extracellular K+. Figure 5 illustrates the inhibitory chain of events, linking spike frequency, [Ca2+lin, and I,,, that prevents a wave from propagating backward in the model (over the same 15 set period). Somatic spikes generate Ca2+ spikes at dendrites where [Ca2+lin can build up. Elevation in [Ca2+lin is followed by an increase in ZAHP,which eventually prevents cells from firing. The very sluggish [Caz+lin decay prevents the wave from propagating backward or another wave to be initiated right away after a wave
propagated through the network. One can, for example, appreciate the lead of spike frequency over [Ca2+lin and ZAHpin the 11th frame of Figure 5. Moreover, the sluggish decay of [Caz+Jin and Z,,, are dramatically illustrated by their wide spatial spread at the end of the wave. Pharmacological manipulations The action-potential activity of two neighbor cells situated in the middle of the network was recorded over 200 set under various drug conditions. The control condition, shown in Figure
The Journal
AC The
loo
50
0
50
D
0
0
14(12)
7433
150
200
Neostigmine
loo The
c9I
1994,
(rso)
neostigmine
B
0
December
Control
50
0
of Neuroscience,
150
Time
100 (WC)
low Ca*+-
high
The
100 (ret)
SO
200
(set)
I .I 150
200
Mg*’
I I I.1 so I I I d~seo)
I ,
150
I I l!xl
200
200
Figure 6. Effects of drugs on cells’ activity. The spike activity of two cells situated in the middle of the network (third and fourth electrodes from the top in Fig. 1A) was recorded over 200 set under five conditions: A, control; B, neostigmine; C, TEA and Cs+; D, low Caz+/high Mg2+; E, low Co2+. Whereas neostigmine, a cholinesterase blocker, increased the overall activity, the low Ca*+/high Mg2+ condition suppressed it, suggesting a neuromodulatory role for synapses. Longer bursts and longer cell- to-cell delays under application of TEA and Cs+, two K+ blockers, are two effects consistent with the lateral excitation and selfinhibition mechanisms mediated by K+ currents. There were no significant low-Co2+ effects on burst duration and interspike interval (see Discussion).
6A, was compared to four conditions: neostigmine (Fig. 6B), TEA and Cs+ (Fig. 6C), low Ca2+/high MgZ+ (Fig. 60) and low Co2+ (Fig. 6E). A comparisonbetweencontrol (Fig. 6A) and neostigmine(Fig. 6B) conditions madeapparent the increasein activity following
the application of neostigmine (a cholinesteraseinhibitor). In particular, the simulations showeda 270% increasein the total number of spikes.Furthermore, there was a reduction in burst duration, interspike interval, and activation delay betweentwo neighbor cells, and an increasein the rate of bursts. The reduction in activation delay resulted from faster wave propagation.
Figure 7. Burst characteristics and pharmacology. Two drug conditions, namely, neostigmine, and TEA and Cs+, affect the burst duration and the interspike interval in two opposite ways. Whereas the first condition (neostigmine) shortens burst duration and interspike interval, the second (TEA and Cs+ ) lengthens them. Drug conditions also affect the depolarization on which the spikes ride on. Whereas in control condition the maximum of such a depolarization is about 8 mV, it becomes 12 mV for neostigmine, and 3 mV for TEA and Cs+. These differences stem from the different [K+],,, levels, resulting from higher excitability for neostigmine, and blocking of K+ channels for TEA and Cs+ conditions.
The effectsupon applications of TEA and Cs+were the opposite of the effects obtained under neostigmine (Fig. 6C). Partial blockade (60%) of K+ channels(during the early phasesof Cs+ and TEA wash)resulted in a reduction in the number of bursts (lower rate of bursts), and an increasein burst duration, interspike interval, and activation delay. The increasein interspike interval wassmall(actually statistically insignificant in our small sample)and will be addressedin the Discussion.The reduction in activation delay resulted from a slower wave propagation. Lowering [Ca2+],” and increasing Mg2+ concentration (which causesa reduction in excitatory synaptic current) had the effect of suppressingganglion cell activity almost entirely, as shown in Figure 60, indicating that under theseconditions wavesgenerally do not propagate. (Over several simulations, one wave managedto crossthe network. We estimated that with the parameters used here, the rate of such waves was roughly l/30 min.) Finally, the low-Co*+ condition caused insignificant changesin burst duration and rate of bursts (Fig. 6E). The changesin the bursts’ time courseresultingfrom different drug conditions are illustrated in Figure 7. In this figure, a control burst is compared to two other bursts that have been obtained under application of neostigmineand TEA-Cs+, respectively. Whereasin all three cases,a voltage envelope on which the action potentials ride can be observed, its amplitude differs from one condition to another. It is about 8 mV for the control condition (a value that is consistent with depolarization measurementsobtained in developing retinas of ferrets; Wong et al., 1993), 12 mV for neostigminecondition, and 3 mV for TEA and Cs+ condition. Such variations in envelope amplitude reflect different [K+],,,. Under neostigmine,the cell’s excitability increases,resulting in a shorter interspike interval and, consequently, a faster and larger K+ accumulation in the extracellular space.Conversely, Cs+and TEA slackenthe cell’sfiring rate by reducing K+ currents and thus keeping [K+],,, low.
7434
Burgi
and
Grzywacz
- Pharmacology
for Spontaneous
Waves
in Developing
Retinas
Control n=7
keostlgmine’ n= 25
TEA-C%+ n=4
Low Co2+ n=S
Control n=7
‘Neostigmik n= 25
TEA-b+ n=4
Low Co2+ n=S
Control n=7
Neostigmine n= 25
TEA-C-s+ n=4
Low Co2+ n=S
Control n=7
Neostigmine n= 25
TEA-b+ n=4
Low CoL+ n=S
8. Quantitative comparison of bursts’ and waves’ properties under various pharmacological conditions. Burst duration, interspike interval inside bursts, and wave’s speed and spatial spread are compared for four conditions: control, neostigmine, TEA and Cs+, and low Co2+. Error bars represent 1 SE, and n is the number of bursts in a single 200 set simulation generated by the cell’s activity that the fourth electrode from the top in Figure 1A recorded. Burst duration (A) and interspike interval (B) shorten under neostigmine, and lengthen under TEA-Cs+ conditions, which is consistent with experimental data. Furthermore, our model predicts a dramatic increase in wave’s speed (C) and spatial spread (D) during application of neostigmine, and a decrease for the TEA and Cs+ condition. Scalebar is linear for A and B and logarithmic for C and D. Figure
QuantiJication of pharmacological effects Figure 8, A and B, quantifies the simulated effects of neostigmine, Cs+ and TEA, and low Co2+ on burst duration and interspike interval. Burst duration decreases under application of either neostigmine (- 22%) or low Co2+ (- 3.5%), and increases under blockade of K+ channels by TEA and Cs+ (+ 105%) (Fig. 8A). Interspike interval inside bursts decreases under neostigmine (-24%) and low Co2+ (-3%), and increases under TEA and Cs+ (+ 15%) (Fig. 8B). Direction of changes both in burst duration and interspike interval are consistent with turtle data, except for the insignificant decrease in interspike interval under low Co2+ (see Discussion). Figure 8, C and D, quantifies the as yet untested predictions of the model on the effects of neostigmine, Cs+ and TEA, and low Co2+ on the waves’ speed and spatial spread. Application of neostigmine has a dramatic effect on speed, which becomes much higher (+ 2 182%). This contrasts with the TEA-Cs+ and low Co2+ conditions where waves slow down (- 62% and - 8%, respectively). The combination of wave speed and burst duration yielded a larger spatial spread for neostigmine (+ 1796%), and a smaller spread for TEA-Cs+ (-21%) and low Co2+ (-12%).
We mentioned above that in control condition the refractory period of wave rarely affects the bursts’ properties in the next wave. In contrast, under neostigmine, refractory interactions underlie the large variations in speed from one wave to the next. For instance, the wave’s speed corresponding to the third burst, in Figure 6B was 1060 pm/set, whereas the speed corresponding to the fourth burst was 200 pm/set. This speed variation could be accounted for by the interburst interval, which was relatively small between the third and fourth bursts, but relatively large between the second and third ones. The reason for the increased influence of refractoriness under neostigmine is that it causes a high rate of bursts. Therefore, one could use neostigmine to study refractory effects on waves and thus test the validity of our assumption of self-inhibition. Discussion We proposed a biophysical model for burst synchronization observed in ganglion-cell layers of developing retinas of various species (rat: Galli and Maffei, 1988; cat and ferret: Meister et al., 1991; Wong et al., 1993; turtle: Sernagor and Grzywacz, 1993a). In this model, ganglion cells communicate via the extracellular milieu that surrounds them. In this milieu, K+ ions,
The Journal
which are extruded during bursts of action potentials, accumulate. Bursts in neighbor cells are initiated when the extracellular K+ concentration ([K+],,,) reaches a critical level (typically 5 mM in our model). Concomitantly to the somatic action potentials, Caz+ spikes occur at the dendrites where intracellular Ca2+ concentration ([Ca2+li,) builds up. Bursts are terminated when self-inhibition mediated through a Ca2+ -dependent K+ conductance (gAHP)is sufficiently strong, that is, when [Ca*+], rises above 500 nM in our model. Besides its ability to reproduce waves with spatiotemporal properties similar to those observed with multielectrodes recording (Meister et al., 199 1; Wong et al., 1993), the model was also consistent with a substantial fraction ofthe pharmacological studies performed on developing retinas of turtles (Semagor and Grzywacz, 1993a). In these studies, four types of drugs were used: (1) neostigmine, a cholinesterase blocker; (2) tetraethylammonium (TEA) and Cs+, two K+ conductance blockers; (3) Co2+, a calcium-conductance blocker; and (4) octanol and dopamine, two gap-junction blockers. Furthermore, measurements under low Ca2+/high Mg2+ condition were performed. In our model, under neostigmine, we obtained shorter interspike intervals, burst duration, and a dramatic increase in activity accompanied by an increase in rate of bursts (Figs. 6, 8). The decrease in burst duration was similar to the decrease in interspike interval. In another simulation, we blocked K+ conductances by 60% to replicate the TEA-Cs+ wash condition. This partial blockade resulted in an increase in interspike interval and burst duration (Figs. 6,8). We also lowered the extracellular Ca2+ concentration, while raising Mg2+, to the same values used by Semagor and Grzywacz (1993a). This condition resulted in a dramatic reduction of activity. All these results were qualitatively consistent with the turtle data. Quantitative
comparison
with experimental
data
Despite the qualitative similarities existing between our model and the turtle retina’s modulations in burst duration and interspike interval under various drug conditions, we did not always find the samemagnitude of modulation. For instance, the increasein interspike interval that we obtained under the TEACs+ wash condition was small (+ 15%) in comparison to the experimental data (185%). Another example is the lack of significant effect on interspike interval and burst duration in the low Co2+condition. In this section,we will discussmodifications of the model that alleviate theseproblems,first addressingTEACs+ and then low Co*+. The quantitative discrepanciesin the TEA-Cs+ condition may be due to our model being over conservative, sincewe wanted to know whether even under the worst conditions, modulations of [K+],,, could carry the waves or at least affect them. For instance,one explanation for the small modulation in interspike interval under Cs+ and TEA conditions might be our use of a too effective K+ removal process.In our model, [K+],,, is effectively limited to 12 mM, a ceiling observed in all adult nervous tissues(Somjen, 1979) where physiological modulations of [K+],,, have been studied. However, such a ceiling doesnot appear to exist in developing tissues.In developing, but not adult, rat optic nerve, [K+],,, up to 20 mM have been recorded under low frequency repetitive stimulation (10 Hz) applied for a few seconds(Connors et al., 1982). If our model had a less efficient K+ removal process,then the waves would result in higher [K+],, modulations in control condition, and thus allow larger blockadesof the voltage-dependentK+ conductance(giJ
of Neuroscience,
December
1994,
14(12)
7435
Control
TEAanct
Cs’x
[
Low co2 + without GABA
Low co* + with GABA
111111
Figure 9. Effects of weak [K+],,, buffering and inhibitory GABAergic input. The spike activity of a cell situated in the middle of a seven-cell network was recorded over 5 set under four conditions. Waves were initiated by a 200 pA depolarizing current injected at a border cell. In all four conditions, an extracellular K+ removal less efficient than in all the other figures in this article was used. Thefirst truce shows the control condition. The second truce shows the substantially increase in interspike interval (and burst duration) due to the blockade of K+ channels by TEA and Cs+. The third trace corresponds to the low-CoZ+ condition when no GABA mechanism is used.This tracedoesnot conformto experimental results as it does not show significant changes in burst duration and interspike interval. The fourth truce corresponds to lowCo*+ condition with an added inhibitory GABAergicinput to the ganglion cell. Both the decrease in burst duration and increase in interspike interval are consistent with experimental results.
under Cs+ and TEA, and larger effects on interspike interval and burst duration. (In the present simulations, above approximately 60% K+ conductanceblockade, waves could not propagatedue to too little [K+],,). To investigate whether relaxing the conservative ceiling for [K+lou, would increasethe TEA-Cs+ effect, we repeatedthe simulations with weaker removal of extracellular K+. The weakening of [K+],,, buffering was achieved by reducing KK by 60% and increasing rK by 25% in Equation 2. Figure 9 showsthat this weakening causesa substantially larger interspike interval in the TEA-Cs+ condition than in the control condition (57% increase). In addition, with less [K+],,, buffering, TEA-Cs+ blockade could be as high as 80% without preventing wave propagation. Hence, this result showsthat the weak TEA-Cs+ effect on interspike interval in Figure 8 could have beenat least partially due to our conservative assumptionon [K+],,, buffering. In itself, a higher ceiling of [K+],,, is not sufficient to account for the experimentally observed low burst duration and high interspike interval under low Co2+, as illustrated in the third trace of Figure 9. On the contrary, the new ceiling appearsto have lengthenedburst duration under low CoZ+.This low Co2+ result would challengea calcium,dependent potassiumconductance asthe main mechanismfor bursts’ termination. That was the reasonwhy the low-Co*+ experiment was performed in the first place. In its simplestform, an AHP conductance predicts longer bursts under low CoZ+, sincewith reduced Ca2+current (suchascausedby Co*+ ), intracellular Ca2+accumulation would be slower. However, the low-Co*+ result does not necessarily rule out a fundamental role for Z,,, in the bursts’ termination. In the presentstimulations, the fall in synaptic excitation under low Co*+ is small (20%). Therefore, a reduced ZAHP hastrouble counteracting the practically unchanged excitation (which is [K+],,, dominated), and thus stoppingbursts. If one could make the fall in synaptic excitation larger under low Co*+, then even a small Z,,, may compensateexcitation to stop bursts, perhaps
7436
Burgi
and
Grzywacz
* Pharmacology
for Spontaneous
Waves
in Developing
even earlier than in control condition. How can the fall in excitation be made larger while keeping the total synaptic input in the control condition at the same level? One way to obtain lower burst duration and higher interspike interval under low Co2+ is to add a direct inhibitory synaptic input to the ganglion cells, while increasing the excitatory input to compensate for the new inhibitory synapse. In this push-pull mechanism, if low Co*+ were to affect the excitatory synapse more than the inhibitory one (we discuss this issue below), this would result in a large reduction in net synaptic current to ganglion cells (possibly much larger than 20%). This excitatoryinhibitory synaptic mechanism would also help even if another mechanism, such as a slow calcium-independent potassium current would mediate bursts’ stoppage (see Burgi and Grzywacz, 1994, for arguments favoring a self-inhibitory mechanism for the bursts’ termination). The addition of an inhibitory synaptic input to the model receives support from the demonstration that bicuculline, an antagonist of GABA, receptors, augments the spontaneous burst activity of cells in developing retinas (Sernagor and Grzywacz, 1994). Furthermore, support for inhibition being relatively insensitive to Co2+ or low Ca2+ comes from evidence that in the retina, GABAergic release does not always depend on CaZ+ (Schwartz, 1987). Simulations with GABAergic inhibitory synapses added to individual cells of the network resulted in shorter burst duration and longer interspike interval under low CoZ+ than in control condition (Fig. 9), confirming the conclusions hereinabove on this push-pull hypothesis. These simulations used depolarizing current of 18.75 pA and a hyperpolarizing current of 16.75 pA (values obtained after a short exploratory search of parameter space). Consequently, the net synaptic current in control condition was the same as in the other simulations (-2 PA), but the current under low Co*+ was hyperpolarizing (1.75 PA) due to the 20% reduction in excitatory current. The figure shows that this push-pull mechanism reduced burst duration by 25% and raised interspike interval by 35% under low CoZ+. In conclusion, modifying the model to allow for less efficient buffering of K+ and to include an inhibitory input goes a long way to make the model fit the data better. These two mechanisms would work in synergism, since a more efficient buffering of K+ would prevent waves from propagating under low Co2+ due to low [K+],,,. Inter-species dlferences Although bursts of activity in developing retinas can be found in a wide variety of species, there are some interspecies differences. For instance, in cat and ferret, wave front velocity is in the range of 80-300 ym/sec (Meister et al., 199 1; Wong et al., 1993) whereas our model, based on turtle data, predicts a velocity of approximately 40 pm/set. Furthermore, interspike interval varies from one animal to another. Whereas in rabbit, cat, and ferret, interspike interval is shorter than 100 msec (Masland, 1977; Meister et al., 1991) in rat and turtle it is typically longer (Maffei and Galli-Resta, 1990; E. Semagor and N. M. Grzywacz, personal communication). The long average interspike interval in turtle might partially be explained by its relatively low temperature. However, while temperature is reported to have a potent effect on cells’ spontaneous activity in developing retinas (Meister et al., 199 1; Wong et al., 1993) other factors must be involved to explain interspecies differences as rat and turtle, two animals with different temperatures, have similar average interspike interval. Besides, the range of tem-
Retinas
peratures over which waves exist or are not too irregular is different in mammals (33-37°C) and turtles (about 25°C) except perhaps in really young mammals (Wong, personal communication). Another important interspecies difference may be related to the role of synapses in wave propagation. While in turtle, synaptic blockade with low Ca2+ or high Co*+ resulted in the elimination of bursts (Semagor and Grzywacz, 1993a), in mammals the same condition yielded higher frequency of bursts, which had short duration (Meister et al., 1991). Although in their original report Meister et al. (199 1) described increased burst activity in low Ca2+/normal Mg*+, thus the retina being prone to hyperexcitability (Frankenhaeuser, 1957; Ariel and Adolph, 1985) subsequent experiments using low Ca2+/high (5 mM) Mg2+ gave similar results without hyperexcitability (Wong, personal communication). Therefore, different than turtle, it appears that direct synaptic excitation of ganglion cell is not necessary for waves in mammals. Role of waves Spontaneous bursts of activity may have an important role in dendritic outgrowth (Wong et al., 199 1; Semagor and Grzywacz, 1993b). In support of this notion, there is a strong correlation between the time in development at which spontaneous bursts disappear and the maturation of receptive-field and dendritictree sizes in the retina. In this section, however, we will focus on possible roles of burst synchronization through waves. Synchronous activity in the retina has been suggested to play a role during development in the segregation of monocular layers in the lateral geniculate nucleus (LGN) (Shatz and Stryker, 1988) refinement of the retinotopic organization in the visual system (Montague et al., 1991; Burgi and Grzywacz, 1994; Miller, 1994; Miller and MacKay, 1994) and ocular dominance segregation and development of disparity selectivity in the visual cortex (Malsburg and Willshaw, 1976; Bems et al., 1993). Miller (1994) argued that it is unlikely that synchronization through retinal waves mediate the development of orientation selectivity in cortical simple cells. His main arguments were based on the waves disappearing before the critical period for orientation selectivity and on the large spatial spread of waves as compared to the receptive-field sizes of these cells. Nevertheless, there is not as yet any significant evidence against the role ofwaves in binocular segregation and retinotopic refinement. If retinal waves, by locally correlating the activity of neighbor cells, are involved in the refinement of retinotopic organization, then the waves’ spatial spread must be considered. For cat (Meister et al., 199 1) and ferret (Wong et al., 1993) spatial spread can be evaluated to be about 300 lrn and 500 pm, respectively. For turtle, our model predicts a spatial spread of about 80 pm. Therefore, if waves matter for retinotopic organization, one might expect a higher degree of convergence from ganglion cells to LGN’s relay cells (and perhaps, to cortical cells) in cat and ferret than in turtle. Could waves also contribute to the formation of receptivefield properties in the retina? Because the propagation of a wave is spatially asymmetric and slow, it should elicit a more prolonged depolarization in dendrites or axons perpendicular to the wave front than in dendrites or axons parallel to it. This differential depolarization time course could lead to a differential reinforcement of (Hebbian-like) synapses in neural processes parallel or perpendicular to the waves, and thus lead to
The Journal
a breaking of symmetry or isotropy in the retinal connectivity. Such a Hebbian breaking of symmetry was postulated by BorgGraham and Grzywacz (1992) for the development of retinal directional selectivity, but is more likely to play a role in the development of retinal orientation selectivity (Grzywacz et al., 1994). Our model suggests that the turtle would be particularly well suited for such a developmental process, since turtle waves might be particularly slow (40 ym/sec in the present simulations as opposed to 130 pm/set in experiments with cats and ferrets). Synapses and the regulation of waves’properties Our model indicates that many neural parametersare involved in determining the cell-to-cell transmissiondelay, and thus the wave speed.For instance,the kinetics of K+ accumulation, the amplitude of the excitatory synaptic current, and the amount of leak current in cell membrane all affect this delay. And the kinetics of K+ accumulation is itself dependent on many other parameters,as, for example, volume fraction, cell death (Horsburgh and Sefton, 1987; Galli-Resta and Resta, 1992) g,, and maturity of Miiller cells.Someof the parameterscontrolling K+ accumulation, synaptic input, and cell input resistancechange during development, affecting speedand spreadof waves. There are no direct data on thesechangesfor developing retinas. However, in rat neocortex the extracellular volume fraction appears to decreaseduring development possibly as a consequenceof the emergenceof glial cells(Lehmenktihler et al., 1993). Because in the retina, glial (Mtiller) cells also emergerelatively late in development (Polley et al., 1989) one might expect a similar reduction of extracellular volume fraction in the retina asin the neocortex. Reduction in volume would make a [K+],,, mechanism for waves more efficient. On the other hand, an increase in the number of mature Mtiller cellswould tend to compensate for the reduction of volume. If our model is correct, one should expect the effect of increasedK+ buffering by Miiller cells to dominate the effect of change in extracellular volume, since waves disappearat later stagesof development. Of particular importance in the regulation of the waves’ propertiesare synapses(which might be unconventional; Zucker and Yazulla, 1982; Lipton, 1988). In cat and rat, retinal waves and burst synchronization have been reported (Galli and Maffei, 1988; Meister et al., 1991) prior to formation of synapsesonto ganglion cells(Maslim and Stone, 1986; Horsburgh and Sefton, 1987) suggestingthat synapsesdo not underlie wave propagation in thesecases.Nevertheless,the progressivedevelopment of synapsescould help to increasethe overall excitability of the ganglion-cell layer to compensatefor lossesof excitability due to a reduction of [K+],,, following the development of Mtiller cells.This synaptic neuromodulation could explain the constant wave speedobserved in ferret through development (from PO to P2 1; Wong et al., 1993). Illustration of this neuromodulatory effect in our model is given by the simulation of the neostigmine condition where an increasein the excitatory synaptic current resulted in an increaseof the waves’ speedand spatial spread (Fig. 8). Appendix Action potentials at the soma of any neuron in the network (indices referring to particular neurons have been omitted for simplicity) were determined by integrating the general membrane equation
@v(t) dt
= -(I,,
of Neuroscience,
December
+ Z, + Z,K + Z,,K
1994,
74(12)
7437
+ Iborder+ Z,,
where V is somatic voltage, C is membranecapacitance,ZNa and Z, are currents generatedby the Na+ and K+ voltage-dependent conductancesrespectively, Z,k is the portion of the soma’sleak current dependenton K+, II-k is the portion of the soma’sleak conductance not dependent on K+, Z,, is a current injected into cells situated at the retinal border to initiate a wave, Is,,,,is (constant) synaptic current, E, is reversal potential (n being for AHP, Ca, and d), gai, is axial conductance, and g, = Z,g, = g,,, + g, + g,, where g, is leak membraneconductanceat the dendrite, g,,, is calcium-dependentpotassiumconductance(defined in Eq. 3), and g, is transient voltage-dependent Caz+ conductance defined as follows (Borg-Graham, 1991): &a = &a YYl - WY,
(7)
where g, is maximal membrane conductance, and the gating particles y and 1 - w represent activation and inactivation, respectively. The general equations for these gating particles (hereinbelow denoted by x) are dx -= dt
7=-
x, - x T
1 a+P
(10)
O(= a,exp % [
(V - V,,,)
P = Poew F(V [
1
(11) 1
- V,,,) )
where V is the membrane potential, z, cu,, &, y, and V,,, are parametersof the channel, and K = 25 mV at 20°C. Potassiumand sodium currents are described by a minimal cell model (Av-Ron et al., 1991). The current ZNais defined as follows (the definition for ZKwas given in Eq. 1): ha = &z@V3(1
- w>(V - EmA
(13)
where g,, is maximal conductanceand ENais Na+ reversal potential. Definitions for m, and W, the gating particles that control the activation and inactivation of theseNa+ and K+ channels, are m,(v)=
1 1 + exp[ - 2a(m)( V - V$)]
(14)
(15) W,(v)= T(v)=-
1 1 + exp[- 2a@)(V - V$)] ’ Xexp[a(*(V-
1 V$] + Xexp[-a(“)(V-
(16)
V$]’
where Vl,2, a, and i are positive channel parameters.
(17)
7438
Burgi
and
Grzywacz
* Pharmacology
for Spontaneous
Waves
in Developing
References Almers W, McCleskey EW (1984) Nonselective conductance in calcium channels in frog muscle: calcium selectivity in a single-file pore. J Physiol (Lond) 353585-608. Almers W, McCleskey EW, Palade PT (1984) Ca channels in vertebrate skeletal muscle. In: Calcium and skeletal muscle contractility. New York: Plenum. Ariel M, Adolph AR (1985) Neurotransmitter inputs to directionally sensitive turtle retinal ganglion cells. J Neurophysiol 54: 1123-l 143. Av-Ron E, Pamas H, Segel LA (199 1) A minimal biophysical model for an excitable and oscillatory neuron. Biol Cybem 65:487-500. Av-Ron E, Pamas H, Segel LA (1993) A basic biophysical model for bursting neurons. Biol Cybem 69:87-95. Bems GS, Dayan P, Sejnowski TJ (1993) A correlational model for the development of disparity selectivity in visual cortex that depends on prenatal and postnatal phases. Proc Nat1 Acad Sci USA 90:82778281 Blatz AL, Magleby KL (1986) Single apamin-blocked Ca-activated K+ channels of small conductance in cultured rat skeletal muscle. Nature 323:7 18-720. Borg-Graham LJ (1991) Modelling the non-linear conductances of excitable membranes. In: Cellular and molecular neurobiology: a practical aDDrOaCh (Wheal H. Chad J. eds). DD 247-275. New York: bxford
ul;_
\
,
I
II
-
-
Borg-Graham LJ, Grzywacz NM (1992) A model of the directional selectivity circuit in retina: transformations by neurons singly and in concert. In: Single neuron computation (McKenna T, Davis J, Zornetzer SF, eds), pp 347-375. Boston: Academic. Burgi P-Y, Grzywacz NM (1993) A biophysical model of synchronous bursts of activity in ganglion cells of the developing retina. Invest Ophthalmol Vis Sci 34: 115 5. Burgi P-Y, Gt-zywacz NM (1994) Model based on extracellular potassium for spontaneous synchronous activity in developing retinas. Neural Comput 6:981-1002. Connors BW, Ransom BR, Kunis DM, Gutnick MJ (1982) Activitydependent K+ accumulation in the developing rat optic nerve. Science 216:1341-1343. Dodge FA, Rahamimoff R (1967) Co-operative action of calcium ions in transmitter release at the neuromuscularjunction. J Physiol (Lond) 193:419-432. Ekeberg 0, Wall& P, Lansner A, Trlven H, Brodin L, Grillner S (199 1) A computer based model for realistic simulations of neural networks. Biol Cybem 65:81-90. Fohlmeister JF, Coleman PA, Miller RF (1990) Modeling the repetitive firing of retinal ganglion cells. Brain Res 5 10:343-345. Frankenhaeuser B (1957) The effect of calcium on the myelinated nerve fibre. J Physiol (Lond) 137:245-260. Galli L, Maffei L (1988) Spontaneous impulse activity of rat retinal ganglion cells in prenatal life. Science 242:90-9 1. Galli-Resta L, Resta G (1992) A quantitative model for the regulation of naturally occurring cell death in the developing vertebrate nervous system. J Neurosci 12:45864594. Grzywacz NM, Semagor E, Amthor FR (1994) Retinal directional selectivity: function, mechanism, and development. In: The handbook ofbrain theory and neural networks (Arbib MA, ed). Cambridge, MA: MIT Press. Hess P, Tsien RW (1984) Mechanism of ion permeation through calcium channels. Nature 309:453--156. Horsburgh GM, Sefton AJ (1987) Cellular degeneration and synaptogenesis in the developing retina of the rat. J Comp Neurol263:553566. Jack JJB, Redman SJ (197 1) The propagation of transient potentials in some linear cable structure. J Physiol (Lond) 2 15:283-320. Karwoski CJ, Proenza LM (1980) Neurons, potassium, and glia in proximal retina of Necturus. J Gen Physiol 75: 141-162. Lehmenktihler A, Sykova E, Svoboda J, Nicholson C (1993) Extracellular space parameters in the rat neocortex and subcortical white matter during postnatal development determined by diffusion analysis. Neuroscience 55:339-35 1. Lipton SA (1988) Spontaneous release of acetylcholine affects the physiological nicotinic responses ofrat retinal ganglion cells in culture. J Neurosci 8:3857-3868. Maffei L, Galli-Resta L (1990) Correlation in the discharges of neighboring rat retinal ganglion cells during prenatal life. Proc Nat1 Acad Sci USA 87:2861-2864.
Retinas
Masland RH (1977) Maturation of function in the developing rabbit retina. J Comp Neurol 175:275-286. Maslim J. Stone J (1986) Svnantoeenesis in the retina of the cat. Brain Res 373:3548. \ ’ . - McArdle CB, Dowling JE, Masland RH (1977) Development of outer segments and synapses in the rabbit retina. J Comp Neurol 175:253274. McCormick DA, Prince DA (1987) Post-natal development of electrophysiological properties of rat cerebral cortical pyramidal neurones. J Physiol (Lond) 393:743-762. Medzihradsky F, Sellinger OZ, Nandhasri PS, Santiago JC (1972) ATPase activity in glial cells and in neuronal perikarya of rat cerebral cortex during early postnatal development. J Neurochem 19:543-545. Meister M, Wong ROL, Baylor DA, Shatz CJ (1991) Synchronous bursts of action potentials in ganglion cells of the developing mammalian retina. Science 252:939-943. Miller KD (1994) A model for the development of simple cell receptive fields and the ordered arrangement of orientation columns through activity-dependent competition between on- and off-center inputs. J Neurosci 14:40944 1. Miller KD, MacKay DJC (1994) The role of constraints in Hebbian learning. Neural Comput 6:98-124. Montague PR, Gally JA, Edelman GM (1991) Spatial signaling in development and function of neural connections. Cereb Cortex 1: 199220. Nicholson C, Phillips JM (198 1) Ion diffusion modified by tortuosity and volume fraction in the extracellular microenvironment of the rat cerebellum. J Physiol (Lond) 321:225-257. Penn AA. Wona ROL. Shatz CJ (1992) Junctional couoline between neurons in the developing mammalian retina. Sot Neurbsci-Abstr 18: 923. Polley EH, Zimmerman RP, Fortney RL (1989) Neurogenesis and maturation of cell morphology in the development of the mammalian retina. In: Development of the vertebrate retina (Finlay BL, Sengelaub DR, ed), pp 3-29. New York: Plenum. Rager G (1979) The cellular origin of the b-wave in the electroretinogram-a developmental approach. J Comp Neurol 188:225-244. Ramoa AS, Campbell G, Shatz CJ (1988) Dendritic growth and remodelling of cat retinal ganglion cells during fetal and postnatal development. J Neurosci 8:4239426 1. Schwartz EA (1987) Depolarization without calcium can release gamma-aminobutyric acid from a retinal neuron. Science 238:350-355. Semagor E, Grzywacz NM (1993a) Cellular mechanisms underlying spontaneous correlated activity in the turtle embryonic retina. Invest Ophthalmol Vis Sci 34: 1156. Semagor E, Grzywacz NM (1993b) Emergence of isotropic and anisotropic receptive-field properties in the developing turtle retina. Sot Neurosci Abstr 19:53. Semagor E, Grzywacz NM (1994) Synaptic connections involved in the spontaneous correlated bursts in the developing turtle retina. Invest Ophthalmol Vis Sci 35:2 125. Shatz CJ, Stryker MP (1988) Prenatal tetrodotoxin infusion blocks segregation of retinogeniculate afferents. Science 242:87-89. Sherman A, Rinzel J (199 1) Model for synchronization of pancreatic P-cells by gap junction coupling. Biophys J 59:547-559. Skaliora I, Scobey RP, Chalupa LM (1993a) Prenatal development of excitability in cat retinal ganglion cells: action potentials and sodium currents. J Neurosci 13:3 13-323. Skaliora I, Robinson DW, Scobey R,P, Chalupa LM (1993b) Development of voltage-gated potassium currents in cat retinal ganglion cells. Invest Ophthalmol Vis Sci 34: 1334. Somjen GG (1979) Extracellular potassium in the mammalian central nervous system. Annu Rev Physiol 4 1: 159-l 77. Van Harreveld A (1972) The extracellular space in the vertebrate central nervous system. In: The structure and function of nervous tissue (Boume GH, ed), pp 447-5 11. New York Academic. von der Malsburg C, Willshaw DJ (1976) A mechanism for producing continuous neural mappings: ocularity dominance stripes and ordered retino-tectal projections. Exp Brain Res [Suppl] 1:463469. Winfree AT (1990) Vortex action potential in normal ventricular muscle. Ann NY Acad Sci 591:190-207. Winslow RL, Kimball AL, Varghese A, Noble D (1993) Simulating cardiac sinus and atria1 network dynamics on the Connection Machine. Physica [D] 64:281-298. Wong ROL, Herrmann K, Shatz CJ (1991) Remodeling of retinal
The Journal
ganglion-cell dendrites in the absence of action-potential activity. J Neurobiol22:685-697. Wong ROL, Meister M, Shatz CJ (1993) Transient period of correlated bursting activity during development of the mammalian retina. Neuron 11:923-938. Yamada WM, Koch C, Adams PR (1989) Multiple channels and
of Neuroscience,
December
1994,
74(12)
7439
calcium dynamics. In: Methods in neuronal modeling (Koch C, Segev I, eds), pp 97-133. Cambridge, MA: MIT Press. Zucker C, Yazulla S (1982) Localization of synaptic and nonsynaptic nicotinic-acetylcholine receptors in the goldfish retina. J Comp Neurol 204:188-195.