Modeling Avatar Mobility of Networked Virtual Environments Siqi Shen
Alexandru Iosup
Delft University of Technology The Netherlands
Delft University of Technology The Netherlands
[email protected]
ABSTRACT Movement, one of the most common actions of avatars in virtual worlds, can have an important impact on the performance of networked virtual environments (NVEs). In this work, we propose SAMOVAR, a Statistical Area-based MObility model for VirtuAl enviRonments. SAMOVAR models four mobility characteristics: pause duration, velocity, area popularity, and distinct visited areas using empirical distribution; and then uses a map generation and a traveling procedure to generate movement trajectories of avatars. We show through simulation that the traces generated by our model can produce many mobility characteristics observed in virtual world. Further by comparing to trace-based simulation, the results obtained from SAMOVAR are similar to results obtained with traces from World of Warcraft and Second Life. Categories and Subject Descriptors: H.5 [Information Systems Applications]: Multimedia Information Systems General Terms: Design Keywords: Network virtual environment, model
1. INTRODUCTION Networked virtual environments (NVEs) such as World of Warcraft (WoW) and Second Life (SL), have millions of geographically distributed users. The popularity of NVEs has excited many researchers in the past decade. Much research effort has been proposed to scale NVEs, to manage computing resources, and to reduce communication overhead. The effectiveness of those approaches is affected heavily by the players’ movements, behaviors, and interactions. The mobility of players’ avatars can have an important impact on the performance of NVEs regarding: stability of peer-topeer overlay [7], and load balancing of client/server architecture [3]. Despite a significant amount of research dedicated for designing NVEs [5, 10, 21], there is little research that validates their approaches against real-world mobility traces [4, 9] or realistic mobility models. The most comPermission to make digital or hard copies of all or part of this work for personal or classroom use is granted without fee provided that copies are not made or distributed for profit or commercial advantage and that copies bear this notice and the full citation on the first page. Copyrights for components of this work owned by others than the author(s) must be honored. Abstracting with credit is permitted. To copy otherwise, or republish, to post on servers or to redistribute to lists, requires prior specific permission and/or a fee. Request permissions from
[email protected]. MMVE’14, March 19-21, 2014, Singapore, Singapore. Copyright is held by the owner/author(s). Publication rights licensed to ACM. ACM 978-1-4503-2708-4/14/03 ...$15.00. http://dx.doi.org/10.1145/2577387.2577396.
[email protected]
monly used mobility models in NVEs are Random Waypoint mobility model (RWP) and HotSpot model. Although these models can serve as inputs for NVEs architectures, the simulation obtained from real world traces and those simple models can be significantly different [6, 13]. Thus, a realistic mobility model for NVEs is needed to evaluate the performance of NVE designs. In this work, we develop SAMOVAR, a Statistical Area-based MObility model for VirtuAl enviRonments. We show through extensive evaluations that SAMOVAR can produce many of the mobility patterns observed in NVEs. Further we show that SAMOVAR can produce similar simulation results compared to traces from WoW and SL. There are two ways to provide input mobility workloads for NVE evaluations: mobility traces obtained from real world and models that can generate realistic NVE movements. Using mobility traces to drive the simulations and experiments of NVEs is a good approach because of their credibility, but the flexibility of using traces is limited, it is hard to extend the traces to apply to another mobility scenarios besides the original scenarios [8]. Besides, due to the limitation of data collections, it is a challenge to collect a large number of players’ movement traces over the whole virtual world without the NVEs operators’ cooperation. Mobility models are important tools for the evaluation of NVEs. Mobility models can help to generate large scale and realistic traces that fit different situations, to evaluate the impact of a mobility pattern on system performance by parameter tuning, and to better evaluate system architectures for NVEs. SAMOVAR is built as a mobility model to capture many mobility characteristics which are important for the computation and network load of NVEs. More specifically, SAMOVAR explicitly models four mobility characteristics: pause duration: the duration that an avatar has not moved; velocity: the speed of an avatar; area popularity: spatial distribution of players in different areas; distinct visited areas: different number of distinct visited areas by different players. SAMOVAR models the mobility characteristics by first modeling each characteristics separately using mathematical distributions; and then integrating them using a map generation and a traveling procedure. Through extensive validation, we show that SAMOVAR can produce all four mobility characteristics. Further, we use the traces generated by SAMOVAR, RWP and HotSpot model to drive the simulation of client/server based NVEs. Comparing to traces from WoW and SL, the simulation results for SAMO-
VAR are very similar while RWP and HotSpot models are significantly different. In summary, our main contributions in this work are: 1. We propose a mobility model for NVEs; which can model four mobility characteristics: pause duration, velocity, area popularity, and distinct visited areas. 2. We perform a large amount of simulations to show that the proposed mobility model can reproduce many mobility patterns observed in NVE traces. We show that the simulation results obtained from our model on a client/server architecture are similar to traces from World of Warcraft and Second Life. The remaining parts of this work are structured as follows. In Section 2 we present the terminology used in this work and related work. We introduce the mobility model, SAMOVAR, in Section 3. We validate and evaluate SAMOVAR with real NVE traces in Section 4. Last, we conclude in Section 5.
2. TERMINOLOGY AND RELATED WORK In this section we introduce the terminology and the related work on modeling and characterization of NVE mobility.
2.1 Terminology • Avatars (players, persons) are the moving entities. • Map in which movement takes place is well modeled by a grid of rectangular, non-overlapping areas. • Waypoints are the positions on a map. An avatar can only pause (stay in a position without movement) in waypoints. • Pause duration is the time spent by an avatar in a waypoint. • Visit, we define a visit to a waypoint only if an avatar pauses in that waypoint. • Area popularity is the popularity of an area defined as the total number of distinct persons visited that area for a specific time duration (1 day in this work). • Distinct visited areas is the set of areas that an avatar visit.
2.2 Related work Mobility models for NVEs are rare [8, 6, 15]. The most commonly used mobility models used in NVEs are the random walk (RW), the random waypoint (RWP), and the HotSpot model. In the RW model, an avatar randomly chooses a direction and a speed to travel, each movement in RW occurs in predefined time interval or movement distance. In the random waypoint model, each avatar randomly chooses a waypoint in the simulated map, and goes to the waypoint using a predefined speed. Different from RW, in RWP, if an avatar has reached a waypoint, the avatar will pause for a duration that is sampled from some distributions. The HotSpot model can be viewed as a weighted random waypoint model. In HotSpot model, a number of waypoints are randomly selected and each waypoint is assigned a weight, and the probability to go to a waypoint is proportion to its
weight. Pittman and GauthierDickey [12] propose that the weight of waypoints follows a Weibull distribution. SAMOVAR models pause duration, velocity, area popularity, and distinct visited areas, while RW, RWP and HotSpots do not. There are some workload models proposed for First Person Shooter (FPS) games. The Networked Game Mobility Model (NGMM) [18] is a variation of the HotSpot model which adds perturbations to movement paths and waypoints. Others [1, 17] use artificial intelligence (AI) players to generate workloads for FPS games. Using AI players to drive simulation is computationally intensive; thus, it is difficult to conduct large-scale experiments. Besides, the major user behaviors in NVEs are socializing, trading, finishing quests etc; instead of constantly moving and shooting as in FPS games. SAMOVAR does not model the mobility patterns in fighting scenarios, but in more real-life activities. Several studies [6, 19] analyze mobility traces from NVEs. Pittman and GauthierDickey [12] find that the popularity of different areas in WoW are skewed. Miller and Crowcroft [11] find that, in WoW battleground, despite there is an incentive to move together, most movements are individual rather than group-based. Varvello et al. [19] find that in Second Life (SL), many players form groups of good friends and meet frequently at the same locations. Liang et al. [6] collect trace from SL, and analyze the session behavior, contact patterns, and mobility patterns. Our own measurement study [14] focuses on the characterization of mobility patterns of both virtual worlds and real worlds, and analyze the differences. These measurement work serve as good start point for SAMOVAR.
3.
SAMOVAR: A MOBILITY MODEL FOR NETWORKED VIRTUAL ENVIRONMENTS
In this section we introduce SAMOVAR, the Statistical Area-based MObility model for VirtuAl enviRonments. SAMOVAR models microscopic, individual mobility in virtual environments, but can be used to generate macroscopic, population-wide mobility traces. The core of our model is a generative process, in the sense that the model incorporates the notion of time and predicts what sequence of movements would be taken by each individual, so that movement traces are generated. SAMOVAR consists of three parts, the Characteristics modeling, the Map generation, and the Walking. The characteristics modeling models each characteristic of an NVE trace using empirical modeling. The Map generation procedure generates a map with waypoints and paths between waypoints. The Walking part of SAMOVAR determines how avatars walk between waypoints. For this study, we use two NVE traces: Ironforge and Freebies. Ironforge is a one day trace we collected in July 2011 from the popular city Ironforge of WoW. The trace was collected using customized clients to obtain the avatars’ detail position every second [14]. In total, the Ironforge trace contains 1,302 avatars’ movement trajectories. Freebies is a one day trace collected by [6] from the Freebies zone of SL, and contains movement information of 3,153 avatars.
3.1
Characteristics modeling
We assume that each of the mobility characteristic is independent from each other. And we model each of the mobility
25
80
20
60
15
Data fitted LogNormal
PDF [%]
CDF [%]
100
40 20 0 0 10
1
2
10
3
10
10
10 5
Data fitted LogNormal
0 0
4
10
50
100
150
Velocity [meter/second]
Pause duration [second]
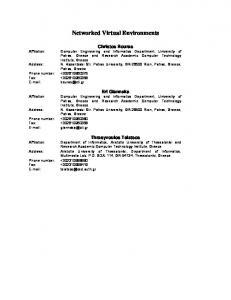
Figure 1: Distribution fitting results for Pause duration (Left) and Velocity (Right). 60
14 Data fitted LogNormal
50
10
PDF [%]
30 20
8 6 4
10 0 0
Data fitted LogNormal
12
40
PDF [%]
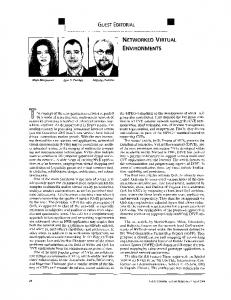
characteristics separately by using empirical distributions. To avoid overfitting and to simplify the procedure of modeling, we use some well known statistical distributions to model each characteristic instead of developing a specific empirical model for each characteristic. For each of the characteristic considered in this work, we attempt to fit the empirical data corresponding to each characteristic with a set of well-known probability distributions that are available in most simulation and experimental toolboxes, namely the exponential, the Weibull, the LogNormal, the Gamma, the Normal, and the general Pareto distributions. The fitting is performed using maximum likelihood estimation, which determines for a distribution the parameters that lead to the best fit with given empirical data. Then, we use a method for assessing the goodness-of-fit (GoF) that has been shown to have good results for large datasets in distributed systems studies [2]. In this method, the results of MLE fitting are tested using a goodness-offit (GoF) procedure that combines the Kolmogorov-Smirnov (KS) and the Anderson-Darling (AD) GoF tests. Using both of these tests provides a more robust GoF test than using any of the KS and AD tests individually, since the KS test is more sensitive to the center of distributions and the AD test is more sensitive to the tail. The method uses 0.05 as the significance level for the p-value, below which the null hypothesis that the fitted distribution represents the empirical data is rejected. The p-value used by this method is the average of 1,000 p-values, each of which is calculated by randomly selecting 30 samples from the empirical data and applying the GoF tests to the selected data. The distribution which passes the GoF test and has the lowest D value, the largest gap between the empirical cumulative distribution function (CDF) and fitted CDF, is selected as the best fit. Figure 1 (left) shows the CDF and fitting result for pause duration for the Ironforge trace. Most of pause durations (∆t) in the Ironforge trace are shorter than 30 seconds, and only a few avatars pause for more than 5 minutes. As shown in Table 1, the best fit distribution for pause duration is the LogNormal distribution with parameters (mean µ = 1.82, standard deviation σ = 1.57), the D value is 0.12, and the pvalues for KS test and AD test are 0.322 and 0.613. Figure 1 (right) shows the probability distribution function (PDF) of velocity (v), most of the velocities are slower than 20 m/s, only a few avatars travel much faster. the velocity is can be best fitted using the LogNormal Distribution (µ = 1.82, σ = 0.67) too. For the area popularity (p) of Ironforge trace, we partition the trace into 10 m × 10 m areas; there are about 80% of the areas are not visited at all. For popularity of the areas have been visited, as Figure 2 (left) shows, the weight of popularity (p) follows a long-tail distribution and can be best fitted using the LogNormal distribution. For the Distinct visited areas, as as Figure 2 (right) shows, most of the avatars only visited a small number of areas in Ironforge, and the number of distinct visited areas (k) can be best modeled using the LogNormal distribution (µ = 2.27, σ = 1.02), and the D value is 0.06. Table 1 shows the distribution fitting results for all four characteristics of Ironforge trace, while Table 2 shows the distribution fitting results for Freebies traces. All four characteristics of these traces are best fitted by LogNormal dis-
2 100
200
300
400
Popularity by number of visited avatars
500
0 0
50
100
150
200
250
Number of visited areas
Figure 2: Distribution fitting results for Popularity (Left) and Number of Visited Areas (Right). Characteristic Pause duration ∆t Velocity v Popularity weight p Number of visited areas k
Distribution (Parameters) LogNormal (1.82, 1.57) LogNormal (1.82, 0.67) LogNormal (1.65, 1.30) LogNormal (2.27, 1.02)
D value 0.12 0.09 0.14 0.06
KS AD 0.322 0.613 0.353 0.570 0.310 0.672 0.416 0.688
Table 1: Fitting results for Ironforge trace. Characteristic Pause duration ∆t Velocity v Popularity weight p Number of visited areas k
Distribution (Parameters) LogNormal (3.50, 1.22) LogNormal (0.82, 0.74) LogNormal (2.51, 1.47) LogNormal (1.78, 0.88)
D value 0.16 0.14 0.07 0.10
KS AD 0.189 0.578 0.220 0.323 0.398 0.636 0.364 0.715
Table 2: Fitting results for Freebies trace. tributions. In Section 3.2 and 3.3, SAMOVAR uses the fitted distributions to reproduce each of the characteristic.
3.2
Map Generation in SAMOVAR
In SAMOVAR, map consists of waypoints and paths. Avatars only travel along the generated paths. The generation of SAMOVAR mimics the traffic network path of virtual world that some places of interest are well connected, in order to trave from a less popular zone to a popular zone far away, it is common to go to a nearby popular zone first and then using the transportation service of that popular zone to go to zones far away. The map is generated in SAMOVAR in six steps: 1. Partition the map into 10 m × 10 m areas. Randomly select n area distributed across the map. The center point of each selected area is used as a waypoint. 2. Assign a Popularity weight (p) according the LogNormal distribution to each waypoint obtained in last step, then classify each waypoint to one of m levels according to p. Each waypoint is classified by a level, the level of a waypoint is determined by p. We use logarithmic binning to determine the level of a waypoint,
Name World size Number of avatars Number of waypoints n Number of levels m Connection range r Area of Interest range R
Table 3: Parameters for simulation.
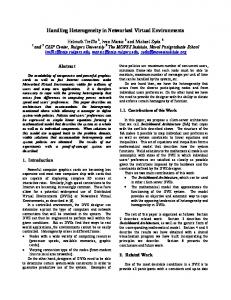
Figure 3: A generated map.
of waypoint established by the map generation part of SAMOVAR. Higher weight waypoints have a higher number of avatars.
that is, each waypoint level contains a fixed multiple of the number of waypoints included in the previous level.
3. For each avatar, iteratively add the waypoints neighboring the already assigned waypoints, until the number of assigned waypoints reaches k (step 1). The complete set of waypoints assigned to an avatar is the visit set of that avatar.
3. Connect the heaviest waypoint with each other. 4. Connect each waypoint with its closest waypoint of higher level. 5. Connect same-level waypoints with each other, if they are connected to same higher level waypoints.
4. For each avatar, assign a personal preference w for the waypoints in the visit set of the avatar, as a perwaypoint personal weight. The personal preference weight is sampled from Zipf distribution (θ = 1). The personal weights are randomly assigned to the waypoints in visit set. The reason why we assign a personal weight to each waypoint lies that avatars do have different visitation frequencies to different areas. Currently we model the personal weight to follow a Zipf distribution (θ = 1), we plan to investigate more on the personal preference modeling.
6. Connect waypoints with each other if their distance is lower than a threshold value r. We illustrate the map operation in SAMOVAR in Figure 3. Each waypoint has a level between 1 (highest) and 3 (lowest). To travel from waypoint A to waypoint E, an avatar would first go from waypoint A to waypoint B, then to C, etc. Waypoints F and G subordinate to different waypoints but are directly connected, because their distance is smaller than r. The generation of map of SAMOVAR is inspired by HTM [20]. Different from HTM, which assigns a same weight for waypoints of the same level, SAMOVAR assigns LogNormal distributed weighs to waypoints. SAMOVAR connects waypoints with each other if their distance is lower than r while HTM does not.
3.3 Walking Paths Generation in SAMOVAR
3.3.2 Path traveling process Traveling occurs for an avatar only within the personal waypoint graph, that is, the sub-graph of the map that spans only the waypoints in the visit set of the avatar, and includes all the paths between them (generated in map generation part). The path traveling process has the following steps:
Walking paths in SAMOVAR are generated via simulation. The generation process includes the path generation and the path traveling processes. The generation process assigns to each avatar a limited number of waypoints to visit during the simulation. And each avatar will have different visitation frequencies to different waypoints. The traveling process determines how an avatar will travel to the assigned waypoints. We describe path generation and path traveling, in turn.
1. Each avatar starts in the start waypoint assigned in generation process at time t = 0. 2. When not traveling or pausing, a person will change location by first selecting a waypoint to visit, from the waypoints in the visit set and according to the personal weight of each eligible waypoint. Then, the avatar travels using the shortest path in the personal waypoint graph with a speed v sampled from a LogNormal distribution.
3.3.1 Generation process The path generation process is based on an observation of the Ironforge trace that many avatars only visit a small amount of areas of the whole city. Besides, different avatars like to visit different areas of a city: auction houses, profession trainers etc. The generation process is described as follows: 1. Assign to each avatar the number of waypoints this avatar can visit, k, sampled from a LogNormal distribution. 2. Assign to each person a start waypoint. We explore two ways to assign the start waypoint for each avatar, SAMOVAR-U and SAMOVAR-W. SAMOVAR-U assigns the start waypoint randomly while SAMOVARW assigns the start waypoint according to the weight
Values 791m × 528m 1,302 1,378 9 20 100 meters
3. After reaching the selected waypoint, each person pauses for ∆t time units, which is drawn from a LogNormal distribution.
4.
VALIDATION AND APPLICATION
In this section, we validate SAMOVAR (SAMOVAR-U and SAMOVAR-W) against NVE traces using four mobility characteristics: pause duration, velocity, area popularity, and distinct visited areas. We show that SAMOVAR can reproduce all four characteristics while random waypoint and HotSpot model fail. Then, to show the practicality of SAMOVAR, we use the mobility traces produced by SAMOVAR, RWP, and HotSpot to drive the simulation of NVEs architecture. The simulation results produced by SAMOVAR are close to the results obtained by using traces from
100
80
80
80
80
60
60
60
60
40
Ironforge SAMOVAR−U SAMOVAR−W HotSpot RWP
20 0 0 10
1
10
2
10
3
10
40
Ironforge SAMOVAR−U SAMOVAR−W HotSpot RWP
20
4
10
Pause Duration [meter]
0 0
20
40
60
80
Velocity [meter/second]
Figure 4: SAMOVAR-U: Pause duration (Left) and Velocity (Right). two NVEs: WoW and SL, while the results obtained from RWP and HotSpot are significantly different. We conclude that SAMOVAR is a valid human mobility model which can be used for NVE evaluations.
4.1 Experimental setup In default, the simulation is conducted in a 791 m × 528 m map, this is the same map size as the Ironforge city. For SAMOVAR we set the number of waypoints to be 1,378, because there are 1,378 areas are visited in Ironforge. We describe the mobility models that we compare with in turn. In the random waypoint (RWP) model, each avatar will randomly select a destination in the simulation area and goes to destination along the straight line connecting current waypoint and destination; upon arrival, the avatar will pause for ∆t which is uniformly distributed between [1, 60]. The HotSpot models can be viewed as a weighted random waypoint model, in which the probability to go to a waypoint is proportional to its weight, we assigned a popularity weight to each waypoint. The popularity weight is assigned using the same distribution as SAMOVAR. For RWP and HotSpot models, the velocities for traveling is 1 m/s. All the default simulation parameters are listed in Table 3.
4.2 Validation For validation, we record all the traces generated by each mobility model, and extract four characteristics from the generated traces: pause duration, velocity, popularity, and number of distinct visited areas. After extracting the four characteristics, we compare the distribution of generated characteristics against the distribution of characteristics of Ironforge. For velocity and number of distinct visited areas, the generated properties of SAMOVAR-U and SAMOVARW are very close to the original data; for pause durations, the distributions generated by SAMOVAR are slightly higher (10%) than the real trace; for area popularity, the distribution for both models is a bit higher (5% to 10%) than the values in the Ironforge trace. For the Freebies trace, we obtain similar results that the fitting to empirical data is much better than the alternatives. Figure 4 (left) shows the pause duration for Ironforge, SAMOVAR-U, SAMOVAR-W, RWP and HotSpot models. The distribution of pause durations generated by SAMOVAR is a bit (5% to 10%) higher than Ironforge when the pause durations are lower than 20 seconds, after that SAMOVAR matches well with the trace. As Figure 4 (right) shows, the velocities predicted by SAMOVAR matches closely to real trace when the speed is lower than 8 m/s, after that the velocities predicted by SAMOVAR is slightly slower (about 5%) than real trace.
40
Ironforge SAMOVAR−U SAMOVAR−W HotSpot RWP
20 0 0 10
CDF [%]
100
CDF [%]
100
CDF [%]
CDF [%]
100
1
10
2
10
Area popularity
40
Ironforge SAMOVAR−U SAMOVAR−W HotSpot RWP
20
3
10
0 0
50
100
150
200
250
300
Number of visited areas
Figure 5: SAMOVAR-U: Popularity (Left) and Number of Visited Areas (Right).
Figure 5 (left) shows the area popularity distributions for Ironforge, SAMOVAR-U, SAMOVAR-W, RWP and HotSpot models. The area popularity distribution predicted by SAMOVAR is a bit (about 10%) higher than Ironforge trace when the area popularity is lower than 20. After that the area popularity predicted by SAMOVAR-U and SAMOVAR-W matches the trace well. Comparing to SAMOVARU, SAMOVAR-W has a longer tail, this will lead to more avatars concentrate in popular areas. The area popularity distribution predicted by SAMOVAR is much better than the results obtained using RWP and HotSpot model. Figure 5 (right) shows the distribution of number of distinct visited areas per avatar, the distribution curve of SAMOVAR is very close to the curve of Ironforge. Figure 4 and Figure 5 show that the map generation and walking procedure of SAMOVAR does not distort the characteristics which are modeled explicitly.
4.3 Application To show the practicality of SAMOVAR, we use the traces generated by SAMOVAR-U, SAMOVAR-W, RWP, and HotSpot models to drive the simulation of NVEs, and compare the results obtained using real traces: Ironforge from WoW and Freebies from SL. As SAMOVAR, RWP and HotSpot are mobility models which does not model session behaviors (when a player is online or not); to enable comparison with real traces, for each of the simulated avatar with id i, we pick an avatar with the same id from the real trace, and use the avatar’s session behavior as the behavior of the simulated avatar. The SAMOVAR can be easily integrated with session behavior model such as [16], to enable capturing both the mobility patterns and session behaviors of avatars. We adopt client/server (C/S) architecture as the NVE architecture, because it is the most commonly adopted architecture in industry, and it is also commonly used as a baseline for comparison with different architectures. In C/S architecture, a central server is responsible for the simulated virtual world, informing clients about events via network communication. The server needs to inform all clients of any position change event within the clients’ circular view of radius R (are of interest). We set the range R to be 100m for Ironforge, as it is the area of interest (AoI) range of WoW. To mimic the environment of SL, for Freebies trace, we set R to be 64m (the AoI range of SL) and the simulation area to be 256m × 256m (the size of that zone). The movement trajectories in Freebies are sampled every 10 seconds. For each avatar in Freebies we interpolate the movement trajectory to drive the simulation. For each experiment, we count the number of messages sent by the server to clients
2
1.5
1
Ironforge
0.5
Normalized Message count
Normalized Message count
6
HotSpot RWP SAMOVAR−U SAMOVAR−W
5 4
HotSpot RWP SAMOVAR−U SAMOVAR−W
3 2 1
Acknowledgement We would like to express our gratitude to the anonymous reviewers of MMVE for their constructive comments, and we would like to thank Adele Lu Jia, Otto Visser for their helpful discussions. The work is supported by CSC-TUD grant, the National Basic Research Program of China (973) under grant No.2011CB302603, and by the STW/NOW Veni grant 11881.
Freebies 0
100 200 300 400 600 800 1000 1200 1300
Number of avatars
0
100 200 300 400 600 800 1000 1200 1300
Number of avatars
Figure 6: Simulation results for C/S architecture. and normalize the message count by dividing the value by the message count obtained using real traces. Figure 6 (left) shows the normalized message count (NMC) with increasing number of players for Ironforge, RWP, HotSpot, SAMOVAR-U and SAMOVAR-W. The results obtained by using RWP and HotSpot models predict higher message count than the real trace, especially when the number of avatars is larger (120% more messages when there are 1,000 avatars). For SAMOVAR, the message count predicted by SAMOVAR-U and SAMOVAR-R is very close to Ironforge. The maximal gap between SAMOVAR-U and the real trace is only about 15%. As expected, SAMOVARU predicts a lower message count than SAMOVAR-W, and the message count predicted by SAMOVAR-U is closer to real trace than SAMOVAR-W. For the Freebies trace, as Figure 6 (right) shows, for the HotSpot model, the predicted message counts are about 4 to 5 times than the real trace. The RWP model predict slightly lower messages count than HotSpot, but its predictions are highly inaccurate too (about 4 to 5 times higher). For SAMOVAR-W, when the number of avatars is lower than 600, the NMC are about 1.8 to 1.4, but NMC quickly drops to 1.1 when the number of avatars is 800. For SAMOVAR-U, the simulation results made by it are closer to real trace than the others. When the number of avatars is lower than 300, the NMC ranges from 1.5 to 1.15. When the number of avatars is larger, SAMOVAR-U matches the real trace well, especially when number of avatars is higher than 800, the simulation results are only 5% different from real traces.
5. CONCLUSION AND ONGOING WORK In this work, we propose SAMOVAR, a Statistical Areabased MObility model for VirtuAl enviRonments. SAMOVAR models four mobility characteristics that are important to the performance of networked virtual environments: pause duration, velocity, area popularity, and distinct visited areas. SAMOVAR first model each mobility characteristics separately using statistical distributions, and then generates a map consist of waypoints and paths between waypoints, then SAMOVAR uses a traveling procedure to produce movement of avatars. Through simulation, we validate that SAMOVAR can produce all four characteristics. Further, comparing to results of simulation using real world traces, SAMOVAR can produce very close results, while the results for Random Waypoint and HotSpot models are significantly different. We are working to model more mobility characteristics such as the relationship between pause duration and popularity. In the future, we would like to validate our mobility model against more NVEs such as MineCraft.
6.
REFERENCES
[1] A. Bharambe et al. Donnybrook: Enabling large-scale, high-speed, peer-to-peer games. In SIGCOMM, 2008. [2] D. Kondo et al. The failure trace archive: Enabling comparative analysis of failures in diverse distributed systems. CCGrid, 2010. [3] Y. Deng and R. W. H. Lau. On delay adjustment for dynamic load balancing in distributed virtual environments. TVCG, 18(4), 2012. [4] M. Esch, W. T. Ooi, and I. Scholtes. Evaluation of the hyperverse avatar management scheme based on the analysis of second life traces. In ICPADS, 2009. [5] J. S. Gilmore and H. A. Engelbrecht. A survey of state persistency in peer-to-peer massively multiplayer online games. TPDS, 23(5), 2012. [6] H. Liang et al. Avatar mobility in user-created networked virtual worlds: measurements, analysis, and implications. Multimedia Tools and Applications, 45(1-3), 2009. [7] S.-Y. Hu, J.-F. Chen, and T.-H. Chen. VON: a scalable peer-to-peer network for virtual environments. IEEE Netw, 20(4), 2006. [8] L. Itzel, F. Heger, G. Schiele, and C. Becker. The quest for meaningful mobility in massively multi-user virtual environments. In NetGames, 2011. [9] J. Botev et al. Hyperverse: simulation and testbed reconciled. IJAMC, 4(2):167–181, 2010. [10] H. Liu, M. Bowman, and F. Chang. Survey of state melding in virtual worlds. ACM Comput. Surv., 44(4), Sept. 2012. [11] J. L. Miller and J. Crowcroft. Avatar movement in World of Warcraft battlegrounds. In NetGames, 2009. [12] D. Pittman and C. GauthierDickey. Characterizing virtual populations in massively multiplayer online role-playing games. AMM, 2010. [13] S. Rieche et al. Peer-to-peer-based infrastructure support for massively multiplayer online games. In CCNC, 2007. [14] S. Shen, N. Brouwers, A. Iosup, and D. Epema. Characterization of Human Mobility of Networked Virtual Environments. In NOSSDAV, 2014. [15] M. Suznjevic and M. Matijasevic. Player behavior and traffic characterization for MMORPGs: a survey. Multimedia Systems, 19(3), 2012. [16] M. Suznjevic, I. Stupar, and M. Matijasevic. A model and software architecture for MMORPG traffic generation based on player behavior. Multimedia Systems, 19(3):231–253, June 2012. [17] T. Triebel et al. Generation of synthetic workloads for multiplayer online gaming benchmarks. NetGames’12, 2012. [18] S. A. Tan, W. Lau, and A. Loh. Networked game mobility model for first-person-shooter games. In NetGames, 2005. [19] M. Varvello, S. Ferrari, E. Biersack, and C. Diot. Exploring Second Life. ToN, 19(1), 2011. [20] X. Han et al. Origin of the scaling law in human mobility: Hierarchy of traffic systems. Physical Review E, 83, Mar. 2011. [21] A. Yahyavi and B. Kemme. Peer-to-peer architectures for massively multiplayer online games: A survey. ACM Comput. Surv., 2013.