Modeling individual’s light switching behavior to understand lighting energy use of office building Chuang WANG, Da YAN*, Xiaoxin REN Department of Building Science, School of Architecture, Tsinghua University, Beijing 10084, China
Emails: Chuang WANG,
[email protected] Da YAN,
[email protected] Xiaoxin REN,
[email protected] *Corresponding author. Tel: 8610-62789761; Fax: 8610-62770544; E-mail address:
[email protected]
1
Modeling individual’s light switching behavior to understand lighting energy use of office building
Abstract The stochastic nature of lighting energy use is influenced by occupant behavior in buildings. However, it can be usually observed in office buildings that despite the randomness and diversity of occupants’ light switching behavior, 1) the lighting energy usage profile for each space level (e.g. room, zone, floor, building) looks more regular and deterministic as the space scale increases; 2) the lighting energy usage profile of multi-person office looks more regular than that of single office. To explain the phenomena, the present study investigates two private offices in an office building in Beijing, China, where occupants’ presence, lighting power, and work plane illumination are continuously measured. We reveal the driving forces behind lighting-related energy consumption in office buildings, such as daylight illumination and personnel movement and the degree to which these factors have an influence. A type of conditional probability model is built to describe the lighting use behavior of a typical person based on the analysis results of the follow-up survey conducted. Extending the model to more occupants, a type of crowding effect is found to explain the different characteristics of lighting-related energy consumption among different sized offices, which suggests that an increase in the number of occupants in an office results in a more regular schedule, longer lighting operation time, and less influence by different behaviors.
Keywords Lighting energy usage profile, office building, occupant behavior, conditional probability model, crowding effect.
2
1
Introduction
Because office buildings are an important type of commercial building, the attention people pay to both the characteristics of energy consumption and energy saving projects has risen. The energy consumption of an office building includes that used by lighting, equipment, air conditioning, elevators, ventilation, and drainage. Lighting accounts for 20–40% of total energy consumption according to the breakdown of the energy used by several buildings [1]. Therefore, a study of the lighting-related energy consumption of office buildings is crucial for examining total energy consumption in such buildings. According to abundant research results [2] by Building Energy Research Center in Tsinghua University, the energy consumption of small and large-scaled commercial buildings differs remarkably. Large scaled buildings (more than 20000m2) consumes 3-8 times more energy than small-scaled buildings (less than 20000m2) per unit area. Lighting energy in small-scaled office buildings is among 8-12kWh/(m2 ▪ a), while in large-scaled office buildings is usually 10-30 kWh/(m2▪a). Zhou et al[3] analyzed the main characteristics of measured lighting energy use data of 15 large office buildings (manual lighting control) in Beijing and Hong Kong and found that in these office buildings, the 24-hourly variation in lighting energy use was mainly driven by the presence schedules of the building occupants rather than the outdoor illuminance levels; the lighting energy usage profiles between single offices and large offices, from room to zone, from floor to building, and for different sized buildings are significantly different. Yun et al [4, 5] also found that the lighting use patterns in large offices did not have a statistically significant relationship with illuminance levels and that in small office is just the opposite. To describe the lighting usage in office buildings, many researches have been done. Commonly in building simulation programs, fixed schedules for typical weekdays, weekends and holidays are assumed to represent the dynamics of lighting energy use in buildings. This approach does not address the stochastic nature of lighting energy use, which can be influenced by occupant behavior in buildings. To overcome it, field studies have been carried out and several lighting use models are set up to describe the manual switching actions in offices. These studies mainly state two key factors in lighting usage in office buildings, including the indoor illuminance level and the room occupancy state. Hunt [6] investigated the use of artificial lighting in relation to daylight levels and occupancy and suggested the probability of switching on light as a regression function of illuminance levels. Love [7] tested Hunt’s probability function and showed the occupants fall into two different behavior groups: a) people who typically switched lights on for the whole duration of the working day, including unoccupied periods; and b) those who used electric lighting only when daylight levels were low. Reinhart and Voss [8] reviewed manual control strategies of blinds and electric lighting system, and showed that individuals consistently followed the same control strategy and groups of individuals tended to activate their electric lighting according to Hunt’s probability function. Lindelof and Morel [9] further measured the intermediate light switch probability of occupants at different indoor illuminance levels, but excluded such actions that happen upon user entry to or exit from the office. Based on the field studies, numerous researchers [10-17] proposed the calculation method to predict the lighting energy demand, evaluate the performance of manually and automatically controlled electric lighting systems, or estimate energy savings of artificial lighting use from daylighting. These studies have made great progress to help understand and quantify occupants’ light switching behavior in office building. However, the existing models are empirically 3
regressed according to a large amount of people and lack of clear physical meaning to describe occupants’ individual diversity, and there are no specific explanation for the usually observed phenomena in office buildings that despite the randomness and diversity of occupants’ light switching behavior, 1) the lighting energy usage profile for each space level (e.g. room, zone, floor, building) looks more regular and deterministic as the space scale increases; 2) the lighting energy usage profile of multi-person office looks more regular than that of single office. Considering the above, this study used two private offices to carry out a further follow-up survey and construct a model based on the survey results. Its aim is to quantify and explain the difference in lighting-related energy consumption in different sized offices by studying the fundamental definition and description of occupant behavior [18] and also based on previous work in the building occupancy simulation [19]. In this way, the main factors behind lighting-related energy consumption can be found and reflected in the lighting switching model, for the fundamental for the building simulation area. For the aim of quantifying and explaining the lighting usage in office buildings, detailed mechanism of turning on and off lighting action of the occupancy shall be studied carefully. Complete measurement data is the basic of the model establishment. Starting with the simplest cases, occupancy, lighting power, and work plane illumination of two private offices in a department building in Beijing, China are recorded over a four-month period. In additional, to know the direct driving factors of the lighting control action, questionnaires are used to inquiry the lighting usage habit of the occupancy, which tells under what condition will the occupancy turning on or turning off the light in the office . With the direction of the questionnaire survey and the measurement data analysis, we then use a conditional probability model to describe the certain lighting usage in office buildings. With this model, we consider a large open plan office with more than one occupants, which is common in usual large-scaled buildings, and extend the model to a multiple occupants situation with every occupant behaving as the model describes respectively. Several synergetic assumptions among the occupants are also added. Comparing the simulation result, we can explain how the difference of the lighting energy consumption between private and large open-plan offices come from, and also between the small and large-scaled office buildings.
2
Field study
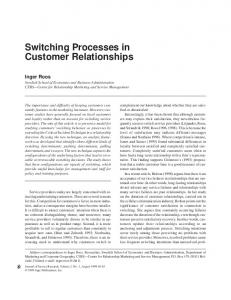
The follow-up survey was carried out in two private offices of a department building in a university in Beijing, China, with different orientations (north and south). The location of the office in the building is shown in Figure 1. The survey period was from August 2013 to January 2014. The indoor scenery of the measured offices is shown in Figure 2, with the furniture and sensors layout as Figure 3. The office has one operable window and one door in the opposite orientation. According to the interview with the occupancy, the venetian blind is scarcely adjusted, which is also a common phenomenon in many office buildings. For the simplification of the research, the blind adjustment is not measured here nor considered in the model. There are two lamps for lighting in the office, which are controlled by one switch near the door. A power meter was installed on the lamp to measure lighting-related energy consumption per minute. An illuminance logger was arranged on the desktop without any cover for horizontal work plane illumination. An infrared human body transducers is pasted on the wall towards the seat of the occupant for room occupancy. 4
Figure 1 Sketch map of the private offices measured in this study
Figure 2 Indoor scenery of the measured Figure 3 Sensor and furniture layout office The questionnaire was used to inquiry the lighting usage pattern of the occupant in the measured office. The nuclear question is “How you use the lighting in your office?”. Multiple choices are offered either for turning on the lighting and also turning off. The detailed question content can be seen in. From the questionnaire result, we can tell under what condition the occupant will turn on or turn off the light. Combining with the long term measurement data, the lighting usage model can be set up. a. Turning on light pattern
b. Turning off light pattern
[1] turn on the light once entering the office. [2] turn on the light when feeling dark. [3] basically not turn on the light. [4] others __________________
[1] turn off the light when getting off work. [2] turn off the light once leaving the office. [3] turn off the light when feeling bright enough. [4] basically not turn off the light. [5] others ___________________
The measurement results of a typical week (November 10 to 16) are presented in Figure 4, and the statistic results are shown in Table 1. Both show the lighting usage of the two private offices with stochastic, diversity and complexity. The measurement data and questionnaire result works as the fundamental in the follow-up model establishing work.
5
a)
Office A
b)
Office B
Figure 4 Occupancy, illumination, and lighting in private offices Table 1 The results of the lighting-related energy consumption survey in private offices
3
Measured Offices
Average daily lighting-on time (h/day)
Average daily lighting energy consumption (10-3kWh/day)
Office A Office B
0.606 1.180
28 103
Conditional probability model of light switching behavior
Based on the questionnaire result and measurement data of the private offices, we can use the conditional probability model to describe the lighting usage of the occupants. The conditional probability model developed by our group has been proved feasible in air-conditioner usage in residential buildings [20]. To use the model, occupant action patterns shall be informed first, for the pre-selection of the function form. Then the 10-minute step measurement data is used to do the statistics and function fitting to get the parameters of the model. In this way the lighting usage model of a single agent in a private office can be developed. In this research, drawing from the questionnaire results of the measured private offices, we can get the driving forces behind turning lights on and off. The lighting usage pattern options chosen by the two occupants respectively is actually the same, which we can tell mainly follow two principal lines: (i) influenced by personnel movement or other events (by choosing the option of “turn on the light once entering the office” and “turn off the light once leaving the office”) and (ii) work plane illumination (by choosing the option of “turn on the light when feeling dark” and “turn off the light when feeling bright enough”). The patterns work in a random way, as basically the following process. When the occupant enters the office, he or she has a probability to judge whether to turn on the light according to the indoor illuminance then (if the light is off); also when he or she stays in the office, a probability comes up every other unit time step to judge whether to turn on the light according to the daylight illuminance (if the light is off); when the occupant stays in the office and the light is on, a probability comes up every other unit time step to judge whether to turn off the light according to the indoor illuminance; also when the occupant leaves the office, he or she has a probability to judge whether to turn off the light according to how long he or she leaves (if the light is on). According to the conditional probability model frame, for every lighting usage pattern talked above, 6
a mathematical function can be used to describe, which is shown in Table 2. Table 2 The mathematical function of lighting usage patterns in conditional probability model
N o .
Pattern description
Mathematical model u-x L , x u , when occupied P 1 e 0, x u k
1
Turn on the light when feeling dark
2
Turn on the light once entering the office
ux 1 e c L , x u P 0, x u k
x u L , x u , when occupied P 1 e 0, x u k
3
Turn off the light when feeling bright enough
4
Turn off the light once leaving the office
P 1 e
t leave L
k
*x: work plane illumination; u, L, k, c: parameters of the function; tleave: time lasted during the occupant away from the office.
The basic function used in the conditional probability model is the three-parameter Weibull distribution function, which in prototype is x-u 1 e L , x u P . 0, x u k
By changing the parameters of the function, the curve can be changed as Figure 5 shows. Here, u is the threshold of the function, which means when x is on the smaller side of u value, the dependent variable will be absolutely zero. In the physical significance, u value is the threshold the occupant starts to have the probability to take the action, while on the side the action will never happen. The parameter L describes the scale of the function, which is used to non-dimensional (x-u) and with the same unit with the independent value. The parameter k describes the slope in the function, as k value is bigger the sensibility of the dependent variable on the independent variable is higher, which means the occupant is more sensitive to this factor. In this way, by changing the parameters, the probability curve can be quite different even the pattern form is the same. Various patterns combination and significative parameters give flexibility of the model to describe the stochastic, diverse, complex occupant action in buildings. This form of function is chosen because of the properties of the single value feature, S-shaped growth, and adaptation of the probability transformation relationship 1 y ( n) (1 y (1) )n , which means a transformability of the model among different time steps.
7
Figure 5 Schematic plot of the three-parameter Weibull distribution function By doing the statistic of the measurement data and the fitting of the model, we can derive the conditional probability model of the two offices. The result is shown in Table 3, which includes the lighting usage patterns, figures of the statistic points of the measurement data and fitting curves, model parameters, and the goodness of fittings. Table 3 Lighting usage conditional probability model of the measured offices
Office A Turn on when entering the room
Turn off when feeling bright enough
Turn off when leaving the room
1
1
0.9
0.9
0.8
0.8
0.8
0.7 0.6 0.5 0.4 0.3
0.7 0.6 0.5 0.4 0.3
0.7 0.6 0.5 0.4 0.3
0.2
0.2
0.2
0.1
0.1
0.1
0
0
0
0
50
100
150 200 250 300 350 Work plane illumination (lux)
400
450
500
0
50
100
150 200 250 300 350 Work plane illumination (lux)
400
450
500
u 325, L 427.32, k 9.15, c 63.56
u 325, L 427.32, k 9.15 ( R 0.9978) 2
Possibility of turning off light
1 0.9
0.8
Possibility of turning off light
1 0.9
Possibility of turning on light
Possibility of turning on light
Turn on when feeling dark
0.7 0.6 0.5 0.4 0.3 0.2 0.1
0
100
200
300 400 500 Work plane illumination (lux)
600
700
0
800
0
200
400
600 800 1000 Leaving time span (min)
1200
1400
u 175, L 2300.53, k 1.30
L 130.28, k 79.60
( R 1.0)
( R2 0.9781)
Turn off when feeling bright enough
Turn off when leaving the room
2
( R2 0.9780)
Office B Turn on when entering the room
1
1
0.9
0.9
0.8
0.8
0.8
0.7 0.6 0.5 0.4 0.3
0.7 0.6 0.5 0.4 0.3
0.7 0.6 0.5 0.4 0.3
0.2
0.2
0.2
0.1
0.1
0.1
0
0
0
0
50
100
150 200 250 300 350 Work plane illumination (lux)
400
450
500
u 325, L 562.97, k 5.81 ( R 0.9946) 2
0
50
100
150 200 250 300 350 Work plane illumination (lux)
400
450
500
u 325, L 562.97, k 5.81, c 56.15
Possibility of turning off light
1 0.9
0.8
Possibility of turning off light
1 0.9
Possibility of turning on light
Possibility of turning on light
Turn on when feeling dark
0.5 0.4 0.3
0.1 0
0
100
200
300 400 500 Work plane illumination (lux)
600
( R2 0.9423)
( R 0.9002)
0.6
0.2
700
800
u 125, L 2450.57, k 2.66
2
0.7
0
200
400
600 800 1000 Leaving time span (min)
1200
1400
L 104.30, k 71.22 ( R2 0.9999)
Actually in real office settings, there may be many more drivers for the on/off switching of the lighting other than the four basic ones considered here conducted from the questionnaire result. A 8
model simplicity is done here for the aim to describe the lighting usage more compendiously but not mistakenly by assuming the conscious idea of occupant own behavior patterns.
4 4.1
Application of the lighting model The impact of the crowding effect
Hunt’s[20] and Yun’s studies[10,11] both have found the observation of the lighting usage feature in multi-person offices, where lighting is usually turned on from the beginning until the end of day. On the other hand, the lighting usage in a private office is generally random and short-duration. For the aim of describing the lighting usage in a large open-plan office, the conditional probability model is expanded and tried to be used in a multi-person office. Several assumptions have to be proposed before the model is used in a multi-person situation. 1) Every occupant in a large open-plan office has his own basic lighting usage behavior as the same as when he is in a private office. 2) Lighting usage behavior is interacted among the occupants based on his own basic behavior, for example when there are other people in the office, the turning-off light action won’t happen; while the turning-on light action is not influenced by others. 3) The lighting system is controlled by every occupants in the office with equal right. Hence, we construct a lighting model of a large open-plan office, where several occupants have the equal right to control the light. The indoor illumination is given as the same as that referred to in Office A. Further, occupant lighting usage behavior is assumed to be homogeneous, the same as that in Office A (the model is shown in the upper half of Table 3). The personnel movement is assumed to be the same as the measured occupancy. Also considering the interactions among occupants, the lights are only probably turned off when (i) all occupants in the office feel that it is bright enough or (ii) the last occupant leaves the office. On the other hand, the lights are turned on whenever any occupant wishes. In this simulation case, as the number of occupants rises from 1 to 5 and then to 20, we can see some interesting result showing the different features of lighting usage when occupants number increases. The simulation results for a typical day (Dec. 17th) are shown in Figure 6, from which we can preliminarily see that as the number of occupants rises, lighting operation time increases. Indeed, when there are 20 occupants in the office, the lights are on nearly throughout the working time. For accurate comparison purposes, a 126-day simulation based on the real measurement is done and the results are shown in Figure 7, which presents the average daily lighting operation time for different numbers of occupants. We see that quantitatively lighting operation time is longer as there are more occupants in the office.
Figure 6 The simulation results of lighting operation 9
Figure 7 The simulation results of
time with a different number of occupants for a typical day
daily lighting operation time with a different number of occupants for a long-term period (*W means the number of occupants in the office)
When the simulation is repeated a number of times, the variability among the results every time can reflect the randomness in the real process to some extent. As shown in Table 4, the 126-day simulation is repeated for 100 times. The simulation daily lighting operation time, the standard deviation among different simulation times and the coefficient of variability are conducted with different occupant number in the office. Coefficient of variability (CV= standard deviation (SD) / mean) is an important value for describing the stability. When we use the CV index, the influence of different data sizes is removed, and this allows us to describe the randomness of different conditions precisely. The smaller the CV is, the more concentrated are the data and the lower is the degree of randomness; from the viewpoint of physics, this means that the lighting schedule is more regular and thus energy consumption is more concentrated and stable. Concluded from the table, when occupant number increases, the CV lighting operation time increases, and the lighting schedule is more regular with less randomness. Table 4 The influence of the crowding effect based on a different number of occupants
Numbers of occupants Simulation daily lighting operation time (h/day) Standard deviation among different simulation times (h) Coefficient of variability
W=1
W=5
W=20
0.50
1.07
1.48
0.1352
0.1668
0.1639
0.2718
0.1561
0.1109
The phenomena found above can be described as a kind of crowding effect. This effect is usually found in multi-person situation as large open-plan offices. When occupants gather to a certain degree, lighting-related energy consumption is affected. The interactions among multiple occupants lead to a longer lighting operation time and thus higher energy consumption. Further, as the number of occupants increases, the randomness weakens, the lighting schedule becomes more regular, and lighting operation time reaches a steady level. This phenomena is called crowding effect, which explains the different features of lighting usage between private and large open-plan offices appropriately. 4.2 The effect of different occupant behaviors In reality, occupant behavior varies from person to person; in other words, it is not as consistent as the assumption in the case presented in section 4.1. In order to further explore the influence of different lighting control behaviors, three typical lighting usage patterns are set, with the same model description and different characteristic parameters shown in Table 5. In this case we find that type C occupants use lighting more often than type B occupants, while type B occupants use lighting more often than type A (see the reaction curves shown in Figure 8). We also consider three conditions with different numbers of occupants (W=1, 5, 20) and change the occupant behavior type under each condition. Thus we have nine simulation cases. The simulation results for a typical day (12.17) are presented in Figure 9, and Figure 10 shows the statistic results for the 126-day long10
term simulation. Table 5 Characteristic parameters of different lighting control behaviors
Type
A B C
Turn on light when feeling dark/entering the room
Turn off light when feeling bright enough
U
L
k
c
u
L
k
225 325 425
380 430 480
7 9 11
50 60 70
75 175 275
1300 2300 3300
1.2 1.3 1.4
Turn off light when leaving the room L k 80 130 180
100 80 60
Figure 8 The reaction curves of three typical occupants in the lighting usage model W=1
W=5
W=20
Figure 9 The simulation results for a different number of occupants with different behaviors for a typical day of office B (the colored block stands for the “on” states of light)
11
Figure 10 The simulation results for a different number of occupants with different behaviors for a long-time period These figures show that as the number of occupants increases, the schedule becomes more and more regular and the difference among the three types reduces. When the number of occupants reaches 20, the influence of the behavior of a single person is not as notable as it is in a private office.
5
Conclusions
This study presents a conditional probability model to describe lighting use behavior in office buildings. A three-month follow-up survey in private offices was conducted in an office building in Beijing, China. We meticulously measured work plane illumination, personnel movement, and lighting-related energy consumption. A detailed lighting usage behavior questionnaire was carried out. From these in-depth measurement data, basic lighting use conditions can be concluded. The lighting usage model presented herein reflects the environment- and event-related driving forces behind lighting usage in office buildings and describes the degree to which these factors influence lighting use. A three-parameter Weibull function and probability relations are also used to describe the random process of lighting use. The measured offices are found to be able to be describe by the model appropriately. The model is then evaluated using three key criteria to prove its effectiveness and usability. The goodness of fitting value R2 is used to test the function’s suitability; the ACF and PACF parameters are used to test the similarity of the simulation results with the real data; and certain statistical indicators are used to test the applicability of the model. After the evaluation, the model is proven to be effective and usable. The application of the lighting usage model calculates lighting-related energy consumption among offices with different number of occupants, also with different lighting usage behavior. Based on the simulation, we find the phenomena called the crowding effect, namely that an increase in the number of occupants in an office results in a more regular schedule, a longer lighting operation time, and less influence by different behaviors. Also the increase in the number of occupants make the individual behavior pattern not as notable as in a private office. In terms of future research, more work is still needed in studying the occupant behavior model in buildings. Using the occupant behavior model to build simulations would be a promising area for the improvement of the building simulation study. 12
Acknowledgements This project was supported by the Twelfth Five –Year National Science and Technology Support Program “Research on a framework to support energy efficiency technologies in buildings” (Grant No. 2012BAJ12B00).
REFERENCES
[1]
Building Energy Research Center in Tsinghua University. 2013 Annual Report on China Building Energy Efficiency. China Building Industrial Publishing, Beijing, 2013 [in Chinese]. [2] Building Energy Research Center in Tsinghua University. 2010 Annual Report on China Building Energy Efficiency. China Building Industrial Publishing, Beijing, 2013 [in Chinese]. [3] Xin Zhou, Da Yan, Tianzhen Hong, Xiaoxin Ren. Data analysis and stochastic modeling of lighting energy use in large office buildings in China. Energy and Buildings, 2015, 86: 275-287. [4] G. Y. Yun, H. J. Kong, H. Kim, J. T. Kim. A field survey of visual comfort and lighting energy consumption in open plan offices. Energy and Buildings, Mar 2012, 146-151. [5] G. Y. Yun, H. Kim, J. T. Kim. Effects of occupancy and lighting use patterns on lighting energy consumption. Energy and Buildings, Mar 2012, 152-158. [6] D. Hunt. The use of artificial lighting in relation to daylight levels and occupancy. Building and Environment, 1979, 14, 21-33. [7] J. A. Love. Manual switching patterns observed in private offices. Lighting Research and Technology, 30 (1998), 45–50. [8] C. F. Reinhart, K. Voss. Monitoring manual control of electric lighting and blinds. Lighting Research and Technology, 35 (2003), 243–260. [9] D. Lindelöf, N. Morel. A field investigation of the intermediate light switching by users. Energy and Buildings, 38 (2006), 790–801. [10] C. F. Reinhart. Light switch 2002: a model for manual control of electric lighting and blinds. Solar Energy, 77 (1) (2004), 15–28. [11] D. Bourgeois, C. Reinhart, I. Macdonald. Adding advanced behavioural models in whole building energy simulation: A study on the total energy impact of manual and automated lighting control. Energy and Buildings, 38 (2006), 814-823. [12] M. Stokes, M. Rylatt, K. Lomas. A simple model of domestic lighting demand. Energy and Buildings, 36 (2004), 103-116. [13] J. Widen, A. M. Nilsson, E. Wackelgard. A combined Markov-chain and bottom-up approach to modelling of domestic lighting demand. Energy and Buildings, Oct 2009, 10011012. [14] I. Richardson, M. Thomson, D. Infield, A. Delahunty. Domestic lighting: a high-resolution energy demand model. Energy and Buildings, 41 (2009), 781-789. [15] M. Krarti, P. M. Erickson, T. C. Hillman. A simplified method to estimate energy savings of artificial lighting use from daylighting. Building and Environment, Jun 2005, 747-754. [16] P. Ihm, A. Nemri, M. Krarti. Estimation of lighting energy savings from daylighting. Building and Environment, Mar 2009, 509-514. [17] C. Ehrlich, K. Papamichael, J. Lai, K. Revzan. A method for simulating the performance of photosensor-based lighting controls. Energy and Buildings, 34 (2002), 883-889. 13
[18]
C. Peng, D. Yan, R. Wu, C. Wang, X. Zhou, Y. Jiang. Quantitative description and simulation of human behavior in residential buildings. Building Simulation, 2012, 1-10. [19] C. Wang, D. Yan, Y. Jiang. A novel approach for building occupancy simulation. Building Simulation, Vol 4, No 2, 2011, 149-167. [20] X. Ren, D. Yan, C. Wang. Air-conditioning usage conditional probability model for residential buildings. Building and Environment, 2015, 81, 172-182.
14