Modeling RNA loops based on sequence homology and geometric constraints Supplementary Material Christian Schudoma a,b,∗, Patrick May a,∗, Viktoria Nikiforova b, and Dirk Walther a,∗ a Bioinformatics b System
Group and
Integration Group, Max Planck Institute of Molecular Plant Physiology, Am M¨ uhlenberg 1, 14476 Potsdam-Golm, Germany
Abstract Key words: RNA 3D structure, structure prediction, molecular modeling
RLML – The RLooM Modeling Language Modeling loops using the RLooM application is performed using a simple XML-like script language – RLML. Three parameters can be adjusted: the template data set that should be used, the maximum distance between the anchors of a loop and a target structure such that the inserted loop gives a valid model, and the threshold distance defining when a clash occurs between the new loop and the target molecule. A single command is enclosed between tags specifying the loop-type of the query. ..., with x = hairpin|segment|internal|multiloop Each command has a number of anchors (hairpins/segments:2, internal loops:4, multiloop:6+): ANCHOR ID, with ANCHOR ID = RI:C, R=resSeq, I=iCode, C=chainID ∗ Corresponding author. Email address:
[email protected] (Christian Schudoma). Preprint submitted to Nucleic Acids Research
October 15, 2009
The anchor-tag has an optional parameter id, which can be used for specifying the sequence of the anchors. By default, -tags are processed in order of appearance.
Finally, each command requires a query:
SEQUENCE,
with SEQUENCE being a nucleotide sequence, wildcards are allowed
The -tag has three optional parameters: k, force, and mcsearch. The parameter k specifies the tolerated number of mismatches, force denotes whether suitable candidate loops with a different sequence than the query shall be artificially mutated to match the query sequence. The parameter mcsearch, if set to true, allows a valid MC-Search script (for details see e.g. http://major.iric.ca) to be submitted instead of the query sequence. By default, k is set to 0, force to false, and mcsearch to true.
The optional - tag specifies, whether loop candidates should be mutated into its enclosed sequence.
SEQUENCE,
where SEQUENCE has to be a non-wildcard nucleotide sequence.
Supplementary Figures and Tables
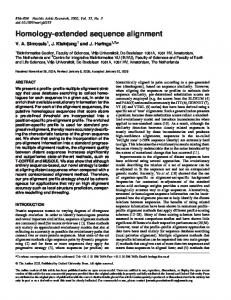
Figure 1. Structural similarity of highly divergent sequences blue: 23S rRNA GNRA-tetraloop hairpin (Sequence: GGGA, PDB id: 1ffk), orange: 23S rRNA tetraloop hairpin (Sequence: AAUC, PDB id: 2gya) The reduced backbone RMSD of the superposed structures is 0.14˚ A.
1evv:a
1evv:b
13vv:c
1l2x
1q8n
1q9a
1rmn
2cky
2f88
13-22
30-40
53-61
7-14
14-19
6-22
16-21
26-36
23-27
1ehz∗
1mj1
2k4c∗
1l3d∗
1m90∗
2d3o∗
3bbn∗
3d2x∗
1jzx∗
RMSDa
0.14
0.00
0.15
0.90
0.48
0.16
0.20
0.25
0.44
RMSDb
1.04
0.78
1.11
1.72
4.12
2.76
3.12
0.53
1.58
RMSDs
0.98
0.69
0.90
0.75
2.05
1.05
1.71
0.38
1.34
Bases Best Hits RLooM
iFoldRNA RMSDa
1.08
0.30
1.21
0.50
0.48
2.58
0.60
1.39
1.01
RMSDb
10.88
3.90
4.72
4.40
1.26
23.19
2.51
9.21
1.45
RMSDs
6.19
6.42
6.90
5.43
5.31
8.75
5.68
6.31
1.18
14
11
16
3
25
23
58
2
13
All Hits RLooM #models RMSDa Range Mean
[0.00,0.96] 0.48
± 0.27
[0.00,0.52] 0.29
± 0.17
[0.00,0.95] 0.48
± 0.25
[0.11,0.99] 0.67
± 0.48
[0.00,1.02] 0.70
± 0.20
[0.03,1.13] 0.44
± 0.28
[0.00,1.23] 0.52
± 0.23
[0.22,0.25] 0.24
± 0.02
[0.00,2.63] 1.16
± 0.80
0.52
0.31
0.50
0.90
0.70
0.33
0.47
0.24
0.97
[0.00,2.98]
[0.78, 1.74]
[0.00,3.81]
[0.25,2.19]
[0.00,2.31]
[0.15,8.66]
[0.00,1.26]
[0.41,0.53]
[0.00,3.51]
Median RMSDb Range Mean
2.73
± 2.20
1.10
2.26
Median
± 0.45
1.93
1.15
± 1.27
1.39
1.70
± 1.01
1.69
1.72
± 0.86
4.35
1.52
± 2.09
1.18
3.99
± 0.35
0.47
1.10
± 0.08
2.30
0.47
± 0.97 2.19
RMSDs Range Mean
[0.00,2.26] 1.43
Median
± 0.82
[0.69,1.1] 0.73
± 0.28
[0.00,3.15] 1.29
± 0.91
[0.10,0.79] 0.55
± 0.39
[0.00,1.67] 1.24
± 0.42
[0.14,2.05] 1.45
± 0.45
[0.00,1.44] 1.74
± 0.73
[0.38,0.49] 0.44
± 0.08
[0.00,2.89] 1.84
± 0.75
1.43
0.72
0.93
0.75
1.20
1.40
1.54
0.44
1.76
10
10
10
10
10
10
10
10
10
iFoldRNA #models RMSDa Range Mean
[1.08,4.12] 2.42
± 0.92
[0.30,3.04] 0.85
± 0.89
[1.21,3.51] 2.19
± 0.79
[0.50,1.22] 0.76
± 0.24
[0.48,4.78] 1.36
± 1.36
[2.58,3.99] 3.18
± 0.52
[0.60,3.42] 1.82
± 0.89
[1.39,7.28] 5.04
± 1.82
[1.01,5.92] 2.91
± 1.46
2.48
0.48
2.15
0.76
0.76
3.01
1.97
5.24
2.93
[9.60,21.67]
[2.44,16.45]
[4.56,17.46]
[3.18,7.55]
[1.26,10.98]
[19.05,28.28]
[2.34,9.69]
[9.21,18.62]
[1.45,5.75]
Median RMSDb Range Mean
14.68
± 4.24
8.18
± 5.40
10.02
± 5.08
4.94
± 1.34
3.48
± 2.83
24.11
± 2.86
4.10
± 2.23
13.57
± 2.91
3.41
± 1.39
14.51
6.82
9.39
4.65
2.45
23.95
3.08
13.37
3.27
[4.77,6.83]
[6.37,9.77]
[5.53,7.83]
[4.94,5.89]
[5.31,6.25]
[7.61,9.50]
[5.04,8.46]
[6.31,8.86]
[1.18,4.35]
Median RMSDs Range Mean Median
6.10
± 0.65 6.26
7.23
± 1.26 6.59
6.61
± 0.63 6.50
5.30
± 0.29 5.33
5.72
± 0.33 5.68
8.55
± 0.53 8.62
6.09
± 1.03 5.80
7.55
± 0.84 7.42
2.48
± 0.91 2.34
Table 1 Loop modeling results Modeled structures are indicated by their PDB-identifier and are located in chain A. RM SDa : RMSD between anchors, RM SDb : RMSD between reduced backbones given anchor superposition, RM SDs : structural similarity – RMSD between reduced backbones given optimal superposition, values are given in ˚ A, ∗ : second best template (cf. text)
Figure 2. Backbone divergence between iFoldRNA model and native structure blue: iFoldRNA model green: PDB structure 1q9a, A6-A22. Structures are superposed at their anchors.