J
,
Modeling the Gulf Stream system: how far from reaIity? Yi Chao 1, Avijit Gangopadhyay ‘, Frank O. Bryan 2, and William R. Ilolland Abstract. Analyses of a primitive equation ocean model simulation of the Atlantic Ocean circulation at 1/6° horizontal resolution are presented with a focus on the Gulf Stream region. Among many successful features of this simulation, this letter describes the Gulf Stream separation from the coast of North America near Cape Hatteras, meandering of the Gulf Stream between Cape Hatteras and the Grand Flanks, and the vertical structure of ternpcrature and velocity associated with the Gulf Stream. These results demonstrate significant improvement in modeling the Gulf Stream system using basin- to globalscalc ocean general circulation models. Possible reasons responsible for the realistic Gulf Stream simulation are discussed, contrasting the major differences bctwccn the present model configuration and those of previous eddyrcsolving studies. Introd[lction Tlc Gulf Stream (GS) is one of the most energetic current systems in the world ocean, and is a dominant feature of the North Atlantic circulation. Description and understanding of the dynamics of the CiS, the associated mcso-scale edclics, and their interaction with the largcscalc circulation are fundamental to improving our understanding of the North Atlantic’s general circulation 1 and its role in regulating the Earth’s climate. Accurately simulating the GS system has been OI]C of the most challenging tasks in ocean modeling (Sc.mtncr, 1995; McWilliams, 1996). I)UC to the complex interplay of the flow field and density stratification in tht! dynamics of the GS, a realistic simulation must accurately account for both wind and thcrmohaline forcing,s. Hcrctoforc, even moderately high resolution (1/2° to 1/6°) basin- to global-scale primitive equation general circulation models have nc)t been able to accurately capture the structure of the CiS system. A common problcm in these previous silnulations has been an unrealistic separation of the CiS from the coast of North America: the separation latitude occurs too far to the nort}] and is accon~panicd by a much too stron~ antic yclonic (clockwise) circulation. his Icttcr presents t}]c rccmt success in simulating the GS systcm with a basin -sca]c primitive. equation model. “1’hc. horizontal resolution of this model is approximately 1/6°, i.e. ktwccn 15 and 20 km in the vicinity of the CiS. After twenty-two years of integration the model simulation shc)ws significant in~provcnlcnts over prcvious ccldy-resolving, basin- to global-scale calculations. In par~icu]ar, the GS separation and its subsequent clownstrcam meanclcrin.g arc in good agre.e.rncnt with the available. observations. The vertical profiles of ten]perature and velocity fields assc)ciated with the. GS re.sernblc those derived from ship-based mcasurcmcnts.
2
‘2.
,.
Model and Experiment Design The experiment described here makes use of the Parallel Ocean Program (POP) developed at Los Alamos National I,aboratory (Dukowicz and Smith, 1994). The mode] domain covers the Atlantic basin from 35°S to 80”N and from 100”W to 20% The water exchange processes across the artificially closed open boundaries are pararnetcrized by 5° wide buffer zones in which the model temperatures and salinities are restored toward the seasonal climatology. The model is formulated on a spherical grid with horizontal resolution of approximately 1/6° (O. 1875° in longitude and 0.1843° in latitude), and 37 vertical levels. The model has been ~intcgratcd for a total of twcnt ytwo years, consisting of three experiments that differ from each other in their surface forcings and initial conditions. The first experiment was integrated for ten years starting from the January temperature and salinity distributions derived from the Levitus (1982) climatology and zero current. The surface wind stress and heat flux were based upon the seasonal climatology (IIellcrnlan and Roscnstein, 1983; Han, 1984), and the surface salitlity was restored to the Lcvitus climatology. The second cxpcrirncnt was initialized with the solution from the end of the first experiment. The wind stress was based upon the ensernblc monthly mean fields derived from the Iiuropean Center for Mediun~-Range Weather I:orccast (PKMWI’) analysis, while the heat and salt boundary conditions were the same as in the first experiment. q’hc second experiment was integrated for two years. ~’hc third experiment was initiali?.ed with the solution from the end of the second experiment. The surface heat flux was derived from the EC’MWF analysis based upon Barnier (1995)’s formulation, while the wind and salt boundary conditions were the same as the second experiment, l’hc third experiment was integrated for another ten years. Results frotn only the third experiment arc presented here. Simulation Versus observations ‘l’he major success of the present study is the realistic CiS separation from the coast of North America near Cape }Iattcras. This is i]]ustratcd in Iiigurc 1 of the sea surface height and surface current averaged over the last ten years of simulation during the third experiment. In comparison with the previous ccidy-resolving caicuiations, the Community Modeling F. ffort (CM}i) for cxallip]c, the prc.sent model shows a nutnbcr of improvcn~ents in the CiS simulation. ~’he permanent, closed, anticyclonic circulation in the Mid-Atlantic Bight as seen in the C:Mfi simulations (see Figure 5 in Bcckmann et ai., 1994, and IJigurc 2 in IIryan et ai., 1995) is absent in the present study. As one can see from the instantaneous map of sul facc current shown in l;igure 2, the angle of the CiS separation frc)m the cc)ast of North America near 35%J and 75~ is c]uitc realistic. IIowcvcr, an excessive nun]bcr of colci core rings are found south of the GS. “1’hesc
,1--’.
cold core rings propagate westward, and eventually interact with the GS near the separation point. During such interactions, the GS is pushed to the north of its mean position, leading to the s-light overshoot as seen in Figure 1. Another major improvement of the present simulation is that the simulated GS can be identified as a welldefined meandering jet between Cape Hatteras and the Grand Banks. Figure 3 compares the observed and simulated GS path statistics. lle observed GS position is subjectively determined from two-day satellite images of sea surface temperature during 1983-1986 (Lee and Corni]lon, 1996). ‘I’he simulated GS position is objectively determined based on the maximum gradient of sea surface height every three days during the last ten years of the third experiment. From Figure 3, it is seen that the simulated GS is gcneraily wi’thin the observed envelope. The mean CiS path is remarkably reproduced by the ocean model: the root-mean-square difference bctwccn the ot)served and simulated GS path is 0.44° (on the order of 50 km) computed-over 55 W-800W. The bi.ggcst discrcparlcy for the mean GS path occurs at the trough of the first meander near 680W. The observations show a permanent trough near this longitude. However, the simulated trough appears much deeper than the observations. The standard deviation of the GS ath is relatively small near Cape IIattcras (35!N and 75 h ), 0.33° for observations and 0.52° for the model simulation, suggesting a very stable GS separation there. The standard deviation increases dramatically after the separatiorr point because of the meandering, and remains relatively constant downstream. Averaged over the region 55~-80~, the simulated CiS ath standard deviation is larger than the observed: ().83 rfor observations and 1.14° for the model simulation. I’his large standard deviation in the simulated GS path can bc partly attributed to our path detection algorithms which sometimes cannot distinguish cold/warm core rings from the GS, Figure 4 compares the simulated vertical structure of temperature and velocity with the in situ profile measurements (l Ialkin and Rossby, 1985). Both the data and the model simulation arc analyzed in the ‘(strcaln ccmrdina(e” reference frame, In the model analysis, the origiu of the stream coordinate is co-located with the maximum surface velocity and the downstream direction is dctcrmi[lcd as the direction of the maximum transport between O and 2 km along the ‘73%’ trawscct. The otmrvation is the avera~c of 16 transections ntar 730W during 1980-1983, while the rnodcl simulation is the ave.rage of 16 snapshots from the last ten years simulation during the third experiment. From Figure 4, it is sce.n that the simulated temperature and velocity structure. of the CIS a.grce quite well with observations. The offshore tilt of the thermocline and the maximum velocity core is realistic. The simulated CiS core speed is 125 cm s-l, slig}~tly less than the observed one of 150 cm s“!. 1 ‘rorn the tcmpcrat urc section, it is clear that the mock] does not properly simulate the distribution of 1 g“~ rnodc water at 73*W. l)iscussions
,.
Determining the reasons responsible for the improvements observed in the present simulation compared to previous experiments will require a more systematic exploration of model sensitivity and a more in-depth analysis of the dynamics of the GS region than are possible here. At this point we can only outline the major differences bctwccn the present study and previous experiments and conjecture as to their importance. The horizontal and vertical resolutions used in the present study are the highest among the existing z,coorctinate, eddy-resolving calculations. The initializ.a.tion procedure is also unique in the present study. All the previous eddy-resolving calculations have been initialized with the sohrtions from lower resolution models that already have unrealistic representations of the CTS near the separation point, In contrast, the present calculation was initiali?.cd with the” observed climatological hydrographic structure, and spunup at 1/6° resolution. It appears that a horizontal resolution near 1/6° maybe barely adequate to properly resolve the CN but unable to correct for strongly bi”ased initial conditions within the dccadal time scale of typical eddy-resolving model integrations. The time required for a higher resolution model to correct for the biased initial conditions is presumably shorter (ltlcck et al,, 1995). The apparent sensitivity of the simulation to initialization indicates that the higher resolution and more accurate descriptions of the hydrography of the CiS region (e.g., 1.07.ier et al., 1994) should bc used in future eddy-resolving calculations. The selection of sur-face forcings also affects the. separation characteristics. Certain characteristics pertaining to the cyclonic wind curl distribution in the Western North Atlantic can be related to the separation of the GS; and arc found in the EK34WF operational analysis but not in the long-term climatology. A detailed exposition of the effect of different wind products on the simulated GS separation will be presented in a separate study (Gangopadhyay and Chao, Dynamical inlpact of cYclonic wind stress curl on CIS separation, submitted to I)yn. Atmos. Oceans, 1996). Another new fca(ure in the present study is the presence of the Green land-Iceland-Norwegian Seas and prognostic calculation of the exchanges between thcm and the Atlantic Ocean. Many previous calculations have northern boundaries near the sill in Denmark Strait. The inflow of deep water is crudely pararncterizcd in a buffer 7.oIIc through a rclaxaticm of the solution toward the observed climatological conditions. It has been shown that the solution can bc sensitive to the prescription of the hydrc)sraphic properties in this buffer zone (IXischcr ct al., 1994). It remains to bc studied to what extent the overflow through the l)cnmark Strait is realistically rcprcscntccl in the present study, and what impact this has on the GS behavior. It is not known whether the prescncc of the Western Mediterranean Sea plays any role in simulating the CiS systcrn, though this seems ICSS ]ikcly. The flee-surface forinulation for the barotropic flow and the unsmoothcd bottom topography may also improve the solulion. in summary, a horizontal resolution of at least 1/6° in both lo]l~itudc and latitucic seems to be a necessary con-
dition to obtain a realistic representation of the GS. The. additional factors of finer vertical resolution, unbiased initial conditions, more realistic surface forcings and bottom topography all help to improve the accuracy of the solution, but may only become effective when the minimum horizontal resolution is achieved. Further experiments and more in-depth analysis of the present simulation will bc necessary to determine the relative importance of these factors in obtaining an accurate simulation of the GS system. Conclusions
I
This experiment represents a significant improvement in the simulation of the GS system compared to the previous eddy-resolving calculations, Among many successful features of the simulation, this letter dcscribcs a realistic GS separation from the North American coast near Cape llattcras, energetic meanders of the CIS bc.twcen Cape Hatteras and the Grand Banks, and realistic cross-sectional structure of the GS. The relatively good qualitative agrccmcnt of the present model simulation with observed CTS structure has allowed us to begin to make direct quantitative comparisons with observations. l’hcse quantitative measures of model skill will facilitate. a more meaningful comparison of different cxpcrimcnts and models than has hcretofcm been possible. Our preliminary comparisons have revealed some moclcl deficiencies which can be furt}ler improved. For example, an excessive number of cold-core rings are found south of the GS. The simulation of the subtropical mode watt.r needs to be further examined and improved, Many other aspects of the basin-scale circulation remain to be examined in the present simulation. ldcally it is in~portant to conduct many sensitivity experiments to explore the full range of model parameters, and to investigate the model response to various external forcing,s. Given the improvements found here in simulating the GS system and the continuous increase of computing power, wc bclicvc that basin-scale eddy-resolving ocean models arc finally approaching reality in describing both the time-mean large-scale and transient mcso-scale circulation. Acknowledgments. “l’he research described in this publication was car[-ied out at the Jet 1%-opulsion 1,aboratory (JPL), California Institute of Technology, under a contract with the National Aeronautics and Space Administration. “l’he National Center for Atmospheric Research is sponsored by the National Scicncc l;oundation. Computations were performed on the Cray ‘1’31) computer through the J} ’I, Supcrcomputing ploject. References }lamicr, }1., 1,. Siefridt, 1>, Marchcsicllo, “1’hcrlnal forcing for a global ocean circulation model from a three-year climatology of ECMWF’ analyses, J. Marine System, 6,363, 1995,
.
Bcckmann, A. C., R. Doscher, C. Koberle, J. Willcbrand, Effects of Increased Horizontal Resolution in a Simulation of the North Atlantic Ocean, J. Phys. Oceanogr., 24, 326, 1994.
131cck, R., S. Dean, M. O’Keefe, A. Sawdey, A Compari son of Data-Parallel and Message-Passing Versions of the Miami Isopycnic Coordinate Ocean Model (MICOM), Parallef Computing, 21, 1695, 1995. Bryan, F, ()., C. W. 130ning, W. R. Holland, On the Mid-latitude Circulation in a High Resolution Model of the North Atlantic, J. Phys. Oceanogr., 25, 289, 1995. Doschcr, R,, C. W. Boning, P. Herman, Response of Circulation and Heat Transport in the North Atlantic. to Changes in ‘Ilcrmohalinc Forcing in Northern 1.atiturtcs: A Model Study, J. Phys. Oceanogr., 24, 2306, 1994. Ihkowicz, J. K,, and R. D. Smith, Implicit Free-Surface Method for the Bryan-Cox-Scnm~er Ocean Model, J. Gcophys. Res., 99, 7991, 1994. ]Ialkin, D,, and T. Rossby, The Structure and Transport of the Gulf Stream at 73%, J. Phys. Oceanogr., 15, 1439, 1985.
IIan, Y. J., A Numerical World Ocean General Circulation Model, Part 11: A Baroclinic Hxperimcnt, I)yII. Atmos. Oceans, 8, 141, 1984. }Iellerman, S., and M. Rosenstein, Norlnal monthly wi~ld s~rcss over the world ocean with er[ or estimates, J. I’hys. Ocemogr., 13, 1093, 1983. I m. 3’., and P. Corni]lon, Propagation and Growth of
Gulf Stream Meanders between 75° and 45~, J. I’hys. Oceanogr., 26, 225, 1996.
)
1,evitus, S., Clima[ological Atlas of the World Ocean, NOAA Prof. Pap. 13, 173pp, Silver Spring l MD, 1982, 1.ozicr, M, S., M. S. McCartney, and W. It. Owens, Anomalous Anomalies in Averaged Hydrographic I)ata, J. Phys. Ocearjogr., 24, 2624, 1994. McWillianls, J. C., Modeling the Ocean General Circulation, Arm. Rev. Ffuid Meek, 28,215, 1996. Scmtrwr, A. J., Modeling Ocean Circulation, Science, 269, 1379, 1995. Yi ~hao and Avijit Gangopadhyay, Jet Propulsion 1,aboratory, 4800 Oak Grove Dr., Pasadena, CA 91109 (c-mail:
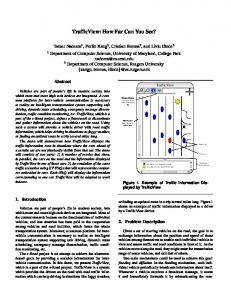
[email protected]. nasa.gov) l:rank C). Bryan and William R. IIolland, NCAR, P. O. Ilox 300Q, Itouldcr, CO S0307 (Rcceivcd July 2, 1996; revised August 19, 1996; accepted September 5, 1996.) lJct Pro~ul sion I ~aboratory ‘Nationa] Center for Atmospheric Research lrigutc 1. Climatological annual-mean maps of (top) sea surface height and (bottom) surface current simulated by the. l)rcsent model averaged over the last ten years of the thircl cxpcri[nent. ‘I?]e contour interval is 10 cm.
7 Figure 2. Instantaneous map of surface current sinmlated by the present model on October 18 of year 16.
Figure 3. The observed and simulated Gulf Stream path statistics. The black solid line represent the observed mean path, and the black dot lines represent the observed envelope. The red solid line represents the mean path derived from the present model. Ile corresponding standard deviations of the Gulf Stream path are also shown. Figure 4. The observed (a and b) and simulated (c and d) temperature and downstream velocity calculated in the stream coordinate system. The contour interval is 1°C for tetnperaturc, 10 cm s- * for velocity less than 100 cm s-l and 25 cm S-l otherwise; CIIAO ET AI,,: MODELING TH[; GUI.F STRIiAM CHAO I~T AI;.: MODE I,lNG THE GUI+’ STREAM C21A0 ET Al ,.: MODE1 ,ING TIIE GU1,F Sl”R!iAM I
Figure l. Clinlatological annual-mean maps of (top) sca surface height and (bottom) surface cur[ent simulated by the present model averaged over the last ten years of the third experiment. l’hc contour interval is 10 cm.
I
ltigurw 2. instantaneous map of surface currmrt simulated by the present model on October 18 of year 16.
Figure 3. I’hc observed and simulated Gulf Stream path statistics. I’hc black solid line represent the observed mean path, and the black dot lines represent the observe@ crivclope. The red solid line represents the xnean path derived from [he present model. The corrcspondin~ standarcl deviations of the C]ulf Stream path arc also shown. l’igure 4. T’he observed (a and b) and simulated (c and d) temperature and downstream velocity calculated in the stream coordinate system. The contour interval is 1°C for temperature, 10 cm s-’ for velocity less than 100 cm S-l and 25 cm S-l otherwise.
Sea I.evel (Ammil-MeaII) ........................... - ___ ---T ~~ 50 c .z=~ * / 1 \=r~. ‘--” ‘ -z 45[ . //-..--&- .:/ . . . . .
-80
-75
-70
Surface Current
-80
-75
-65
-60
-55
(AIIIIII~l-Mc[iII)
-65 -70 -60 longitude (W)
-55
Surface ~,. . . . ... .—. . . . . . . .
-80
-75
-70
. . . . . . . . . .. —.—. -,,
-65
I. Ongitudc (W)
-60
-55
30
k- ;0
\
Slllll]l,,l.,1
4 \
OLISCI VA 1 [Iv,l(l[x ,,, ,,, ,,, ,, ,,, ,,, ,,, ,
-75
-70
-65
1 ON(; l’I’LJI)}: (Vv’)
-60
1
-55
,,,
0
4,,
,,.
,,.
:\!j~ V pj
J2
400
125
cry
e c’
\ -
.100 ~ 800 ] ~~()
i 600
~, ‘I (() i.. -=-. 2000, 1 , .1,,,,,,,, -N) -.10 () ’10 X() I 20 [)ls(.l[l, t’ (L[lll
- 8 0 - 4 0 ( ) .10 80 120 l)!