Department of Biology, University of Miami, PO Box 249118, Coral Gables, Florida. 33124 ... A model is proposed for the population dynamics of an annual plant ...
Acta Biotheoretica 43: 53~5, 1995. 9 1995 KluwerAcademic Publishers. Printed in the Netherlands.
MODELING THE POPULATION DYNAMICS OF ANNUAL PLANTS WITH SEED BANK AND DENSITY DEPENDENT EFFECTS
Marc Jarry1, Mohamed Khaladi 2, Martine Hossaert-McKey 3'4 and Doyle McKey 4 1. D6partement de Math6matiques Appliqu6es, URA CNRS 1204, IPRA, Universit6 de Pau et des Pays de l'Adour, 64000 Pau, France. 2. D~partement de Math6matiques, Universit6 Cadi Ayyad, Marrakech, Maroc. 3. Centre d'Ecologie Fonctiormelle et Evolutive, CNRS, Route de Mende BP 5051, 34033 Montpellier Cedex, France. 4. Department of Biology, University of Miami, PO Box 249118, Coral Gables, Florida 33124, USA.
ABSTRACT A model is proposed for the population dynamics of an annual plant (Sesbania vesicaria) with a seed bank (i.e. in which a proportion of seeds remain dormant for at least one year). A simple linear matrix model is deduced from the life cycle graph. The dominant eigenvalue of the projection matrix is estimated from demographic parameters derived from field studies. The estimated values for population growth rate (L) indicates that the study population should be experiencing a rapid exponential increase, but this was not the case in our population. The addition of density dependent effects on seedling survivorship and adult fecundity, effects for which field studies provide evidence, considerably improves our model. Depending on the demographic parameters, the model leads to stable equilibrium, oscillations, or chaos. Study of the behaviour of this model in the parameter space shows that the existence of a seed bank allows higher among-year variation of adult fecundity, without leaving the region of demographic stability. Field data obtained over 3 years confirm this prediction.
1. I N T R O D U C T I O N The influence of age structure on the demographic and genetic characteristics of a population is now very well recognized (Charlesworth, 1980). Age structure is evident for iteroparous species, but can also be very important for semelparous annual species where some proportion of the individuals may have their life cycle interrupted at a particular stage.
54 As a consequence, adult populations of such annual species are not homogeneous in age and are composed of individuals of different generations. Examples are prolonged diapause in insects (see Ushatinskaya, 1984; Hanski, 1988), or seed dormancy in annual plant species (Baskin & Baskin, 1989). In plant populations, such an interruption in the life cycle usually involves seeds remaining dormant in soil, producing what has been described as a 'seed bank' (Harper, 1977). The widespread occurrence of seed banks in natural communities has many implications for population-dynamic and genetic studies and for management of plant populations. These implications are reviewed in the recent book by Leck, Parker, and Simpson (1989). From the theoretical standpoint, one of the main advantages of such seed banks is that they enable maintenance of populations in unstable environments (Cohen, 1966). Some unpredictable events (such as drought, or fire) can totally eliminate a population at its juvenile stage or before seed maturation of adult plants. If a seed bank is maintained the population can start again/n situ. Moreover, such catastrophic events can even promote seed germination, as shown after heathland fires for Ulex nanus (gorse) (Hossaert, 1981). Models have been made to examine the influence of the seed bank on population dynamics and genetic structure of annual species (Cohen, 1966; MacDonald & Watkinson, 1981; Schmidt & Lawlor, 1983; Bulmer, 1984; Le6n 1985; Ellner 1987; Venable, 1989; Kalisz & McPeek, 1992). Though the heuristic value of these models is unquestionable, most are difficult to test with field data, which in any case are rather rare (but see Kalisz, 1991 and Kalisz & McPeek, 1992). The model we present here is based on field experiments conducted on an annual legume, Sesbania vesicaria (Jacq.) Ell. (Leguminosae, Papilionoideae). This model focuses essentially on the influence of the seed bank and of density dependent effects on plant population dynamics.
2. B I O L O G Y A N D L I F E C Y C L E O F S. V E S I C A R I A Sesbania vesicaria is an annual legume found as a weed in pastures on damp or low sandy soils of the warm temperate region of the southeastern U.S. (Marshall, 1986). This species grows in dense patches. Seedling emergence occurs in March-April, flowering occurs in August and seed maturation takes place in October-November. The seeds are produced in papery pods (ca. 4 cm long). Each pod contains one or two seeds of about 200 mg. When mature, the papery pods simply open and seeds fall by gravity. In the study site (southeastern Texas, USA), the growth of this annual species can be very spectacular, with some individuals that, in 4 months, were 3m high and produced 250 seeds. The normal height of an adult of this species varies between 50 to 300 cm, and a plant may produce 0 to 400 seeds. After fruiting, all plants dry and die in winter. In our study site in southeastern Texas, preliminary observations have shown large numbers of seeds buried in soils at depths between 0 to 10 cm (from 200 to 600 seeds per square meter, Hossaert-McKey & McKey, 1992). Seeds removed from the soil are highly viable (90% viable using a tetrazolium test). Experiments performed on seeds kept for eleven years have shown that seed germination is not affected by the age of the seed (Hossaert-McKey & McKey, 1992). Mortality of juvenile individuals prior to seedling emergence may be high, certainly due
55
to a 'dumping off' disease, particularly during more humid springs when high soil moisture favours fungal activity (Hossaert-McKey & McKey, 1992). This mortality was difficult to observe because it happens just before seedling emergence under the soil surface. For this reason, in this paper we will always distinguish between seed germination and seedling emergence.
3. F I E L D E X P E R I M E N T S
AND DEMOGRAPHIC
PARAMETERS
Field observations and experiments were performed in 1989, 1990 and 1991 in Edna (Texas, USA, 28"58'N, 96"38'W; 20 m altitude) in a permanent pasture on the coastal plain. Sesbania vesicaria grows mixed with grasses and is the most common dicotyledonous plant in the site. The study site is subjected to irregular mowing but not to fire or other disturbance. Subsoils in the site are clay rich and poorly drained, leading to occasional flooding. In permanent plots of one meter square (7 plots in 1989, 10 in 1990 and 1991), each emerged seedling was marked and followed regularly during its life cycle. For each juvenile plant was recorded 1) its survivorship (s) through the adult stage, and 2) adult fecundity (f), estimated by the number of mature seeds produced. Plant density per m 2 (d) was also followed for each plot and through time. Mean values obtained for these three parameters are presented for each year in Table 1. The size of the seed bank was estimated in three permanent quadrats of one meter square, and followed each year before and after seed production and seed germination. The soils were manually excavated in four different layers: surface litter, 0 - 2.5 cm, 2.5 - 5 crn, and 5 - 10 cm. Seeds were collected by sifting each layer of sandy soil through a metal screen of 3 mm mesh. The dormancy rate of seeds in the seed bank (a) - i.e. the fraction of seed bank seeds that remain in the seed bank from one year to the next - was difficult to estimate since some seeds were imported into the study quadrat after flooding. For this reason, seeds of each quadrat were marked with permanent ink to detect imported seeds and obtain a better estimate of seed dormancy rate in soil. Another estimation of seed dormancy was conducted in artificial cages or bags planted in soils (about 2 cm deep) in autumn. At the end of the spring, these bags or cages were dug out and seed disappearance, which included both seed mortality and seed germination, was recorded. Due to technical difficulties, the only data available are for 1991. In this year,
Table 1. Mean values (+_ standard error of the mean) for some demographic parameters obtained in one population of S. vesicaria (Edna, Texas). Sample size (number of quadrats for estimates of seedling density; number of seedlings for seedling survivorship; number of adult plants for adult fecundity) is given in parentheses. Year
Seedling density (d)
Seedling survivorship through adult stage (s)
Adult fecundity (f), (individual seed production)
1989 1990 1991
39.59 • 14.08 (7) 25.10 • 4.77 (10) 15.00 • 2.60 (113)
0.30 • 0.03 (277) 0.61 • 0.03 (251) 0.81 • 0.03 (150)
2.36 • 0.48 (83) 12.90 • 0.92 (154) 10.70 • 0.98 (120)
56 a
12
a 22
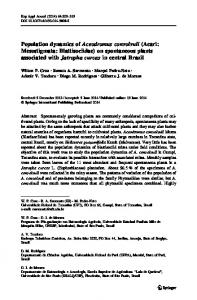
a2l Fig. 1. Life cycle graph for Sesbania vesicaria. The time scale is the year. Each stage is estimated in the fall, before seed rain. The seeds that germinate during the year following their production were not included in the seed bank. all: probability that a seed bank seed remains dormant; a12: number of seeds produced, per adult, that enter the seed bank; a21: probability for a seed bank seed to survive to the adult stage; a22: number of seeds produced, per adult, that germinate directly the following year and become adults. for 453 marked seeds in the seed bank plots, dormancy rate of seeds in soil was a = 0.78 • 0.02 (frequency • standard error), but with a range of 0.50 to 0.90 depending on the quadrat. In bags or in cages, the dormancy rate of seeds in soil was of the same magnitude, with a frequency of a = 0.85 • 0.04. Seedling emergence was assessed from other germination tests in experimental cages placed in soil (Hossaert-McKey & McKey, 1992) under different soil moisture conditions. In our experiments, rate of seedling emergence (g) was independent of soil moisture conditions and was on average (n = 400 seeds) of g = 0.66 • 0.02.
4. A S I M P L E M A T R I X
MODEL
The complete life cycle graph for an annual plant with a seed bank can be established by taking into account the specific age of each individual in the population, either as an adult or as a dormant seed. Such a model using an age structured seed bank in a projection matrix analysis (Caswell, 1989) was performed by Kalisz and McPeek (1992) on Collinsia verna. In our field study, the age of the dormant seeds in the seed bank is, as yet, unknown. Thus, in our graph life cycle for S. vesicaria, only two stages are represented: seeds in the seed bank (all ages) and adult plants (Fig. 1). The transition matrix (A) corresponding to the graph in figure 1 is: __(all a12/ A V 21 a22J and the equation of the linear model associated with this matrix is: X(t+l) = A ~ ( O ,
(1)
57 Table 2. Annual population growth rate (ha) in 1989, 1990 and 1991 of the studied population of S.vesicaria, using two different estimations of dormancy rate of seed bank seeds (a). Year
a = 0.78
a = 0.85
1989 1990 1991
0.88 1.92 2.04
0.92 1.63 1.71
where X(t) is a vector whose co-ordinates refer to stage category: xl(t ) -- number of seeds in the seed bank at year t; x2(t) = number of adult plants at year t. In this first simplified model, we used the following assumptions: HI: The demographic parameters of seeds are constant and independent of the age of the seed. In particular, this implies that there are no demographically significant differences between newly produced seeds and old seeds from the seed bank. 112: Once they enter the seed bank, seeds can only remain dormant in the seed bank or germinate. There is no mortality of dormant seeds in the seed bank. With these two simplifying assumptions, the coefficients of the matrix (A) can be determined by the following relations: all = a a12 = af a21 = (1-a)gs a22 = (1-a)gsf The asymptotic behaviour of the model (1) can be deduced from the properties of the eigenvalues of the projection matrix (Perron-Frobenius Theorem, Caswell 1989). These eigenvalues (L1, L-2) are:
L 1 = a + (1-a)gpf, and
X2=0 The eigenvalue ;~1, real, positive and strictly dominant, is the annual growth rate of the population. The values of ~'1 based on the two different estimates of the dormancy rate of the seed bank seeds, are given in Table 2, for the three consecutive years of our study. The estimated values for the population growth rate can vary twofold among years. Moreover, for the two first years of study, the values of L 1 estimated by the model are such that we should expect a rapid exponential increase. But this was not the case in our population: the mean density of adult plants, based on the data presented in Table 1, is respectively 11.88, 15.31 and 12.15 adult plants/m 2 for the year 1989, 1990 et 1991. This obvious departure of the results from the predictions of the first model, along with our field observations, suggest that density dependent effects should be added to the model.
58 5. E F F E C T S
OF DENSITY DEPENDENCE
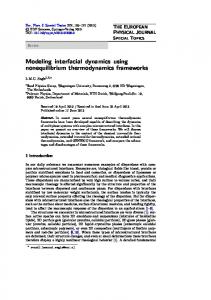
The global estimation of demographic parameters in our population (Table 1) masks some strong effects of seedling density. These density dependent effects are better represented in Figures 2a and 2b, in which survivorship and adult fecundity are plotted against mean density of emerged seedlings per quadrat (lm2). Consider S(d(t)) and F(d(t)) to be respectively the seedling survivorship and adult fecundity functions, d(t) seedling density per m 2, for the year t, and y(t) seed density per m 2 at the beginning of the year (seed bank seeds + seeds newly produced in the fall). Using these new parameters, it is possible to calculate xl(t ) and x2(t ) (respectively, number of seed bank seeds and number of adult plants at year t) by the equations: xl(t ) -- ay(t)
x2(t ) = (1-a)gS(d(t) )y( t) It is also possible to calculate y(t+l) as a function of y(t): y(t+l)
=
xl(t )
+
x2(t)F(d(t))
y(t+l) = y(t)[a+(1-a)gS(d(O)F(d(t)) ]
(2)
Figures 2a and 2b suggest a choice for the corresponding functions S(d(t)) and F(d(t)):
S(d(t)) = [~1 exp (-yld(t)) F(a(t)) = 1~2exp(-'/2d(t)) with [31, [~2, "(1, Y2, > 0; d(t) = (1-a)gy(t) and 13 = g[~1132 (maximum potential fecundity); y = ('/l+y2)g ('coefficient of density effects'). Equation (2) can be rewritten: y(t+l) = y(t)[a + ( l - a ) [3 exp ( - ( l - a ) Yy(O)I
(3)
Equation (3) is dependent only on parameters a and 13. It is now possible to consider a new variable z(t) = ( l - a ) ~,y(t), and then: z(t+l)
--
z(t)[a+(1-a) p exp (-(z(t)) l
(4)
This system reaches a non trivial fixed point z* = In I~, asymptotically stable if 1 < 1~< exp (2/(1-a)).
(5)
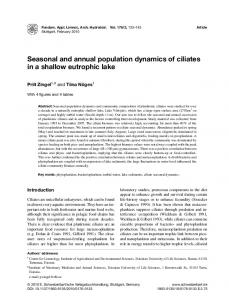
A domain of stability can thus be defined in the parameter space of a and [L The other regions of the parameter space were explored numerically (Fig. 3). A small but complex zone can be observed including periodic and chaotic solutions when a is near zero. For higher values of a, the system passes through domains giving solutions of period 2, 4, 8 .... then passes through chaotic domains with increasing values of the parameter 13. It can be noted that the system passes again precipitously into a domain giving solutions of period 3, then 6 .... before returning to chaos. The bifurcation diagram (Fig. 4) illustrates well this phenomenon, with for example a = 3. Fig. 2, Opposite page. Seedling survivorship (2a) and adult fecundity (2b) as a function of seedling density (per m2) for Sesbania vesicaria (1989-1991; Edna, Texas).
59
Fig. 2a 1
?
0.9 0.8 U
0.7
[] 0
[3
0
O
0.6 []
0.5
[]
9
0.4 0.3 0,2 I
0.1 0
!
I
I
l
I
I
20
40
60
80
100
120
Seedling density (per m =}
Fig. 2b
35
30 1 I
25
20 DO ED 9
15 9 9
[3
9
10
[] E~
O
ii ~
O-F 0
II
I
I
I
20
40
60
=
I
I
80
1 O0
Seedling density (per m =)
I
_
_
_
t 120
60 "
500
/
'-
400'
300'
B 200,
100'
a
ble a
1
'.~
o
:~
'3 9
a
'.4
:~
:~
.7
Fig. 3. Behaviour of the model presented in equation (4) in the parameter space of a and 13. The value k indicates the period of the solutions: for k>8, the regime is essentially chaotic, though with fine domains where k=5 or k=7 which cannot be shown at the scale of this figure.
58
~g
,~s .. ,. , , ~ . 9~,.~ ..'.-~;~~:"-2