MODELLING OF CHLORIDE TRANSPORT IN CONCRETE. BY CELLULAR AUTOMATA. Jan Podrouzek, Bretislav Teplý*. The paper presents cellular automata ...
Engineering MECHANICS, Vol. 15, 2008, No. 3, p. 213–222
213
MODELLING OF CHLORIDE TRANSPORT IN CONCRETE BY CELLULAR AUTOMATA Jan Podrouˇzek, Bˇretislav Tepl´ y* The paper presents cellular automata as a promising modeling approach to simulate the diffusion process as a 2D task. The proposed methodology is applied to the degradation assessment of civil engineering structures describing more realistically the spatial and temporal variability of harmful substance ingress (e.g. chloride ions in concrete). Some illustrative examples are presented together with an example of application to a particular bridge. Key words : cellular automata, diffusion process, chlorides, concrete, bridges
1. Introduction A cellular automaton (CA) is an effective modeling approach to simulate complex systems while avoiding differential equation solutions. A practical application is the modeling of the diffusion process in concrete, thus aiding performance based design methodology and the prediction of service life of reinforced concrete structures. The explicit quantification of the influence of environmental stressors such as de-icing salts in road conditions and others is indispensable while solving some tasks of this category. CA may serve advantageously for such purposes. Concrete is generally effective in protecting embedded steel from corrosion. However, the protective environment is destroyed when the chloride concentration reaches a certain level, the so-called critical level. Therefore, chloride penetration plays an important role in durability, life-cycle and reliability assessment. The problem is acute in the case of bridges and roadways subjected to deicing salt and in a marine environment. Chloride diffusion is a very complicated process where chemical and physical mechanisms should be taken into account [1]. Models for chloride penetration based on the conventional diffusion theory at the macroscopic level are often used (Fick’s second law and the mass conservation law). However, such approaches cannot be easily utilized for practical cases in the building industry due to both the lack of data and theoretical obstacles concerned. Many phenomenological models have been developed to model chloride penetration – all of these models are suggested for use during local degradation modeling related to a particular point (intuitively selected, or a critical one) in the concrete structure. Such models with different levels of exactness may be viewed as 1D models. An overview is provided e.g. by [2]; several models of this category are utilized in the software tool presented in [2]. It should be stressed that 1D models can not be effectively used for solving practical problems of concrete structure degradation and subsequent service life assessment, as the form of the structure (or the form of a cross section) cannot be captured. Also, the environmental action * J. Podrouˇzek, prof. Ing. B. Tepl´ y, CSc., Faculty of Civil Engineering, Brno University of Technology
214
Podrouˇ zek J. et al.: Modelling of Chloride Transport in Concrete by Cellular Automata
(the de-icing salt) on the concrete surface may vary in its dependence on surface/structure orientation, shelter, and the type of road traffic, and it is usually time dependant. Consequently, the response from the concrete material may also vary significantly in space and time. Specifically, from this point of view the CA technique is very effective as the variation in the time and position of salt solution application can be modeled easily; also, the random nature of this process may be modeled. An assessment of chloride concentration is gained in a more relevant way. An alternative to CA is random field exploitation, frequently combined with a Finite Element Method based on fundamental transport and material laws – as an example see [3]. However, such an approach is more involved, input data-demanding and not suitable for everyday practice. Note that a successful application of CA to some other problems concerning concrete material has been presented in [4] regarding the hydration of cement paste. This paper presents the application of a cellular automata approach to the problem of lifetime assessment of concrete structures under diffusive attack from external aggressive agents within the framework of a complex methodology for the reliability assessment of deteriorating concrete structures (particularly bridges). The diffusion process is modeled by cellular automata. This approach can be classified as a more advanced soft computing alternative (spatial 2D approach), which can be recommended before analyzing a critical member. The effectiveness of the methodology is assumed in combination with the nonlinear analysis of concrete structures, i.e. after the assessment of eventual reinforcement degradation due to corrosion caused by the level of chlorides exceeding the critical threshold concentration. Cellular automata can simulate the degradation of material along or across the structure and can describe the spatial and temporal variability of the phenomenon more realistically than other methods. 2. Spatial and temporal simulation of chloride penetration based on cellular automata 2.1. Diffusion equation The simplest model to describe the process of diffusion of chemical components is based on Fick’s law. For the case of single component diffusion in isotropic, homogeneous and time-invariant media it leads to the second order partial differential equation [5], [6] : ∂C = D ∇2 C , ∂t
(1)
where C is the concentration of the diffusion component (at a particular point and a particular time) and D is the diffusivity coefficient of the medium. The diffusivity coefficient for concrete depends on many parameters in addition to the concrete quality, such as relative humidity, temperature and others. The process described by (1) can be effectively threated using cellular automata (a simulation technique); the solution adopted from Biondini et al. ([6] and [7]) and further developed by the first author of the present paper is briefly described in the following paragraphs. 2.2. Cellular automata A cellular automaton (CA) is a special class of evolutionary algorithms, a mathematical idealization of physical systems in which space and time are discrete [8]. In principle,
215
Engineering MECHANICS
any physical system satisfying differential equations may be approximated as a cellular automaton by introducing discrete coordinates and variables, as well as discrete time steps. A cellular automaton consists of a collection of cells on a grid of specified shape that evolves through a number of discrete time steps according to a set of local rules based on the states of neighboring cells. The rules are then applied iteratively for as many time steps as desired. The simulated overall time interval is then the sum of all time steps. The construction is for our purposes represented by a 2D grid of regular uniform cells. Each cell has its own state value which represents the current component concentration (e.g. the chloride ions). The process of chloride ingress is governed by a local rule in which the evolutionary coefficients Φi (i = 1, 2, . . . , 5) assign the level of chloride concentration redistribution within the cell’s neighborhood inside the domain (see Figure 1): X(t+1) = Φ1 Xt + Φ2 Nt + Φ3 Et + Φ4 St + Φ5 Wt ,
(2)
where the discrete variables {Xt , Nt , Et , St , Wt } represent the concentration of the component in the given cell at time t. The values of the evolutionary coefficients Φi must verify the following normality rule : � (3) Φi = 1 as required by the law of mass conservation. Clearly, for isotropic media the symmetry condition Φ2 = Φ3 = Φ4 = Φ5 must be adopted in order to avoid directionality effects. It can be proven that the values Φ1 = 0.5 and Φ2,3,4,5 = 0.125 lead to a very good level of accuracy for the automaton. Note that the local rule’s values {Φi and Nt , Et , St , Wt } presented in (2) and (3) may be treated also as functions in the boundary regions, i.e. in cells outside the domain, as described in the next section. The relationship between the cell size Δx, time step Δt, diffusion coefficient D and chloride evolutionary coefficient Φ1 (governing) is mandatory for the whole grid of cells within a time step: D = Φ1 Δx2 Δt−1 .
(4)
Stochastic effects may be treated as well, modifying the procedure by assuming the evolutionary coefficients Φi to be random values with a given PDF. A standalone software application, CATES, has been developed (the deterministic CATES-D and stochastic CATES-S 2D) application of cellular automata). The application supports the utilization of computational models developed in ATENA 2D non-linear fracture mechanics software [9]. The geometry of the structure may be modeled in ATENA first and afterwards loaded by CATES. At this point a grid of CA is created according to the initial parameters. Note that CATES-D is freely accessible on www.cideas.cz – SW products.
Fig.1: Von Neumann’s neighborhood of a single cell; detail of a grid of uniform cells
216
Podrouˇ zek J. et al.: Modelling of Chloride Transport in Concrete by Cellular Automata
2.3. Boundary conditions The behavior of a cellular automaton inside the simulation region (e.g. a cross section of the structural member) is generally governed by the rules described in 2.2. Areas where there is contact with the outer environment (or activation locations) require special modification of the transitional formula in order to describe the interface mechanisms more realistically, and to actually prescribe environmental action. The properties of these new rules depend on the nature of the simulated action. By means of the boundary conditions it is thus possible to regulate the effects of external action; in the case of chloride ions it is possible to distinguish these two basic concepts : (i) chlorides can not leave the construction once they have entered, so they keep on accumulating inside the construction regardless of the actual concentration gradient, or, (ii) chlorides may leave the construction, which takes account of the actual concentration gradient (e.g. the rain washout effect). For the simulated phenomenon it is possible to create an arbitrary and complex system of boundary conditions, which may be functions of time, space, or state value, or may depend on the type of boundary cells used. Several types of boundary cells have been defined and implemented within the CA research project; some of them are applied in this paper. Three basic approaches to interface handling with numerical representation are presented in Fig. 2 : (a) a grid of 9 cells in a given state, where the sum of the values within the grid is equal to 13 (lets denote it Σ13), changes into a successive state according to different boundary transitional formulas with no external action considered. This means that the external environment should have no effect on the chloride redistribution within the grid, i.e. the sum of the state values (Cl− concentrations) should be constant and equal to 13. This condition approximately satisfies the concept where the evolutionary coefficients (for a given cell) are modified according to the number of valid cells within X neighborhood – case (b) in this figure (Σ12). The standard approach (c) described in 2.2 leads to a sum of state values equal to 9.5. The mirror neighborhood approach (d) satisfies the condition of there being no external action precisely by substituting the passive boundary cells for their mirror image within the standard neighborhood. This approach is suitable for comparison with analytical 1D models (3.1). 5 5
1
1
1
1
1
1
1
1
3 1.7 1 1.7 1 1
1
2.8 1.4 0.8
5
1
1.4 1 0.9
1
1
0.8 0.9 0.8
1
1
1
4 1.5 1 1.5 1
1
1
1 1
1
1
1
1
1
1
Fig.2: Comparison of total concentrations using three types of boundary conditions, from left : (a) Σ13 original state; (b) Σ12 evolutionary coefficient modification; (c) Σ9.5 standard approach; (d) Σ13 mirror neighborhood rule
3. Illustrations of different features of CA 3.1. Comparison to 1D model In the case of comparison to the 1D model the aim is to configure a CA that simulates 1D behavior thus enabling comparison with the broadly accepted 1D material point model. To achieve this, it was useful to create such a configuration of CA that the component con-
Engineering MECHANICS
217
centration at a certain point at a certain time was affected only by the propagation from one direction without considering the gain/loss of the component from other directions. This demand would satisfy an infinitely large simulation area (cross section) or a special modification of the boundary rules, which would simulate the coverage of an infinite simulation area. The 1D model was adopted from Papadakis using the FREET-D tool [2]; the particular variables were: the initial Cl− concentration on the surface CS,0 = 154 [mol/m3]; the diffusion coefficient D = 5.26×10⁻¹³ [m2 /s]; the depth of point a = 30 mm and ti = 30 years. The results gained by the 1D model and CATES proved to be practically identical. 3.2. Seasonal deicing salt application This example simulates the seasonal effect of de-icing salt application – a frequent real situation. It is presumed that the salt feed occurs periodically for 22 years in the winter season. Fig. 3 illustrates a detail of such a time dependency schematic. Fig. 4 shows the different levels of chloride ion concentration at certain depths caused by periodic salt application. It is not surprising that the time fluctuation of chloride concentration is more obvious near the propagation surface and becomes less apparent with the depth within the specimen. It is also worth noting that the transport effect proceeds continually, even if there is currently no chloride feed, e.g. during the summer. Clearly, the CA technique is more powerful compared to analytical 1D models.
Fig.3: A schematic of seasonal salt application on the surface
Fig.4: The effect of seasonal de-icing salt application at different depths within concrete; concentration on the surface (external salt feed) is multiplied by 0.1
218
Podrouˇ zek J. et al.: Modelling of Chloride Transport in Concrete by Cellular Automata
3.3. Stochastic effects The diffusion process itself as well as structural material parameters always exhibit stochastic effects in nature. In this section stochastic behavior is implemented in the CA simulation on the microscopic level by assuming the evolutionary coefficients Φ to be constructed according to formula (5) where Ψ is a random quantity with a given probability density distribution and a mean value equal to zero. Φrand = (1 + Ψ) Φ .
(5)
Let’s remember that the evolutionary coefficients determine the redistribution of diffusion components within a defined neighborhood. As the evolutionary coefficients are no longer deterministic quantities, some directionality effects may be expected on the microscopic level. For demonstrative purposes, a simple T cross section with three reinforcing bars, R1, R2 and R3 was selected. The chloride concentration development on the surface of these reinforcing bars was simulated using CATES-S 2D. The results in Fig. 5 represent
Fig.5: Top : Histograms of 1000 realizations : Cl− concentrations on the surface of reinforcing bars R1, R2 and R3 after 30 years of constant exposure; Bottom : Graphical visualization of one particular realization : a T cross section with three reinforcing bars (labeled white cells) as plotted by CATES-S 2D; chloride ingress is represented by the dark tones blending into the light, healthy core
219
Engineering MECHANICS
the state of the cross section after 30 years of constant chloride exposure (chloride ingress along all external surfaces except the upper surface). The lower object in this figure depicts a graphical visualization of one characteristic realization of the simulation with some amount of ‘noise’ due to stochastic effects. The histograms represent the output from 1000 realizations of the simulation. The parameters for the simulation were: cell size 0.0151 m, time step 165 days, diffusion coefficient 2×10⁻¹² m2 /s, and normal distribution of the evolutionary coefficients with Ψ having a mean value of 0 and a standard deviation of 0.5 . The generator of pseudorandom numbers based on the ziggurat method was adopted from [10]. The results gained by this stochastic approach better reflect reality than those from other methods and provide generally more relevant and enhanced data (statistical information on chloride concentration in time and space, or certain confidence limits).
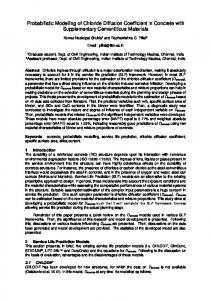
Fig.6: The Neumarkt-Auer bridge
4. Case study : Neumarkt bridge In order to illustrate the practical utilization of CATES-D 2D as introduced above, a specific bridge structure was analyzed. The Neumarkt-Auer bridge, Figure 6, was built in 1969; it is a highway crossover and belongs to the A22 Brenner Motorway AG and is located on the A22 Highway Bozen South – Trient. The Neumarkt-Auer bridge is a three-span reinforced concrete structure composed of four prestressed beams with a V cross section. The main span over the A22 is 27.00 m long, and the lateral fields are 9.05 m long with a vertical dimension of 1.34 m. Bridge inspections have been conducted periodically by personnel
220
Podrouˇ zek J. et al.: Modelling of Chloride Transport in Concrete by Cellular Automata
responsible for the A22 motorway AG. The inspections from 19. 10. 1999 and 14. 12. 1999 showed that there is serious degradation of both the piles and beams in the junctions of the prestressed V beams. These weak zones are mainly caused by insufficient sealing of the pavement in the region of the expansion joints over the piles. Detailed inspections since 1990 have shown serious degradation and corrosion processes in the piles and at the ends of some V beams. The inspections also showed severe longitudinal cracks in the pavement slabs and the V beams due to corrosion of reinforcement triggered by critical chloride concentration in the neighbourhood of reinforcement (application of de-icing salts during winter months). Figure 7 shows the chosen distribution of concentrations and assumed initial distribution (half of the bridge); maximal surface chloride concentration is 2 % Cl− per unit of cement content. Note that the distribution of the initial concentration along the bottom part of the bridge was heuristically estimated from the location of stiffeners and supports (leakage through joints), where higher ‘localized’ degradation was detected. Predictions of chloride concentrations for selected years in the studied part of the bridge are shown in Figures 8 and 9. The lighter tones represent the undamaged state of a cell (22.5 mm cells), while the darker colours represents the degraded state. Black regions symbolize parts where chloride concentrations were above the chloride concentration considered critical (here 0.4 % Cl− per unit of cement content was so considered). Critical chloride concentration was first reached at the age of 5 years (the black lines in the first figure); the jeopardized area shown for 30 years of chloride action corresponds with the photo images (Fig. 6) of the degraded structure, which is of the same age. The utilization of such an approach will enable the engineer to focus on the modelling or prognosis of reinforcement corrosion in the most vulnerable locations and thus will support him/her in decision making concerning the residual service life, rehabilitation and/or further utilization of the bridge. It should be noted that the frequent attaining of certain critical chloride concentrations in concrete is supposed to mark the end of its service life – due to the possible onset of reinforcement corrosion. Another interesting task would be to find the equilibrium state for a given structure with a particular set of conditions when the chloride concentration in the structural core stabilizes on a certain level while the fluctuations remain in the peripheral regions, i.e. after some time a certain amount of chloride feed from winter salt application is washed out in the summer, and has no effect on the annual total Cl− increment (not treated in this paper).
Fig.7: Distribution of initial concentrations of aggressive agents considered in the 2D model
Engineering MECHANICS
221
Fig.8: Predictions of chloride concentration development for 5, 15, 30 and 80 years – detail around the middle supporting pier with the critical concentration region (black); maximal environmental action was considered 2 %; critical concentration 0.4 %
Fig.9: Predictions of chloride concentration development for 40 and 80 years – detail around the middle supporting pier with the critical concentration threshold (black); maximal environmental action was considered 2 %; critical concentration 0.4 %
5. Conclusions The proposed methodology is utilized for the numerical simulation of a diffusion process, namely in the degradation of civil engineering concrete structures due to chloride ion ingress. The authors believe that the technique is promising, especially in the context of describing more realistically the spatial and temporal variability in the concentration of harmful substances in concrete. Apart from the other examples mentioned, the study of the results of de-icing salt application on the Neumarkt-Auer bridge serves as a more complex example of the application of infrastructure service life assessment based on a conservative, albeit often utilized limit : the possible onset of reinforcement corrosion in parts where the critical Cl− concentration is reached. In this way more information is available for decision-making, allowing the consideration also of the consequences in terms of cost.
222
Podrouˇ zek J. et al.: Modelling of Chloride Transport in Concrete by Cellular Automata
Acknowledgement This outcome has been achieved with the financial support of the Ministry of Education, Youth and Sports of the Czech Republic, project No. 1M0579, within the activities of the CIDEAS research centre. References [1] Xi Y., Baˇzant Z.P.: Modeling chloride penetration in saturated concrete, Journal of Materials in Civil Engineering, Vol. 11, No. 1, p. 58–65, 1999 [2] Tepl´ y B., Chrom´ a M., Matesov´ a D., Rovnan´ık, M.: FREET-D Deterioration Module Program ˇ Documentation, Brno/Cervenka Consulting, http://www.freet.cz, 2007 [3] Meijers S.J.H., Bijen J.M., Borst R., Fraaij A.L.A.: Computational modeling of chloride ion transport in reinforced concrete. HERON, Vol. 46, No. 3 (2001), p. 207–216 ˇ [4] Smilauer V., Bittnar Z.: Hydration of cement paste and model CEMHYD3D, Beton TKS 6/2003, p. 32–35 (in Czech) [5] Glicksman M.E.: Diffusion in solids, Wiley, New York, 2000 [6] Biondini F., Bontempi F., Frangopol D.M., Malerba P.G.: Cellular Automata Approach to Durability Analysis of Concrete Structures in Agressive Environments, Journal of Structural Engineering ASCE, Vol. 130, No. 11, pp. 1724–1737, 2004 [7] Biondini F., Frangopol D.M., Malerba P.G.: Time-Variant Structural Performance of the Certosa Cable-stayed Bridge, Strucutral Engineering International, No. 3, 2006 [8] Wolfram S.: Cellular Automata and Complexity – Collected papers, Wolfram Addison-Wesley, 1994 ˇ [9] Cervenka V., Pukl R.: ATENA Program Documentation, Cervenka Consulting, Prague, http://www.cervenka.cz, 2005 [10] Marsaglia G., Tsang W.W.: The Ziggurat Method for Generating Random Variables, Journal of Statistical Software, Vol. 05, Issue 08
Received in editor’s office : may 15, 2008 Approved for publishing : July 8, 2008 Note : The paper is an enlarged version of the contribution presented at conference Non-Traditional Cement & Concrete III, Brno, 2008.