Reduction of periodic noise in Fourier domain optical coherence tomography images by frequency domain filtering Y. Xie1,2 , L. Chen1,2, U. G. Hofmann1,2,3 1. Institute for Signal Processing, University of Luebeck, 23562 Luebeck, Germany,
[email protected] 2. Graduate School for Computing in Medicine and Life Sciences, University of Luebeck, 23562 Luebeck, Germany 3. Neuroelectronic Systems, Department of Neurosurgery, University Medical Center Freiburg, 79106 Freiburg, Germany
Abstract In Fourier domain optical coherence tomography (FDOCT) coherence noise is caused by interference of light waves back-reflected or scattered from different spots within a measuring depth or from optical components within the OCT system such as a bended optical fibre. This coherence noise appears as periodic stripe patterns along the axial direction in resulting images. Background subtraction and physical segmentation are used to degrade the periodic coherence noise in previous studies. Here we utilise a post-processing method by applying a frequency domain filter to reduce the periodic coherence noise. Even though the approach taken is a very simple one, it visibly removes the periodic coherence noise from FDOCT images without influencing the original measured objects. The edges and textures of the objects in the processed image are identical as in the original image. The signal to noise ratio is also enhanced by using frequency domain filtering. Applying frequency domain filtering to FDOCT image can reduce the periodic noise significantly. This method is an easy, efficient way to improve the image quality without calibrating the system or measuring the background noise each time before a measurement.
1
Introduction
Optical Coherence Tomography (OCT) has been first introduce by David Huang in 1991 [1]. Generally it utilises a low coherence light-source and measures the coherence of backscattered light and reference light by the interferometry. Thus objects with different optical properties in the illumination pathway can be detected as interference signal (A-scan signal) in interferometer. A 2D cross-section image can be obtained by the probe light transversal scanning [1]. Since OCT has been widely used in visualizing human retina and cornea in clinical ophthalmology, its application was extended rapidly into biomedical fields [2–4]. Although OCT cross-section images can have a very high resolution up to 1 µm in biological tissue, its essential imaging depth limitation restricts imaging the deep structures within large volume organs [5]. Yet the research highlight is developing an ultra-small fibre-based detecting probe which is capable of minimum invasive endoscopic OCT imaging [6]. Taking the advantage of the small probe dimension, OCT has demonstrated to have the potential to assist in navigating neurosurgery [7]. As the requirement of navigation precision is very high in neurosurgery, any strong noise signal in the navigating image should be avoid. In the concept of OCT, the interference of sample and reference light generates a modulation of the spectrum that is related to structures with different optical properties in the sample. But there are other effects that cause modulation of the spectrum, which may cause artifacts in FDOCT images. These effects include interference of light waves back-reflected or scattered from different spots within a
measuring depth or from optical components within the OCT system such as a bended optical fibre. These artifacts result in a fixed noise pattern in A-scan signal, and periodic strip pattern noise in B-scan images. This noise contribution can be removed by reference spectrum subtraction [8]. However this method needs pre-processing which means precise system calibration and additional reference signal measurement. Usually any periodic and quasiperiodic noise leads to the appearance of peaks in the image spectrum amplitude. We propose in this paper that Fourier domain filtering can be used to remove the periodic noise in FDOCT images. We compare in detail the processed images with the original images.
2
Methods
2.1
Fourier domain filtering for periodic noise reduction
Fourier domain filtering is considered as a simple but effective method in imaging processing. As it is known, the components of a spectrum determine the amplitudes of the sinusoids that combine to form the resulting image. At any given frequency in the DFT spectrum, large amplitude implies greater prominence of a sinusoid of that frequency in the image. Periodic strip noise or chessboard pattern noise is usually represented as high peak in the image spectrum. Applying a certain filter which can block the frequency corresponding to the noise in the Fourier domain will remove the noise in the spatial domain image.
2.2
Processing procedures
The general approach for operating in spatial and frequency domain can be described by the following flow chart (Figure 1). The raw image f(m,n) is multiplied by (1)m+n prior to processing the images. This has the effect of centering the transform since F(0,0) is now located at u=M/2, v=N/2, see following formulas,
f (m, n )e
− j 2π ( u 0 m / M + v 0 n /
)
⇔ F (u − u 0 , v − v 0 )
,1
using u0=M/2, v0=N/2 we can get
e − j 2π (um / M + vn /
)
= e − jπ ( m+ n ) = ( −1) m+ n
F ( f ( m, n)(−1) m + n ) = F (u − M / 2, v −
/ 2)
,2
where M, N are the image dimensions. Then we apply Fourier transform to the resulting image and plot the frequency spectrum F(u,v), Eq. 3. The periodic noise signal always appears as a paired high intensity pattern along the vertical axis in the Fourier domain. Once the noise frequency is defined, a filter S suppressing this frequency is designed. After filtering, the image is inverse transformed to the spatial domain g(m,n), Eq. 4 [9]. M −1
F (u , v ) =
The ROI is a rectangular area and was manually selected outlining a region which contains higher intensity pixels in the OCT image for evaluation of the CNR. As a reference background the region of weaker backscattered signals was chosen. The size of the reference region and the ROI are equivalent.
3
Results
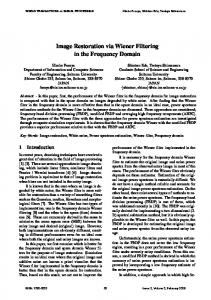
The OCT images show here were obtained from a commercially available spectrometer-based Fourierdomain OCT system (’Callisto’, Thorlabs GmbH, Germany). We tested the algorithm with images of brain areas used in deep brain navigation. Figure 2A is a raw image that corrupted by the periodic noise, figure 2B is the spectrum of the same image after Fourier transform. The frequency of the periodic noise is marked and a filter is designed to suppress the noise, illustrated in figure 2D. The resulting image obtained by computing the inverse transform is shown in figure 2C, the interference noise is not visible while the image textures stay the same.
−1
∑∑
f ( m , n )e − j 2 π ( um / M + vn /
)
,3
m =0 n =0
1 f (m, n) = M
M −1
−1
∑ ∑ F (u , v )e
j 2 π ( um / M + vn /
m =0 n =0
)
,4
Figure 2 (A) Raw image affected by periodic noise. (B) The Fourier spectrum of image A shows a pair of high intensity lines on either side of the center. (C) Filtered image produced by inverse Fourier transformation of the edited frequency domain data. (D) Location mask located in the position corresponding to the periodic noise signal in Fourier spectrum.
Figure 1 General work flow of the processing procedure.
2.3
Evaluating methods
In order to quantitatively evaluate the Fourier domain filtering effects on removing periodic noise from OCT images, contrast-to-noise (CNR) ratio is introduced and used in our study [10][11]. The CNR parameter shows the contrast level between region of interesting (ROI) and the reference area:
C R=
µ ROI − µ BGR 2 2 σ ROI + σ BGR
,5
where µROI and σ2ROI are the mean and variance of pixel intensities in ROI, and µBGR and σ2BGR are the mean and variance of pixel intensities in the reference background.
The CNR (table 1) value is calculated to evaluate the filter efficiency. The ROI and background are selected manually, illustrated as the rectangular frames in figure 3. In all three tested images, the CNR value increases significantly after the filter is applied. Table 1 CNR value of raw images and filtered images
CNR Image 1 Image 2 Image 3
Raw image 13.76 17.40 10.27
Filtered image 124.52 37.06 43.86
Image 1 denotes Figure 2 A (raw), C (filtered); Image 2 denotes Figure 3 A1 (raw), B1 (filtered); Image 3 denotes Figure 3 A2 (raw), B2 (filtered).
raw images, the periodic strip pattern noise was removed, while the image texture and edges remained untouched. The contrast to noise ratio (CNR) of processed images increased admittedly. Without this fixed pattern interference noise, the processed images became more reliable. Thus we conclude here that Fourier domain filtering is a low cost effective postprocessing method for periodic noise reduction.
5
References
[1] D. Huang et al., “Optical Coherence Tomography,” Science, vol. 254, pp. 1178-1181, 1991.
Figure 3 (A1) and (A2) are raw OCT images from different biological samples, (B1) and (B2) are the images after Fourier domain filtering.
As the OCT images used in this study are reconstructed from several 1D A-scans (light backscattered signal), the quality of individual A-scan after filtering operation is an important criterion to evaluate the process. Figure 4 right panels are the profile plots of the left images in the position where the red line locating respectively. The filter suppresses small spikes in the original plot and makes the filtered curve appear smoother (see Figure 4A,B right panels). The light backscattering intensity (y-axis value) remains at the same level around 80 dB before and after processing.
[2] M. R. Hee et al., “Optical Coherence Tomography of the Human Retina,” Arch Ophthalmol., vol. 113, pp. 325-332, 1995. [3] W. Drexler et al., “In vivo ultrahigh-resolution optical coherence tomography,” Opt. Lett., vol. 24, no. 17, pp. 1221-1223, 1999. [4] J. G. Fujimoto, “Optical coherence tomography for ultrahigh resolution in vivo imaging.,” ature biotechnology, vol. 21, no. 11, pp. 1361-7, Nov. 2003. [5] S. a Boppart, J. Herrmann, C. Pitris, D. L. Stamper, M. E. Brezinski, and J. G. Fujimoto, “High-resolution optical coherence tomography-guided laser ablation of surgical tissue.,” The Journal of surgical research, vol. 82, no. 2, pp. 275-84, Apr. 1999. [6] Y. Mao, S. Chang, S. Sherif, and C. Flueraru, “Graded-index fiber lens proposed for ultrasmall probes used in biomedical imaging.,” Applied optics, vol. 46, no. 23, pp. 5887-94, Aug. 2007. [7] Y. Xie, T. Bonin, S. Loeffler, G. Huettmann, V. Tronnier, and U. G. Hofmann, “Fiber spectral domain optical coherence tomography for in vivo rat brain imaging,” in Biophotonics: Photonic Solutions for Better Health Care II., 2010, p. 77152F-77152F-9. [8] N. A. Nassif et al., “In vivo high-resolution video-rate spectral-domain optical coherence tomography of the human retina and optic nerve Abstract :,” vol. 12, no. 3, pp. 367-376, 2004. [9] R. C. González and R. E. Woods, Digital Image Processing. Pearson/Prentice Hall, 2008.
Figure 4 Panel A (right) and panel B (right) give the profile plots of image A (left) and B (left) at the position indicated by a red line, respectively. The red circles on the profile plots illustrate the improvements in detail.
4
Conclusions
A problem of reducing periodic noise in FDOCT images is discussed here. We used Fourier domain filtering as a simple method to reduce noise. After applying the filter to the
[10] A. Sakalauskas, A. Lukoševič ius, K. Lauč kaitė , D. Jegelevi č ius, and S. Rutkauskas, “ Automated segmentation of transcranial sonographic images in the diagnostics of Parkinson’s disease.,” Ultrasonics, Apr. 2012. [11] S. Finn, M. Glavin, and E. Jones, “Echocardiographic speckle reduction comparison,” IEEE Transactions on Ultrasonics, Ferroelectrics and Frequency Control, vol. 58, no. 1, pp. 82-101, 2011.