MOLDING THE PIPELINE INTO A LOOP: THE PARTICIPATORY PROCESS OF DEVELOPING AGROCLIMATE, A DECISION SUPPORT SYSTEM FOR CLIMATE RISK REDUCTION IN AGRICULTURE Norman E. Breuer Rosenstiel School of Marine and Atmospheric Science University of Miami
Clyde W. Fraisse Department of Agricultural and Biological Engineering University of Florida
Peter E. Hildebrand Dept. of Food and Resources Economics, University of Florida
2009 Journal of Service Climatology Volume 3, Number 1, Pages 1-12 A Refereed Journal of the American Association of State Climatologists
Molding the pipeline into a loop: the participatory process of developing AgroClimate, a decision support system for climate risk reduction in agriculture Norman E. Breuer Rosenstiel School of Marine and Atmospheric Science University of Miami
Clyde W. Fraisse Department of Agricultural and Biological Engineering University of Florida
Peter E. Hildebrand Department of Food and Resources Economics University of Florida Corresponding author: Norman E. Breuer, Rosenstiel School of Marine and Atmospheric Science, University of Miami, 4600 Rickenbacker CSWY, Miami, FL 33149-1098, USA. Tel. 1-352-392-1864 ext. 180,
[email protected].
Abstract We used a participatory approach for research, development, and dissemination of AgroClimate, a decision support system for climate risk reduction in agriculture. Feedback from stakeholders and dissemination of climate forecast technology were simultaneous outputs from interactions with potential end users. We describe the research and development process, including the use of Sondeos (a semistructured, multidisciplinary team discussion process), focus groups, semi-structured interviews, websurveys, on-line feedback and participation at farmer association meetings. Quality and quantity of feedback, cost, number of activities, and numbers of stakeholders reached were scaled for analysis. Radar diagrams were used to characterize the several research participatory methodologies used. Results showed that all methods were useful. The greatest quantity of feedback was obtained through Sondeos, interviews, and a web survey. The greatest quality of feedback came from the web survey, workshops, interviews and Sondeos. Dissemination of climate forecast technology and applications available on AgroClimate were greatest at farmer association meetings and lowest at workshops. All methods mentioned are appropriate loci for two-way translational science to occur. While disseminating climate information, feedback and new ideas from potential end users are obtained. Thus AgroClimate and many of the tools within it may be thought of as having been co-developed by scientists and stakeholders. Key Words: Climate variability, risk reduction, participatory methods, decision support system, translational science, Sondeos, Southeast Climate Consortium, Regional Integrated Sciences and Assessment
Breuer, N. E. et al. 2009. Journal of Service Climatology. www.journalofserviceclimatology.org
1
1. Introduction In a pivotal 1997 article, Roger Pielke, Jr. discusses the public and governmental sectors’ growing concerns for publicly funded research to respond to societal needs. The author poses this fundamental question to the atmospheric sciences community: Of what use to society is atmospheric sciences research? In this article we present a methodological process for scientific research, development, and dissemination among multiple stakeholders (including potential end-users and a climate research and extension consortium), as an approach to responding to societal needs for climate information. We use qualitative and quantitative data to estimate stakeholder input into a climate forecast-based decision support system for risk reduction in agriculture (AgroClimate). We then discuss whether the research and development (R&D) of the AgroClimate decision support system is of practical use to society, and how useful societal input has been to the R&D of the AgroClimate. The issue of simultaneous dissemination during participatory sessions is also analyzed. Conceptually, the research question is: are we actually bending the “pipeline” scienceapplications paradigm into a multi-feedback loop with societal stakeholders? In other words, are we doing the right science? This question was posed by Lightfoot (2003) in a Farming Systems context. Lightfoot argues that assessment must go beyond the “good science/bad science” qualification and determine if one is doing the “right science.” Getting to the “right” research means not only finding the “right” research question, but also the “right” research partnerships among farmers, service providers (i.e., extension services), and other relevant stakeholders. Doing the “right” research means finding a more participatory and consensual way to make decisions about the directions of the research. Having our R&D of climate forecast products emerge from stakeholders’ needs and preferences would fulfill this goal of “right” science both in the eyes of funding agencies and society in general. We begin with one of many concepttualizations of “the technological transfer pipeline.” Gerber’s (2005) description is particularly poignant. He notes: “The linear research and development system is organized sequentially such that knowledge comes from new ideas generated by basic research. The new knowledge is published and thus available to applied researchers, who may be in contact with extension educators, who transfer the information to users as a technology or practice through publica-tions, meetings, or maybe today by e-mail. This conceptual model assumes
research to be a discipline-oriented function, where the goals of the inquiry process are identified and evaluated in the context of the discipline. This is not bad, if that is our intent. However, if the system is meant to serve societal interests, this disciplinary orientation creates a weak link in the chain from research to application, thus jeopardizing the potential applicability of the new knowledge. In this model, it is difficult for knowledge-users to comment on the original ideas until they are a finished product. Therefore implementa-tion of new ideas as a practice or product is left to chance, not design” (Gerber 2005). Within our R&D every interaction with stakeholders serves as an occasion to disseminate AgroClimate. We analyze how different participatory interaction approaches have affected the design and implementation of the AgroClimate, decision support system while simultaneously measuring how this interface with target audiences has contributed to technology dissemination. In this paper, we refer to producers (farmers) and extension agents as potential end users. “Stakeholders” refers to potential end users, SECC researchers, government agencies, advisory boards, and nonprofit organizations involved in agriculture. Inputs and outputs from these interactions are referred to as “translational science.” AgroClimate is an interactive web portal designed to present climate information, potential adaptations, and to receive feedback from users. Decision support systems (DSS) are means of conveying information to decision makers. One step in translating this ability to forecast climate variability into societal benefit is through research and development of a climate information-based decision support system (found at www.AgroClimate.org). The purpose of AgroClimate is to provide climate and climate-based information for stakeholders and final users, who can plan management strategies for different climatic conditions six to nine months in advance. Climate predictions such as those provided by the SECC through AgroClimate can be used to reduce risk and to increase potential gains among end users. Risk is caused by uncertainty due to a lack of information. Information needed to reduce uncertainty must be timely, accurate, and credible. (Yohe and Tol 2002).
2. Background: Decision Support Systems New understandings of climate variability that affect agricultural and natural resources permit probabilistic forecasting of precipitation and temperature shifts six to nine months into the
Breuer, N. E. et al. 2009. Journal of Service Climatology. www.journalofserviceclimatology.org
2
future. This is especially true for climate variability caused by El Niño - Southern Oscillation (ENSO) (Hansen et al. 1998; Hansen 2002; Jagtap et al. 2002; O’Brien et al. 1999). ENSO also affects the frequency of natural extreme events such as hurricanes, wildfires, and damaging freezes. The purpose of the AgroClimate decision support system is to provide climate and crop yield information based on seasonal to interannual forecasts so that extension agents and farmers can strategically plan management strategies for different climatic conditions, predicted with six to nine month lead time. The research and development of such a climate information-based decision support system is the first step toward highlighting the social benefit of this suite of applications. 2.1. Social Science, Technology Development, and Dissemination We shift the flow of information from linear research (research station to farmer), toward a more circular interchange (Chambers 1994, 1995). The need for intensive and effective participation of all stakeholders was identified by several researchers (Ashby et al. 2002; Lynam et al. 2002; Stoorvogel et al. 2004). The SECC uses stakeholder interaction methodologies or participatory action research that was originally developed for use in international rural development. The intent is to first gauge the need for a climate-based DSS, then to elicit input to guide and direct research. Under this model working with stakeholders in a co-learning process involves as many feedback loops as necessary to increase the quality of tools and the probability of higher adoption. The Panel on the Human Dimension of Seasonal-to-Interannual Climate Variability of the National Research Council called for diversity and flexibility of approaches to climate forecasts, including surveys, qualitative methods, structured discussion, and participatory experiments (Stern and Easterling 1999). These authors suggest that participatory approaches should include research that involves some degree of interaction between farmers and scientists. Farmer participation and workshops have served to identify information needs as well as provide feedback on the decision support tools and technologies developed by research (Jones et al. 2000; Hammer et al. 2000; Podestá et al. 2002; Ritchie et al. 2004). Decision support tools are not intended to make decisions for farmers. These systems should support their abilities to explore different options and choose solutions (Meinke et al. 2001; Podestá et al. 2002). The SECC worked with the Cooperative Extension Services in Florida and Georgia, which has the expertise to develop and deliver information gleaned from AgroClimate for a diverse group of users, particular to each
county or district. Stakeholder interaction also has implications for technology diffusion and adoption (Figures 1 and 2). 1. The traditional DSS pipeline development model
2. Reshaping
3. The SECC multiFeedback Loop model
Workshops Survey
Prototype
Farmers Extensión Research AgClimate DSS
Interviews
On-line user feedback
Association Meetings
Focus Group
Sondeo
Figure 1. Researchers, Farmers, Extension Agents, and the AgroClimate DSS
2.2. Reshaping the pipeline The pipeline approach emphasizes modeling, rational planning, and economic analysis. This is linked to operational research that sought optimal solutions for complex problems (Rosenhead 1989). A dearth of adequate social scientific theories and empirical data hinders the transfer of useful science for societal benefit (Stoorvogel et al. 2004; Jones et al.1997). One of the most efficient ways to gather current, high quality empirical data for science responsive to user needs is through stakeholder interaction (Geurtz and Joldersma 2001; Hildebrand et al. 2003). Though the concept of altering the traditional “pipeline” of the science-applications continuum has become cliché, the reasons to seek this modification continue to exist. Over the past 20 years, systems analysts realized that a thorough understanding of complex problems is often gained during model building. Thus, participation of the target audience or potential end users in the R&D process is useful. The participation of the potential final users enables the researcher to enrich models, tools, and products. This is done by including subjective sources of knowledge (experiential knowledge) and the objective (secondary source) knowledge derived from theories and empirical studies (Geurtz and Vennix 1989; Geurtz and Joldersma 2001). A systems approach at the farm scale must include not only the biophysical component, but also the social, economic, and political environment of the farm together with a ‘bottom up’ approach (Jones et al. 1997). Connectivity
Breuer, N. E. et al. 2009. Journal of Service Climatology. www.journalofserviceclimatology.org
3
DSS R&D Phases 2. Initial Stakeholder Assessment
1. Identification of Problem Characterization of Seasonal Climate Variability
Sondeos
Opportunities
Semi structured
3. DSS Development
Prototype
Risk
Interviews
5. Assessment
Feedback
ACRIS
to Mitigate Impacts on Agriculture
4. Implementation Phase
Agro Climate. org
Stake holders
Adoption? Adaptation? Economics Equity indicators
Upgrade
Figure 2. Flow chart of the steps in research and development of AgroClimate
and dialogue among key players is essential for achieving relevant and significant intervention. Simulation-aided research about crop management has produced advances in farming systems analysis, which is a vehicle for management intervention often aided by a decision support system (McCown et al. 2002; Hammer et al. 2000; Keating and McCown 2001; Nelson et al. 2002). Several studies provide examples of participatory approaches to obtain significant results. These approaches are not about science simply providing the answers for management to practitioners, but rather employing cooperative learning to develop solutions (Meinke et al. 2001; Robertson et al. 2000; Nelson et al. 2000). Direct participatory action research with farmers has helped establish credibility of models, simulation analyses, and the decision support systems into which they are built (Meinke et al. 2001). Software created for farmers, extension agents, and farm consultants should be user friendly and require minimal data inputs. It is not only important that the software deliver what is asked for, but also that it do so quickly and easily, be done in an understandable format, have site specific conditions, and is presented in real time (Archer et al. 2002; Cabrera et al. 2005). Building upon these existing studies, the combination of more or less participatory approaches were and continue to be used by SECC researchers to “bend” the pipeline into the interactive R&D of AgroClimate.
3. Methods 3.1 The Participatory Research and Development Approach The aim of our participatory research plan was to learn from and support agricultural producers’ adaptation to seasonal climate variability. We have done this by translating raw climate forecasts into feasible management adjustment options suggested by the farmers based on their own experience and environments (Agrawala and Broad 2002; Roncoli 2005). These adjusments “tweak” rather than change management. Climate information delivery requires some understanding of its probabilistic nature. Terciles, a common visual display of climate probability, were poorly understood by farmers in South Africa, and considered of little use by cattle ranchers in the southeast US (O’Brien and Leichenko 2000; Breuer et al. 2000). Research shows that farmers’ ability to interpret probability and integrate it into decisions can improve over time (Suarez and Patt 2002; Hansen 2002). Probability distributions and probability of exceedance graphs were preferred by extension agents and farmers in Florida when compared to other graphic renditions of probabilistic forecasts, including terciles (Breuer et al. 2000). Another factor needed for agents and farmers to use AgroClimate is trustworthiness. Trust is a function of the perceived credibility of the source
Breuer, N. E. et al. 2009. Journal of Service Climatology. www.journalofserviceclimatology.org
4
of the information. The levels of uncertainty in forecasts need to be clearly communicated (Nicholls and Kestin 1998; Podestá et al. 2002; Ziervogel and Downing 2003; Ziervogel and Calder 2004; Vedwan et al. 2005). Experience shows that asking farmers to answer hypothetical questions about information they have not received is not effective (Ziervogel and Calder 2004). This was clearly the case when comments and suggestions greatly increased after 2004, when S E C C researchers began to show prototypes of an Internet-based DSS to agents and farmers. Before that year, questions and feedback had been based on a hypothetical web site. A series of participatory methods were used: Sondeos, semi-structured interviews, focus groups, formal web-based surveys, workshops, feedback from users, and participation at farmer commodity meetings (Table 1). Figure 1 represents a comparison of the traditional one-
way science pipeline and the SECC multifeedback loop model. The pipeline at top of Figure 1 represents the traditional pipeline paradigm of scientific research, technology, and dissemination. The approach is “top down” in that ideas are generated at research institutions where they are studied and published in scientific journals. The technological development arising from the research is then “piped out” or delivered to certain stakeholders considered leaders or early adopters. From that point, technology adoption theoretically diffuses to other users (Rogers 1995). The lower portion of the figure shows research and applications as a continuous loop. Ideas are gathered from potential end users and other stakeholders throughout the R&D process. This constant interaction likely increases the probabilities of adoption and diffusion of the technology, in this case AgroClimate. 3.2. Participatory methods
Table 1. Participatory methods used in R&D of AgroClimate Number
Time Frame
Partici -pants
Examples of Feedback incorporated into AgroClimate
Sondeo
6
19992005
107
Forestry Section Pasture/livestock section
Semistructured interviews
54
19992005
79
Simple probability graphs Less technical language
Focus groups/ team visits
5
20042005
29
Phenology Growing degree days Irrigation tools
Web Survey of Extension Agents
2
2005
200
El Nino effects on precipitation are generally known
Workshops
3
2005
22
County specific data Cotton model development
On-line feedback
24
2005
24
Broken links and empty data repaired and filled
Association meetings Total
20
20022005
750
Nil
103
19992005
1211
A variety of methods were used to gather information about users’ use of climate information. A Sondeo is a semi-structured, multi-disciplinary team process that uses discussions rather than formal questionnaires to obtain information about agricultural practices. A key to a successful Sondeo is its conversational approach. An important benefit to a conversational approach is that it elicits key issues that the researcher may not have anticipated, issues that would likely have been missed with a standard survey with a preestablished list of questions (Hildebrand 1981). Six sondeos were conducted for this study between 1999 and 2005, reaching 107 stakeholders. Semi-structured interviews have much of the same freewheeling qualities as unstructured interviews except they are based on the use of an interview guide. This is a written set of questions and topics that need to be covered in a particular order. From 2003 to 2005 researchers conducted 54 interviews of this type. Focus groups are recruited to discuss a particular topic. They typically have from 6 to 12 members. Focus groups are less expensive to conduct than questionnaire surveys and they also yield insight into why people feel a particular way toward a product. Focus groups do not replace, but rather complement surveys (Bernard 1995). Between 2003 and 2005 researchers conducted five focus groups. Web-based surveys are a modern variant of the traditional three methods of large sample surveys, phone, mail, and personal interviews. The two surveys conducted using the World Wide Web used a purposive sample of agricultural extension agents. Detailed, quantitative data were obtained through this method and will be available in a separate publication.
Breuer, N. E. et al. 2009. Journal of Service Climatology. www.journalofserviceclimatology.org
5
Workshops are brief, intensive courses for small groups. The flexibility of authority of a workshop promotes learning, discussion and feedback, with an emphasis on skills development and problem solving. The workshop leader's flexibility of role can allow for great efficiency, as the leader can direct the class toward constructive feedback, participate in exercises along with the class as a peer, or provide direct instruction and crowd control to suit the goals of the workshop at that moment. Researchers conducted three such workshops. Farmer association meetings are one to three day events held by an organized body of people who have an interest, activity, or purpose in common; in this case, agricultural production of a particular commodity. These sessions were attended by SECC researchers who either had a booth for producers to visit and talk about climate forecasts, or gave a presentation to the general assembly. They reached large numbers of producers. Our team of climate extension researchers participated in 20 of these events. On-line feedback is real-time information obtained from users of the AgroClimate web site. The form is voluntary and easy to fill out. Critiques, comments, and questions are routed to appropriate persons within the SECC and users usually receive a reply within two days. Twenty four comments have been received to date. All of the above-mentioned methods cut across phases of website development. They have been present from the beginning of AgroClimate R&D. While Sondeos were used predominantly during early phases of research, a move toward more focus groups and advisory panels is currently taking place. 3.3. Scaling relevant indicators Because the social sciences “focus on multibody problems within changing environments where the intention of the actor and acted-upon vary over time, it can be very challenging to assess which behaviors are causes, and which are effects” (Behrens et al. 2009). We attempt to gain a degree of understanding (Has useful feedback been gathered? Has diffusion of technology been accomplished? What other benefits have these
No. of Interactions 1 to 10 11 to 21 22 to 33 34 to 45 > 46
Stakeholders 1 to 17 18 to 35 36 to 54 55 to 73 > 74
Cost per capita > 135 102 to 135 68 to 101 34 to 67 1 to 33
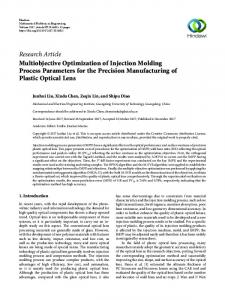
methods produced?) by using several indicators. This calls for more or less complex instruments that convert, render commensurable, and compare any of the chosen indicators. A scale is a device for assigning units of analysis to categories of a variable. Scaling is often used when multiple variables, especially a mix of quantitative and qualitative data, are to be analyzed. Likert scales are the most commonly used method in social sciences. The 5-point scale is usually used to measure attitudes, orientations, perceptions, etc., but can be helpful for analysis in other contexts (Bernard 1995). Our objective was a descriptive rather than a statistical analysis. We used a modified Likert scale (Bernard 1995; Sulser et al. 2001) method to rank each indicator of interest on a scale from which charts could be drawn to serve as a visual aid to analyzing outcomes of the several research methods. We scaled Each relevant parameter from 1 to 5. For the case of numerical parameters these were divided in five equidistant categories (or bins) and for the Likert-type evaluation, 1 represented “very low” and 5 “very high” (Table 2). The number of interactions varied from 2 through 54. Numbers of stakeholders ranged from 22 to 181. The calculated cost to reach a stakeholder by each one of the methods ranged from $3 to $181 and was reversely scaled in order to have higher scale for lower costs. Quality of feedback was determined by asking SECC researchers to rank feedback from different interactions on a Likert scale. The quantity of issues critiqued, requested, suggested, or modified ranged from zero to over 50. Characterizations of participatory methods based on these scales are shown in Figure 3. Radar diagrams visualization aids of analysis. These have often been used in the context of livelihood systems analysis, for example, to visualize social capital (Campbell et al. 2001). More area covered within each diagram does not necessarily mean “better.” Rather, the area covered by each of the five indicators allows us to visually determine what work better for each type of interaction. A table with scaled values is available in the Appendix (following the references).
Quality FB Very low Low Medium High Very high
Quantity FB 1 to 10 11 to 21 22 to 32 33 to 43 > 44
Rank on Scale 1 2 3 4 5
Table 2. Interactions ranked to scale
Breuer, N. E. et al. 2009. Journal of Service Climatology. www.journalofserviceclimatology.org
6
Sondeo
Semi-structured interviews
Number of Activities
Number of Activities
5
5
4 4
3 3
2
Quantity
Stakeholders
1
2
Quantity
Stakeholders
1
0 0
Quality
Investment
Quality
Focus Groups
Investment
Workshops Number of Activities
Number of Activities
5
5
4
4 3
3 2
Quantity
1
2
Quantity
Stakeholders
Quality
Stakeholders
1 0
0
Quality
Investment
Web Feedback
Investment
Association Meetings Number of Activities
Number of Activities
5
5
4
4
3
Quantity
Quality
2
3
Stakeholders
2
Quantity
1
1
0
0
Investment
Quality
Stakeholders
Investment
Web Survey of Extension Agents
Number of Activities 5 4 3
Quantity
2 1
Stakeholders
0
Quality
Investment
Figure 3. Activities, stakeholders, cost, quality, and quantity of feedback.
4. Results Interactions with stakeholders can be seen in Figure 2. The several participatory methods described above are cross-cutting and were used in all phases of the R&D process. 4.1. Feedback The highest quality of feedback came from semi-structured interviews, focus groups, and the survey of extension agents (Figure 3.). Semistructured interviews and focus groups were successful because researchers were able to focus either one-on-one, or in small groups for time
periods ranging from 30 minutes to three hours. During this time, point by point discussion in great detail was possible regarding any one of the tools or graphic displays in the DSS pages. Other methods of participatory action research yielded less quality feedback for refining or directing the design or content of the DSS. As with semistructured interviews, focus groups, and Sondeos, the extension agent surveys yielded better quality and high numbers of suggestions, corrections, tips, and critiques. The association meetings produced very little useable feedback. Voluntary feedback on the web resulted in low numbers but proved important for quality control.
Breuer, N. E. et al. 2009. Journal of Service Climatology. www.journalofserviceclimatology.org
7
4.2. Cost Participation in producer association meetings was costly and yielded little infusion of ideas and stated needs from potential end users. However, this activity ranked highest for dissemination of the climate forecast technology available on the Internet and through extension agents. Workshops were also costly but they had a relatively high return in terms of useful feedback. They reached few persons for technology dissemination. Sondeos were relatively low cost because five of the seven conducted were undertaken with graduate students at the University of Florida under the direction of Dr. Peter E. Hildebrand. They produced moderate amounts of quality feedback but were rich in eliciting high rates of input from agents and farmers even before the existence of the DSS. They also ranked relatively high as agents of dissemination and raised the awareness of climate topics over a five-year period. Semi-structured interviews and focus groups are relatively costly because they involve travel costs and much time investment. Nevertheless, the quality and quantity of feedback elicited, as well as the numbers of potential end-users sensitized during these activities were high. Two web-based surveys of extension agents in Florida and Georgia, respectively, had a high initial cost in software and programming, but a marginal cost for each additional survey. The amount and quality of feedback elicited was high. Web feedback has a low cost as it is only a marginal added cost to a web site that is already budgeted. The return in numbers of replies has been low but effective. Little dissemination is accomplished through this mechanism. 4.3. Dissemination Both Sondeos and participation at farmer association meetings reached a high number of stakeholders with a relatively few number of activities held. Semi-structured interviews and focus groups also engaged a high number of stakeholders, but large numbers of sessions were necessary to accomplish this. The large-scale, web-based surveys of extension agents were useful in reaching a broad spectrum of agents who work in agriculture and related areas in Florida and Georgia. A similar survey in Alabama is expected to obtain high input into the DSS development process at relatively low cost. Workshops and web feedback were on the lower end of the scale not reaching many end users. .
5. Discussion Figure 2 shows a simplified visual representation symbolizing the complex series of interactions we shared with stakeholders using several methods over a period of some five years. The greatest number of interactions with stakeholders occurred during Development (Phase II), followed Initial Assessment (Phase I) and Implementation (Phase IV). The greatest number of stakeholders to which AgroClimate was disseminated occurred during the Implementation Development Phase, followed by the Development and finally, the Initial Assessment of Stakeholder phases. Interaction or participatory methods described in this article cut across all phases of R&D. We found that the several methods of interaction with stakeholders, including potential end users, have produced differential results, while simultaneously reinforcing each other and the entire participatory process. Most, especially semi-structured interviews, extension agent surveys, focus groups, workshops, and Sondeos, have had a high return in terms of the quality and quantity of feedback into the R&D process they provided. Participation at producer meetings and the web-based voluntary feedback mechanism have had much more modest influence on the DSS development. Conversely, participation at producer meetings had produced a high rate of dissemination because these events are usually large gatherings and dozens, even hundreds attend. Workshops proved to be strong for eliciting feedback and relatively weak for disseminating forecast information. This is because workshops are designed purposefully as small meetings. A larger group had been tried and proved unwieldy and difficult to manage. The web-based surveys of extension agents elicited large amounts of quality feedback and provided dissemination to a wide array of geographically disperse agricultural extension agents at a relatively low cost. Sondeos have been of great use both during the early, pre-design phase, and after prototypes were available. The technique was low cost, rapid, and able to obtain a great wealth of information and feedback including perceptions and attitudes. These Sondeos also reached a high number of people much before the website was a reality and in doing so proved a valuable vehicle for dissemination and awareness building regarding climate forecasts. The order of usefulness of the different activities for feedback is thus: Focus groups, semi-structured interviews, workshops, and Sondeos. These are trailed distantly by association meetings.
Breuer, N. E. et al. 2009. Journal of Service Climatology. www.journalofserviceclimatology.org
8
As far as dissemination, farmer group association meetings rank highest, followed by Sondeos, semi-structured interviews, and focus groups. Workshops and web feedback mechanisms are to date the lowest ranking when dissemination is concerned.
5. Conclusions and Recommendations Future work will extend the large-scale survey to the producer level. Target groups should include the entire spectrum of farmers from single commodity commercial operations down to socially disadvantaged household farmers. All methods seem to be working for better feedback into the R&D process, for dissemination, or for both. Results suggest that these methods should continue to be an integral part of the SECC framework for the foreseeable future, and may be transferable for use in other regions. It is expected that other Regional Integrated Science and Assessment (RISA) groups in the United States and researchers working on similar climate-based decision support systems for agriculture and natural resource management abroad will take stakeholder inclusion and participation into account in their work. This method is our expected contribution to climate science. The research teams may choose to pick and what methods they will employ in their work based on their own resources, constraints, and cultural specificity of their target groups. Only participatory methods have been compared here. There is no attempt to compare them to “pipeline” or “top-down” processes. Regarding purely participatory processes, we agree with Roncoli (2006). The participatory processes have provided many additional benefits that this research team has found useful in its work. They have, as already mentioned been useful for feedback as well as dissemination. They have provided a measure of accountability and transparency. Through participatory processes stakeholders have better “buy-in” and some measure of ownership of the project. Overall, participation enhances legitimacy of the project. Lastly, these processes in their very nature tend to nurture equality by placing researchers and stakeholders on a level playing field. At this juncture, it is too early to conduct an impact study and measure how much the DSS has been adopted by measuring how many and what kinds of adaptations to climate variability farmers have made by using it. We can conclude that participation and feedback from potential end users has
both increased awareness and dissemination of AgroClimate, and has enriched the process of building it. This is expected to increase the likelihood of adoption and end user adaptations to seasonal climate variability, thus reducing climate risk. Transferable lessons may be learned from this assessment for similar projects being undertaken worldwide. To answer Lightfoot’s question, we seem to be doing the right science. (Appendix follows references) _______________________________________
Acknowledgments The authors thank the Climate Program and Office of Global Programs of the National Oceanographic and Atmospheric Administration and the Risk Management Agency of the United States Department of Agriculture for supporting this research. We also acknowledge Shrikant Jagtap and Carrie Furman for their comments and suggestions on earlier drafts. ________________________________________
6. References Ashby, JA. 2002. Integrating Research on Food and the Environment: an Exit Strategy from the Rational Fool Syndrome in Agricultural Science. Ecology and Society 5(2):20. [online] URL: http://www.consecol.org/vol5/iss2/art20/ Archer, D, Eklund, J, Walsh, M, Forcella, F 2002. WEEDEM: A user-friendly software package for predicting annual ryegrass and wild radish emergence. In: Spafford, J.H., Dodd, J., Moore, J.H. (eds.), WEEDS: "threats now & forever?” p. 252-253. In Proc. 13th Australian Weeds Conf., Perth, WA, September 8-13, 2002. Department of Primary Industries, Water and Environment, Government of Tasmania. Hobart, Tasmania, Australia. Behrens, T.E.J., Hunt, L.T., Rushworth, M.F.S. 2009. The Computation of Social Behavior. Science, 5931: 1160-1164. Bernard, HR. 1995. Research Methods in Anthropology: Qualitative and quantitative approaches. Sage. Newbury Park, CA. Cabrera, V.E. , Breuer, N.E. and Hildebrand, P.E. 2005. The dynamic north-Florida dairy farm model: a user-friendly computerized tool for increasing profits while minimizing
Breuer, N. E. et al. 2009. Journal of Service Climatology. www.journalofserviceclimatology.org
9
environmental impacts. Computers and Electronics in Agriculture 49, 286-308. Chambers, R. 1994. The origins and practice of participatory rural appraisal. World Dev. 22, 953-959. Chambers, Robert. 1995. Whose reality counts? Intermediate technology publications. Sussex, UK. Research/Extension Symposium, Manhattan, KS., USA. Gerber, B. 2005. Integrating Research and Extension Education in the Agricultural Sciences Models, Paradigms and the New Organization. Available: http://www.umass.edu/umext/jgerber/ent oappr.htm on September 14, 2005.
Sondeoapproach. Agric. Admin. 8, 423-432. Jagtap, SS, Jones, JW, Hildebrand, P, Letson, D, O'Brien, JJ, Podestá, G, Zierden, D, Zazueta, F. 2002. Responding to stakeholders’ demands for climate information: from research to applications in Florida. Agr. Syst. 74, 415-430. Jones JW, Hansen JW, Royce FS, Messina C (2000) Potential benefits of climate forecasting to agriculture. Agric Ecosyst Environ 82:169-184 Jones JW, Thornton, PK, Hansen, JW. 1997. Opportunities for systems approaches at the farm scale. p1-18. In Teng et al., (ed.) Applications for systems approaches at the farm and regional levels. Syst. Approaches for Sustainable Agric. Dev. 5. Kluwer Acad. Publ., Dordrecht, The Netherlands.
Geurtz, JLA, Joldersma, F. 2001. Methodology for participatory policy analysis. European Journal of Operational Research 128, 300-310.
Kane S, Yohe G (2000) Societal adaptation to climate variability and change: an introduction. Clim Change 45-1-4
Geurtz, JLA, Vennix, J. 1989. Verkenningen in Beleidsanalyse: Theorie en Praktijk van Modelbouw en Simulatie. Kerckebosch, Zeist.
Keating, BA, McCown, RL. 2001. Advances in farming systems analyses and intervention. Agr. Syst. 70, 555–579.
Hammer, GL, Nicholls, N, Mitchell, C. 2000. Applications of Seasonal Climate Forecasting in Agricultural and Natural Ecosystems: The Australian Experience. In: Hammer G.L., Nicholls, N. and Mitchell, C. (eds.). Applications of seasonal climate forecasting in agricultural and natural ecosystems — the Australian Experience, Kluwer Academic, The Netherlands. Hansen J.W. 2002. Realizing the potential benefits of climate prediction to agriculture: issues, approaches, challenges. Agricultural Systems 74, 309330. Hansen J.W., Hodges A.W., and J.W. Jones. 1998. ENSO influence on agriculture in the Southeastern US. Journal of Climate 11(3): 404-411.
Lightfoot, C. 2003. Demand-Driven Extension: Some Challenges for Policy Makers and Managers. Presentation to CTA Observatory on “ICTs – transforming agricultural extension?” Wageningen, Netherlands. September 23-25, 2003. Available: http://www.cta.int/observatory2003/keynote_ papers/Challenges_in-demanddriven_extension.pdf Lynam, T., F. Bousquet, C. Le Page, P. d'Aquino, O. Barreteau, F. Chinembiri, and B. Mombeshora. 2002. Adapting science to adaptive managers: spidergrams, belief models, and multi-agent systems modeling. Conservation Ecology 5(2): 24. [online] URL: http://www.consecol.org/vol5/iss2/art24/ McCown, R.L., Hochman, Z., and P. S. Carberry. 2002. Probing the enigma of the decision support system for farmers: Learning from experience and from theory.Agricultural Systems, 74:1-10
Hildebrand, P.E., Breuer, N.E., Cabrera, V.E. and Sullivan, A.J. 2003. Modeling diverse livelihood strategies in rural livelihood systems using ethnographic linear programming. University of Florida, Food and Resource Economics Department, Staff Paper Series, SP 0305. Gainesville, Florida.
Meinke, H, Baethgen, WE, Carberry, PS, Donatelli, M, Hammer, GL, Selvaraju, R, Stockle, C. 2001. Increasing profits and reducing risks in crop production using participative systems simulation approaches. Agr. Syst. 70, 493–513.
Hildebrand, P. E. 1981. Combining disciplines in rapid appraisal: the
Meinke, H, Hochman, Z. 2000. Using seasonal climate forecasts to manage dryland crops in
Breuer, N. E. et al. 2009. Journal of Service Climatology. www.journalofserviceclimatology.org
10
northern Australia - experiences from the 1997/98 seasons. pp. 149–165. In: Hammer G.L., Nicholls, N. and Mitchell, C. (eds.) Applications of seasonal climate forecasting in agricultural and natural ecosystems - The Australian Experience, Kluwer Academic, The Netherlands. Nelson, RA, Holzworth, DP, Hammer, GL, Haymand, PT. 2002. Infusing the use of seasonal climate forecasting into crop management practice in North East Australia using discussion support software. Agricultural Systems 74, 393414. Nicholls N, Kestin T (1998) Communicating climate. Clim. Change 40:417-420 O’Brien K, Leichenko (2000) Double exposure: assessing the impacts of climate change within the context of economic globalization. Global Environ Change 10:221-232 O’Brien, JJ, Zierden, DF, Legler, D, Hansen, JW, Jones, JW, Smajstrla, AG, Podestá, G, Letson, D. 1999. El Niño, La Niña and Florida’s Climate: Effects on Agriculture and Forestry. The Florida Consortium: The Florida State Univ., the Univ. of Florida, University of Miami. Tallahassee, FL. European Group, Dip. di Economia Agraria e delle Risorce Territoriali, Facolta di Agraria, Universita degli Studi di Firenze, Florence, Italy. Pfaff A., Broad K, Glantz MG (1999). Who benefits from climate forecasts? Nature 397:645-646 Pielke, R. A., Jr., 1997: Asking the right questions: Atmospheric science and societal needs. Bull. Amer. Meteor. Soc., 78, 255–264. Podestá G, Letson D, Messina C, Royce F, Ferreyra RA, Jones JW, Hansen JW, Llovet I, Grondona M, O’Brien JJ (2002) Use of ENSO-related climate information in agricultural decision making in Argentina: a pilot experience. Agr Syst 74:371-392 Ritchie JW, Zammit C, Beal C (2004) Can seasonal forecasting assist in catchment water management decision-making? A case study of the Border Rivers catchment in Australia. Agric Ecosyst Environ 104: 553-565
Robertson, MJ, Carberry, PS, Lucy, M. 2000. Evaluation of a new cropping option using a participatory approach with on-farm monitoring and simulation: a case study of spring sown mungbeans. Aust. J. Agr. Res. 51, 1–12. Roncoli C. 2006. “Ethnographic and Participatory Approaches to Research on Farmers’ Responses to Climate Predictions.” Climate Research, 33: 81-99. Roncoli, C., Ingram, K., P. Kirshen, and C. Jost. 2003. “Meteorological Meanings: Understandings of Seasonal Rainfall Forecasts by Farmers of Burkina Faso.” In: S. Strauss and B. Orlove eds. Weather, Climate, and Culture, Berg, New York, pp. 181-202. Rogers, Everett M. 1995. Diffusion of Innovations. Simon and Schuster, New York. Rosenhead, J. (Ed.), 1989. Rational analysis for a problematic world: problem structuring methods for complexity, uncertainty and conflict. Wiley, Chichester, UK. Sprague R.H. Jr., and Carlson, E.H. 1982. Building Effective Decision Support Systems. Prentice-Hall Inc. Inglewood Cliffs, NJ, USA. Stern PC, Easterling WE (eds) (1999). Making climate forecasts matter. National Academy Press, Washington. Stoorvogel, JJ, Bouma, J, Orlich, RA. 2004. Participatory research for systems analysis: prototyping for a Costa Rican banana plantation. Agron. J. 96(2), 323-336. Sulser, T.B., Duryea, M.L., Frolich, L.M and Guevara-Cuaspud, E. 2001. A field practical approach for assessing biophysical sustainability of alternative agricultural systems. Agric Systems, 68: 113-135 Vedwan, N., Broad, K., Letson, D., Ingram, K.T., Podesta, G., Breuer, N.E., Jones, J.W., O’Brien, J. 2005. Assessment of Cloimate Information Dissemination Efforts by the Florida Consortium. Southeast Cimate Consortium Technical Report Series: SECC05-001. Gainesville, FL Yohe G, RSJ Tol (2002) Indicators for social and economic coping capacity: moving toward a working definition of adaptive capacity. Global Environ Change 12:25-40 Ziervogel G, Downing TE 2004. Stakeholder networks: improving seasonal climate forecasts. Clim Chang 65: 73-101
Breuer, N. E. et al. 2009. Journal of Service Climatology. www.journalofserviceclimatology.org
11
Ziervogel G and Calder R (2003) Climate variability and rural livelihoods:
assessing the impact of seasonal climate forecasts in Lesotho. Area 35:403.
Appendix Table A1. Indicators scaled from 1 to 5. Sondeo
Number of Activities Stakeholders reached Investment Quality of Feedback Quantity of Feedback
Semi structured interview
Focus group
1
5
5
Web Survey of Ext. agents 1
5
5
5
2 4
3 4
5
5
Workshops
Web Feedback
Association Meetings
1
3
3
5
3
2
5
1 5
5 5
5 4
5 4
5 1
5
5
4
1
1
Table A2. Investment per capita (stakeholder) Cost Activity Sondeo Semi-structured Interviews Focus Groups Workshops Web Survey On-line feedback Association Meetings
total cost 14000 8000 1500 4000 600 100 12000
stakeholders
Cost per capita 107 79 29 22 200 24 750
Breuer, N. E. et al. 2009. Journal of Service Climatology. www.journalofserviceclimatology.org
131 101 32 181 3 4 16
12