MBoC MOLECULAR BIOLOGY OF THE CELL
VOLUME 23 • NUMBER 24 • DECEMBER 15, 2012
MBoC-23-24-Cover.indd 1
12/7/12 5:07:44 PM
MBoC MOLECULAR BIOLOGY OF THE CELL
Published by the American Society for Cell Biology
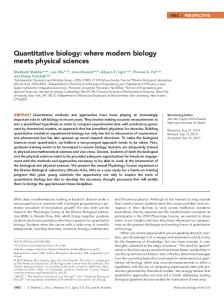
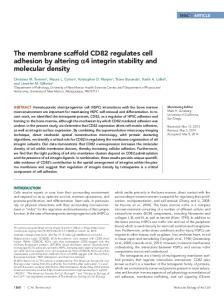
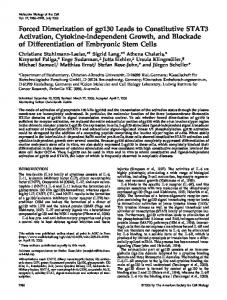
Volume 23 • Number 24 • December 15, 2012 Serotonin treatment is known to increase the rate of neurite outgrowth in Aplysia bag cell neurons, and this is accompanied by Ca2+ release from intracellular stores in the growth cone. In their article on p. 4833 of this issue of MBoC, Zhang et al. describe the effect of changes in Ca2+ on actin filament dynamics. There is a strong spatial and temporal correlation between increases in intracellular Ca2+ (top row) and increased rates of retrograde actin filament flow (middle row) in the lamellipodium or P domain of the growth cone. Increased rates of neurite outgrowth and changes in retrograde flow depended on Ca2+ activation of the protein phosphatase Calcineurin and subsequent increased apCofilin activity; the latter is reflected in decreased levels of P-apCofilin in the P domain (bottom row). (Image: XiaoFeng Zhang, Callen Hyland, and David Van Goor, Yale University, New Haven, CT)
The Philosophy of Molecular Biology of the Cell Molecular Biology of the Cell (MBoC) is published by the nonprofit American Society for Cell Biology (ASCB) and is free from commercial oversight and influence. We believe that the reporting of science is an integral part of research itself and that scientific journals should be instruments in which scientists are at the controls. Hence, MBoC serves as an instrument of the ASCB membership and as such advocates the interests of both contributors and readers through fair, prompt, and thorough review coupled with responsible editorial adjudication and thoughtful suggestions for revision and clarification. Our most essential review criterion is that the work significantly advances our knowledge and/or provides new concepts or approaches that extend our understanding. At MBoC, active working scientists—true peers of the contributors—render every editorial decision. The Society and MBoC are committed to promoting the concept of open access to the scientific literature. MBoC seeks to facilitate communication among scientists by • publishing original papers that include full documentation of Methods and Results, with Introductions and Discussions that frame questions and interpret findings clearly (even for those outside an immediate circle of experts); • exploiting technical advances to enable rapid dissemination of articles prior to print publication and transmission and archiving of videos, large datasets, and other materials that enhance understanding; and • making all content freely accessible via the Internet only 2 months after publication.
MBoC-23-24-Cover.indd 2
Statement of Scope MBoC publishes studies presenting conceptual advances of broad interest and significance within all areas of cell biology, genetics, and developmental biology. Studies whose scope bridges several areas of cell and developmental biology are particularly encouraged. MBoC aims to publish papers describing substantial research progress in full: Papers should include all previously unpublished data and methods essential to support the conclusions drawn. MBoC will not, in general, publish papers that are narrow in scope and therefore better suited to more specialized journals, merely confirmatory, preliminary reports of partially completed or incompletely documented research, findings of as yet uncertain significance, or reports simply documenting well-known processes in organisms or cell types not previously studied. Methodological studies will be considered only when some new result of biological significance has been achieved or when introduction of the method will significantly accelerate progress within a field. Note that MBoC places a premium on research articles that present conceptual advances of wide interest or deep mechanistic understanding of important cellular processes. As such, articles dealing principally with describing behavior or modification of specific transcription factors, or analysis of the promoter elements through which they interact, will not generally be considered unless accompanied by information supporting in vivo relevance or broad significance.
12/7/12 5:07:45 PM
MBoC | ARTICLE
Calcineurin-dependent cofilin activation and increased retrograde actin flow drive 5-HT–dependent neurite outgrowth in Aplysia bag cell neurons Xiao-Feng Zhang, Callen Hyland, David Van Goor, and Paul Forscher Department of Molecular, Cellular, and Developmental Biology, Yale University, New Haven, CT 06520
ABSTRACT Neurite outgrowth in response to soluble growth factors often involves changes in intracellular Ca2+; however, mechanistic roles for Ca2+ in controlling the underlying dynamic cytoskeletal processes have remained enigmatic. Bag cell neurons exposed to serotonin (5-hydroxytryptamine [5-HT]) respond with a threefold increase in neurite outgrowth rates. Outgrowth depends on phospholipase C (PLC) → inositol trisphosphate → Ca2+ → calcineurin signaling and is accompanied by increased rates of retrograde actin network flow in the growth cone P domain. Calcineurin inhibitors had no effect on Ca2+ release or basal levels of retrograde actin flow; however, they completely suppressed 5-HT–dependent outgrowth and F-actin flow acceleration. 5-HT treatments were accompanied by calcineurindependent increases in cofilin activity in the growth cone P domain. 5-HT effects were mimicked by direct activation of PLC, suggesting that increased actin network treadmilling may be a widespread mechanism for promoting neurite outgrowth in response to neurotrophic factors.
Monitoring Editor Laurent Blanchoin CEA Grenoble Received: Oct 4, 2012 Accepted: Oct 15, 2012
INTRODUCTION Soluble neurotropic factors play an important role in development (Kennedy et al., 1994; Ming et al., 1997; Campbell and Holt, 2001; Briancon-Marjollet et al., 2008). However, basic cytoskeletal mechanisms by which soluble factors affect rates of neuronal outgrowth remain poorly understood. Serotonin (5-hydroxytryptamine [5-HT]) is a soluble ligand that can signal through G(q)-coupled receptors in Aplysia neurons (Li et al., 1995, 2005; Cai et al., 2008) and trigger phospholipase C (PLC)– and inositol trisphosphate (IP3)–dependent Ca2+ release from intracellular endoplasmic reticulum (ER) stores in bag cell neuron growth cones (Zhang and Forscher, 2009). The
This article was published online ahead of print in MBoC in Press (http://www .molbiolcell.org/cgi/doi/10.1091/mbc.E12-10-0715) on October 24, 2012. Address correspondence to: Paul Forscher (
[email protected]). Abbreviations used: CN-AIP, calcineurin autoinhibitory peptide; CsA, cyclosporin A; FSM, fluorescent speckle microscopy; 5-HT, serotonin; MLCK, myosin lightchain kinase. © 2012 Zhang et al. This article is distributed by The American Society for Cell Biology under license from the author(s). Two months after publication it is available to the public under an Attribution–Noncommercial–Share Alike 3.0 Unported Creative Commons License (http://creativecommons.org/licenses/by-nc-sa/3.0). “ASCB®,” “The American Society for Cell Biology®,” and “Molecular Biology of the Cell®” are registered trademarks of The American Society of Cell Biology.
Volume 23 December 15, 2012
efficacy and spatial characteristics of Ca2+ release can be modulated by activity of the small GTPase Rac1. Rac1 activity promotes microtubule assembly and microtubule-dependent ER Ca2+ store transport into peripheral regions of the growth cone. Rac1 activity also promotes reactive oxygen species production, which sensitizes IP3dependent Ca2+ release (Gordeeva et al., 2003; Zhang and Forscher, 2009). Here we investigate how release of Ca2+ from intracellular stores affects actin filament dynamics involved in neurite outgrowth. We show that 5-HT application results in increased rates of neurite outgrowth, accompanied by increased rates of retrograde F-actin network flow. 5-HT–evoked growth involves Ca2+ release from IP3gated stores and calcineurin (protein phosphatase 2B)-dependent activation of the actin-recycling protein cofilin. Of interest, the resulting increases in actin network flow were independent of myosin II activity, whereas increases in neurite outgrowth were myosin II dependent.
RESULTS 5-HT induces neurite outgrowth on laminin substrates Several lines of evidence suggest that laminin–integrin interactions activate Rac1 and such activity is correlated with growth cone
4833
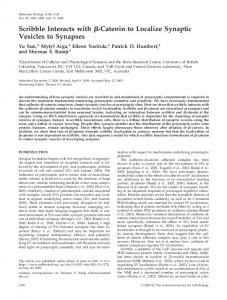
that culturing neurons on laminin substrates might increase basal Rac activity to a level at which 5-HT would elicit Ca2+ release without the use of constitutively active Rac constructs (Zhang and Forscher, 2009). Bag cell neurons were cultured on laminin substrates and neurite outgrowth assessed by differential interference contrast (DIC) time-lapse imaging for 2 h before and 6 h after 5-HT (10 μM) or vehicle addition (Figure 1A). Under these conditions, 5-HT treatment resulted in approximately threefold increase in average neurite outgrowth rate (Figure 1A). Because neurite outgrowth rates were more or less constant for up to 6 h in 5-HT, we chose to analyze population responses before and after 1 h of 5-HT exposure (Figure 1, B and C) when a ∼3.5-fold increase in neurite outgrowth rate was typically observed (Figure 1C). Both basal and 5-HT–dependent outgrowth rates were strongly attenuated by RGD peptide, which competitively inhibits laminin–integrin interactions (Gruenbaum and Carew, 1999; Tucker et al., 2005). In contrast, the reverse sequence DGR peptide control had no effect. These results confirm the specificity of the permissive role laminin plays in supporting both basal (Turney and Bridgman, 2005) and 5-HT– evoked (Figure 1C) neurite outgrowth. To test whether growth on laminin depended on Rac GTPase activity, we used a Rac1specific small-molecule inhibitor, NSC23766 (Gao et al., 2004). NSC23766 inhibited both basal and 5-HT–stimulated growth, consistent with the reported role of Rac activity in integrin function (Figure 1C; Kuhn et al., 1998; Grabham et al., 2003; Matsuo et al., 2003; Laforest et al., 2005).
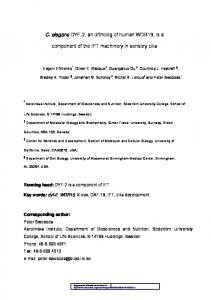
5-HT increases peripheral retrograde F-actin flow rate Next we investigated actin filament dynamics before and during 5-HT–evoked growth responses. Neurons were injected with either Alexa 568–G-actin or Alexa 594–phalloidin at trace levels to generate F-actin speckles for kinetic analysis. Features of Alexa 594–phalloidin bound to F-actin or Alexa 568–G-actin speckles incorporated into FIGURE 1: 5-HT induces neurite outgrowth on laminin substrates. (A) Neurite outgrowth on F-actin were tracked over time using a previlaminin substrates over time under control conditions (number of neurites tested [N] = 48) or before and after addition of 10 μM 5-HT (N = 46). Black arrow, 5-HT or vehicle addition. Data ously reported quantitative cross-correlation points are averages ± SEM. (B) A representative example of 5-HT (10 μM, 1 h) effect on neurite approach (Ji and Danuser, 2005; Burnette outgrowth. DIC image: bar, 10 μm. (C) Summary of neurite outgrowth rates 1 h before and after et al., 2007; Hu et al., 2007). Resulting retro5-HT (10 μM) addition under these conditions: control (number of growth cones tested [N] = 58), grade actin flow velocities were pseudocolor RGD (50 μM, 1-h pretreatment; N = 55), DGR (50 μM, 1-h pretreatment; N = 55), NSC23766 coded and corresponding vectors overlaid (0.1 mM, 1-h pretreatment; N = 58). *p < 0.001. Values are mean ± SEM. Statistical analysis by on images to illustrate actin translocation. two tailed paired t test. Figure 2A is a representative example of Aladvance (Kuhn et al., 1998; Grabham et al., 2003; Matsuo et al., exa 568–G-actin fluorescent speckle microscopy (FSM) data (top) and corresponding flow maps (bottom) from a growth cone before 2003; Laforest et al., 2005). On the basis of our previous finding that and after 5-HT treatment. 5-HT exposure elicited 6.6 ± 1.0% and Ca2+ release from IP3 stores was Rac dependent, we hypothesized 4834 | X.-F. Zhang et al.
Molecular Biology of the Cell
FIGURE 2: 5-HT increases peripheral retrograde actin filament flow rate. (A) Representative G-actin FSM images (top) and corresponding flow maps (bottom) from a growth cone before and after 5 or 10 min in 5-HT. Bar, 10 μm. Flow map colors encode speed (see scale bar), and arrows indicate flow direction. (B) Summary of relative changes in retrograde actin flow rates in response to 5-HT. Images acquired every 5 s with 1-min elapsed recording time and flow rates assessed as in A. Number of growth cones tested (N) = 3. *p < 0.01 vs. before 5-HT addition. (C) DIC (top), Alexa 594–phalloidin FSM (middle), and corresponding flow map (bottom) of a growth cone before and after 30 min in 5-HT. Bar, 10 μm. Images acquired every 5 s with 2-min elapsed recording time. (D) Summary of P domain retrograde flow rates in response to 5-HT (10 μM, 30 min, and 60 min). Data normalized to rates before 5-HT addition. Number of growth cones evaluated (N) = 25. Values are mean ±SEM. *P < 0.001 vs. before 5-HT addition. Statistical analysis by two-tailed paired t test.
28.3 ± 2.7% increases in F-actin flow rates at 5- and 10-min time points, respectively (Figure 2B). To investigate whether growth cones maintained accelerated F-actin flow rates during prolonged periods Volume 23 December 15, 2012
of evoked outgrowth, we assessed F-actin dynamics 30 and 60 min after 5-HT treatment. Figure 2C illustrates representative growth cone structures (DIC), F-actin distributions, and corresponding actin Actin treadmilling and neurite growth | 4835
Taken together, these results indicate that 5-HT treatment triggers a persistent increase in peripheral F-actin flow that is well correlated with the observed accelerated rate of growth cone advance.
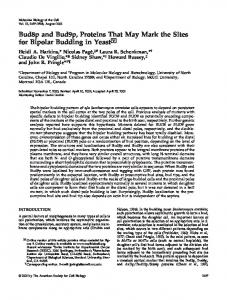
Direct phospholipase C activation increases neurite growth and retrograde flow rates To investigate the generality of this response, we bypassed the 5-HT receptor and directly activated PLC—the downstream effector of receptor signaling through trimeric Gq proteins (Figure 3). PLC activation with m-3M3FBS (25 μM; Bae et al., 2003; Li et al., 2009) resulted in sustained ∼3.5-fold increases in neurite outgrowth rates (Figure 3, A and B) accompanied by increases in retrograde actin flow (Figure 3, C and D) essentially identical to those observed after 5-HT treatments (Figure 2).
5-HT–induced F-actin flow increases and outgrowth depend on Ca2+ release from IP3-gated stores
Ca2+ is known to participate in 5-HT function in neurons (Dropic et al., 2005; Li et al., 2005; Cai et al., 2008). Previously we reported that 5-HT evoked Ca2+ release in Aplysia growth cones in the presence of constitutively active (but not dominant negative) Rac1 when cells were plated on PLL substrates (Zhang and Forscher, 2009). Given that laminin has been widely reported to increase Rac activity (Kuhn et al., 1998; Grabham et al., 2003; Matsuo et al., 2003; Laforest et al., 2005) and the robust Rac dependence of the outgrowth responses under study (Figure 1C), we tested whether 5-HT would elicit Ca2+ release in growth cones on laminin substrates. Supplemental Figure 1A shows that 5-HT treatments indeed evoked rapid and sustained Ca2+ increases in the entire growth cone (see also Supplemental Movie S2). These responses depended on the PLC → IP3 signaling casFIGURE 3: PLC activator increases peripheral retrograde actin filament flow rate and promotes cade since the PLC inhibitor U73122 (Jin neurite outgrowth. (A) Neurite outgrowth on laminin substrates over time before and after et al., 1994; Zhou et al., 1999) or the IP3 readdition of 25 μM PLC activator m-3M3FBS (number of neurites tested [N] = 32). Black arrow, ceptor blocker xestospongin C (XeC; Gafni m-3M3FBS addition. Data points are averages ± SEM. (B) Comparison of neurite outgrowth et al., 1997) abolished 5-HT–evoked Ca2+ rates 1 h before and after m-3M3FBS (25 μM) addition. Data is taken from A. *p < 0.001. Values are mean ± SEM. Statistical analysis by two-tailed paired t test.(C) Alexa 594–phalloidin FSM responses (Supplemental Figure S1, A and (top) and corresponding flow map (bottom) from a growth cone before and after 30 min in B). During more prolonged 5-HT exposure m-3M3FBS (25 μM). Bar, 10 μm. Flow map generated as described. Images acquired every 5 s (1 h), Ca2+ levels remained elevated ∼22% with 2-min elapsed recording time. (D) Summary of normalized P domain retrograde flow rates above baseline. These Ca2+ changes were in response to 25 μM m-3M3FBS. Data normalized to rates before m-3M3FBS addition. N = 12 also inhibited by pretreatment with PLC or growth cones. *p < 0.001 vs. before m-3M3FBS addition. Values are mean ± SEM. IP3 receptor antagonists (Supplemental Figure 1, C and D, and Supplemental Movie S3). Finally, pretreatment with the Rac inhibitor NSC23766 abolflow maps before and after 30 min in 5-HT. Rates of growth cone ished 5-HT–dependent Ca2+ responses (Supplemental Figure S2). advance were correlated with increased F-actin flow rates (Figure Collectively, these data show that 5-HT triggers sustained Ca2+ in2C, DIC vs. flow map; see Supplemental Movie S1). On average, Factin flow rates significantly increased by 27.2 ± 2.1% and 29.3 ± creases in parallel with increased retrograde F-actin flow when Rac 2.5% after 30- and 60-min 5-HT exposures, respectively (Figure 2D). levels are sufficiently elevated. 4836 | X.-F. Zhang et al.
Molecular Biology of the Cell
multichannel fluorescence imaging). Figure 4A shows Ca2+ levels and FSM records from a growth cone before and after a 30-min 5-HT treatment. Ca2+ levels and peripheral F-actin flow rates increased in parallel by 20.9 and 25.4%, respectively. There was a strong temporal correlation between average 5-HT–evoked Ca2+ elevations and increases in F-actin flow (Figure 4B). When Ca2+ release from intracellular stores was blocked by inhibiting PLC or IP3 using U73122 or XeC, respectively, no changes in baseline actin flow or growth rates were observed; however, 5-HT–evoked increases in F-actin flow and concomitant increases in neurite outgrowth were completely suppressed (Figure 4, C and D). Taken together, these results indicate that IP3-dependent Ca2+ mobilization is upstream of, and necessary for, the increased F-actin flow rates and growth-promoting effects of 5-HT observed.
5-HT effect on F-actin flow is independent of myosin light-chain kinase activity Given that 5-HT-induced increases in F-actin flow were Ca2+ dependent and myosin II activity is known to affect F-actin flow rates (Lin et al., 1996; Medeiros et al., 2006), we investigated whether activation of myosin light-chain kinase (MLCK), which is a Ca2+/calmodulin– dependent regulator of myosin II activity (Kamm and Stull, 2001; Schmidt et al., 2002), could be the Ca2+ effector mediating flow increases. We used ML-7, a wellcharacterized MLCK inhibitor (Ruchhoeft and Harris, 1997; Zhou and Cohan, 2001; Zhang et al., 2003) effective in our system FIGURE 4: 5-HT-evoked Ca2+ release and peripheral retrograde actin flow increases are (Zhang et al., 2003). In control expericorrelated and necessary for induced neurite outgrowth. (A) Tandem Ca2+ ratio imaging and ments, we found that exposure to ML-7 actin FSM. Ca2+ ratio image (top) and Alexa 594–phalloidin FSM (bottom) of a growth cone before and after 30 min in 5-HT. Bar, 10 μm. The Ca2+ ratio is encoded by a linear pseudocolor alone (15–20 min) did not alter Ca2+ levscale. Images acquired every 10 s with 3-min elapsed recording time. Top right, growth cone els (Supplemental Figure S3A; also see Ca2+ response to 5-HT over time. Fo, average Ca2+ level before 5-HT addition. Bottom right, Figure 5B, inset vs. left); however, F-actin kymographs sampled from area of interest indicated in actin panel (yellow arrowheads). flow rates decreased by ∼15% (SuppleRetrograde flow rate before and after 30 min of 5-HT exposure: 4.88 ± 0.21 and 6.12 ± 0.19 μm mental Figure S3B; also see Figure 5D, 1 2+ min− , respectively (mean ± SD, N = 5 measurements). (B) Comparison of Ca levels and P inset vs. left) consistent with previous redomain flow rates before and after 5-HT. The Ca2+ ratio imaging and FSM were carried out ports that MLCK activity is involved in setsimultaneously. Images acquired every 5 or 10 s with 2- to 3-min elapsed recording time. Fo, average Ca2+ level before 5-HT addition. Ro, average retrograde flow rate before 5-HT addition. ting basal F-actin flow rates (Zhang et al., N = 14 growth cones. *p < 0.001 vs. before 5-HT addition. (C) Retrograde flow rates in response 2003). We next investigated the effect of to 5-HT in various conditions normalized to before 5-HT addition. N = 25 growth cones (control), N = 18 (U73122, 2 μM, 30-min pretreatment), and N = 21 (XeC, 20 μM, 30-min pretreatment). MLCK inhibition on 5-HT–evoked Ca2+ Control from Figure 2D included for comparison. *p < 0.001 vs. before 5-HT addition. release and F-actin flow. After MLCK inhi(D) Summary of neurite outgrowth 1 h before and after 5-HT addition in various conditions. bition, 5-HT continued to evoke Ca2+ Control (N = 58 growth cones), U73122 (2 μM, 1-h pretreatment, N = 34), and XeC (20 μM, 1-h release (+17%; Figure 5B), as well as inpretreatment, N = 37). Control from Figure 1C is included for comparison. *p < 0.001 vs. before creases in peripheral F-actin flow (+29%; 5-HT addition. Values are mean ± SEM. Statistical analysis was done by two-tailed paired t test. Figure 5, C and D). Indeed, statistical analysis indicated that MLCK inhibition did not significantly affect the depth of 5-HT–evoked Ca2+ reTo directly address the relationship between Ca2+ levels and sponses (Table 1) or increases in F-actin flow (Table 2). In sumF-actin dynamics, we performed simultaneous ratiometric Ca2+ immary, although MLCK plays a role in setting basal F-actin flow aging and F-actin FSM (see Supplemental Movie S4, A and B, for Volume 23 December 15, 2012
Actin treadmilling and neurite growth | 4837
5-HT effects on F-actin flow are independent of myosin II activity Previous evidence suggested that myosin II sets the maximum rate of retrograde F-actin flow in growth cones (Lin et al., 1996; Medeiros et al., 2006; Burnette et al., 2007). To directly investigate the role myosin II plays in 5-HT effects, we used blebbistatin, a specific nonmuscle myosin II ATPase inhibitor (Straight et al., 2003; Allingham et al., 2005) that has been extensively characterized in our system (Medeiros et al., 2006). Similar to what was previously observed for growth cones plated on PLL substrates, 10- to 20-min blebbistatin exposures promoted elongation of filopodial actin bundles, resulting in rearward expansion of the peripheral cytoplasmic domain (Supplemental Figure S4A and Supplemental Movie S5). During blebbistatin treatment peripheral F-actin flow rates typically decreased by ∼20% (Supplemental Figure 4, A bottom, and B), consistent with nonmuscle myosin II playing a role in setting basal rates of retrograde F-actin flow on laminin as previously observed on PLL substrates (Medeiros et al., 2006). We then investigated a role for myosin II in 5-HT–induced increases in F-actin flow. Neurons were pretreated with blebbistatin for 20 min to maximally inhibit myosin II activity (Medeiros et al., 2006) and then challenged with 5-HT. Remarkably, after blebbistatin pretreatment, 5-HT exposure continued to trigger increases in retrograde flow (∼25.5% increase after 10 min; Figure 6A) at levels similar to that observed under control conditions (Figure 6B) that were sustained for up to 60 min (Figure 6C; kymographs show flow increases of 22.0 and 25.1% at 30- and 60-min time points, respectively). The average magnitude of 5-HT–induced actin flow increases was not significantly different between control and blebbistatin-pretreated growth cones (Figure 6D). These results strongly suggest that changes in myosin II activity are not inFIGURE 5: 5-HT-induced increase in actin flow is independent of MLCK activity. (A–D) A representative example of growth cone responding to 5-HT in ML-7 background. (A) DIC, volved in the 5-HT–induced increases in ac(B) Ca2+ ratio, (C) Alexa 594–phalloidin FSM, (D) corresponding flow map. Cells pretreated with tin network flow and corresponding inML-7 (10 μM) for 15 min and ML-7 present throughout 1 h in 5-HT. Bar, 10 μm. Data acquired creased rates of actin filament turnover every 5 s with 2-min elapsed recording time. The Ca2+ level is encoded by a linear pseudocolor observed. scale as before. Yellow lines demark leading edge in C. Insets in B and D are controls before We then investigated whether myosin II ML-7 addition. activity is necessary for the more global effect of 5-HT on neurite outgrowth. To be rates, 5-HT effects on actin network flow were essentially indeconsistent with the aforementioned experiments, outgrowth rates pendent of MLCK activity. were assessed for 1 h under control conditions and during 5-HT Of interest, MLCK inhibition did appear to inhibit 5-HT– exposure. We noted that in ∼75% of the growth cones (n = 90), evoked neurite outgrowth (Figure 5A; dotted red line), suggest∼1.5 h of exposure to blebbistatin alone resulted in neurite ing that 5-HT effects on actin dynamics versus neurite growth branching accompanied by enhanced rates of neurite outgrowth. might have differential myosin II dependences. To test this posSimilarly, long-term blebbistatin treatment has been reported to sibility, we further investigated the role of myosin II in 5-HT–mepromote neurite outgrowth in chicken retina explants, medulla, diated growth. and spinal cord neurons (Rosner et al., 2007). Given the foregoing 4838 | X.-F. Zhang et al.
Molecular Biology of the Cell
Control (no pretreatment)
ML-7 pretreatment
0±0
0±0
Flow rate before 5-HT
100 ± 0
100 ± 0
Before 5-HT: (F0 − F0)/F0
0.205 ± 0.023*
0.201 ± 0.026*
Flow rate 30 min after 5-HT
127.2 ± 2.1*
124.8 ± 2.7*
5-HT 30 min: (F30− F0)/F0
0.215 ± 0.025*
0.205 ± 0.027*
Flow rate 60 min after 5-HT
129.3 ± 2.5*
126.1 ± 2.7*
5-HT 60 min: (F60 − F0)/F0
25
16
17
9
N
No pretreatment
N
Summary of (Ft − Fo)/Fo recorded in the entire growth cone area quantifying Ca2+ response to 5-HT with or without MLCK inhibition. For MLCK inhibition, cells were pretreated with ML-7 (10 μM) for 15–20 min and ML-7 was present throughout. Records acquired every 5 or 10 s with 2- to 3-min elapsed recording time. Fo, average Ca2+ level before 5-HT addition. F30 and F60, average Ca2+ level 30 and 60 min after 5-HT addition, respectively. N denotes number of growth cones evaluated. Values are expressed as mean ± SEM. Statistical analysis was done by two-tailed paired t test. *p < 0.001 vs. before 5-HT addition. In addition, there was no significant difference in the magnitude of 5-HT responses in control vs. ML-7 group.
ML-7 pretreatment
Data normalized to flow rates before 5-HT addition (percentage of before 5-HT) to quantify changes of P domain retrograde flow rates in response to 5-HT with or without MLCK inhibition. For MLCK inhibition, cells were pretreated with ML-7 (10 μM) for 15–20 min and ML-7 was present throughout. Data were acquired every 5 or 10 s with 2- to 3-min elapsed recording time. N denotes the number of growth cones tested. Values are expressed as mean ± SEM. Statistical analysis was done by two-tailed paired t test. *p < 0.001 vs. before 5-HT addition. In addition, there was no significant difference in the magnitude of 5-HT responses in control vs. ML-7 group.
Table 2: MLCK inhibition does not affect 5-HT–evoked actin flow increases.
TABLE 1: MLCK inhibition does not affect 5-HT–evoked Ca2+ increases.
considerations, neurons were pretreated with blebbistatin for 10 min to establish maximal inhibitory effects on actin flow (Medeiros et al., 2006) and then exposed to 5-HT for only 1 h in the continued presence of blebbistatin, at which time outgrowth rates were assessed. Blebbistatin treatment completely blocked 5-HT–evoked neurite outgrowth (Figure 6E; see also DIC in C), consistent with effects seen after MLCK inhibition (Figure 6E). Taken together, these results suggest that 5-HT treatment leads to increases in actin network flow that are independent of myosin II activity; however, myosin contractility appears to be essential to functionally couple increased actin network flow rates to the process of neurite advance.
release (Supplemental Figure S6 and Figure 7, A and B); however, increases in F-actin flow rate were completely suppressed (Figure 7, A and C). These results strongly suggest that 5-HT–induced increases in F-actin flow depend on calcineurin activation downstream of Ca2+ release from intracellular stores. To investigate the role of calcineurin in 5-HT–evoked neurite outgrowth, we assessed growth rates for 1 h in the presence of CN-AIP, FK-506, or CsA alone and after 5-HT exposure. Calcineurin inhibition had no effect on basal neurite outgrowth rates but completely blocked 5-HT–dependent neurite outgrowth (Figure 7D; see also DIC in Supplemental Figure S6). Taken together, these results support a mechanism by which 5-HT treatment promotes neurite outgrowth through a calcineurin-dependent increase in actin network flow and turnover.
5-HT–induced increase in F-actin flow depends on calcineurin activity
5-HT–dependent calcineurin activation increases apCofilin1 activity
Calcineurin, or Ca2+/calmodulin–dependent protein phosphatase 2B (PP2B), is enriched in growth cones and has been implicated in Ca2+-dependent regulation of neurite extension and filopodium dynamics (Ferreira et al., 1993; Chang et al., 1995; Lautermilch and Spitzer, 2000; Cheng et al., 2002; Arie et al., 2009). Although cytoskeletal proteins have often been implicated in calcineurin actions, to our knowledge calcineurin effects on actin dynamics have never been directly assessed. Thus we first looked at potential effects of calcineurin inhibition alone on actin dynamics. To this end, we treated cells with the cell-permeable calcineurin inhibitor FK-506 or cyclosporin A (CsA; Liu et al., 1991; Fruman et al., 1992). The Ca2+ levels and F-actin flow rates did not differ significantly from controls after 20–40 min of FK-506 or CsA exposure alone (Supplemental Figure S5, A and B). As an alternative approach, we injected a specific calcineurin inhibitor consisting of the conserved calcineurin autoinhibitory peptide domain (CN-AIP; Hashimoto et al., 1990; Perrino et al., 1995) into cells. CN-AIP injection also had no effect on F-actin flow rates (unpublished data). These observations indicate that basal levels of retrograde actin flow do not depend on calcineurin activity. We next investigated effects of calcineurin inhibition on 5-HT– evoked Ca2+ release. In CN-AIP–injected or FK-506– or CsA-pretreated neurons, 5-HT continued to evoke typical levels of Ca2+
Cofilin is highly expressed in neuronal growth cones, and increased cofilin activity has been implicated in neurite extension (Meberg and Bamburg, 2000; Endo et al., 2003; Ng and Luo, 2004; Tahirovic and Bradke, 2009). Cofilin is inhibited by phosphorylation by LIM kinase and activated by the cofilin phosphatase Slingshot (DesMarais et al., 2005). It has been reported that intracellular Ca2+ elevation leads to calcineurin-dependent Slingshot activation and cofilin dephosphorylation (Wang et al., 2005). Therefore we investigated a potential link between calcineurin and cofilin activity in 5-HT–induced neurite outgrowth. To generate cofilin activity probes, we identified and cloned two Aplysia californica cofilin homologues (apCofilin1 and apCofilin2, which share only 25.1% sequence identity). Antibodies were generated using recombinant proteins encoding both fulllength apCofilins. We successfully generated phospho-specific antibodies against apCofilin1 and used this antibody in combination with total anti-apCofilin1 to assess apCofilin1 activity patterns (see Table 3 and Supplemental Figures S7 and S8). To assess 5-HT effects on the spatial profile of apCofilin1 activity, we generated ratiometric P-apCofilin1/Total-apCofilin1 images. 5-HT treatments significantly increased, that is, disinhibited apCofilin1 activity in the entire growth cone, reflected by a decrease in measured P-apCofilin1/Total-aPcofilin1 levels (Figure 8, A and B). Pretreatment with the calcineurin inhibitor FK-506 completely
Volume 23 December 15, 2012
Actin treadmilling and neurite growth | 4839
4840 | X.-F. Zhang et al.
Molecular Biology of the Cell
abolished 5-HT–dependent cofilin activation, resulting in activity patterns very similar to those of controls (Figure 8, A, right, and C). Population analysis demonstrated that 5-HT treatment markedly increased cofilin activity in the distal one-third and the proximal onethird of the P domain by ∼15 and ∼22%, respectively, compared with controls (Figure 8D). However, in FK-506 backgrounds, 5-HT treatment did not cause any significant changes in cofilin activity (Figure 8D). Treatment with in FK-506 alone did not significantly change apCoflin1 activity. Taken together, these observations suggest that 5-HT triggers calcineurin-dependent apCofilin1 activation, which supports increased rates of growth cone and neurite advance.
DISCUSSION In Aplysia neurons, 5-HT induces actin polymerization essential for synaptic remodeling associated with long-term facilitation (Hatada et al., 2000; Udo et al., 2005). Facilitation also depends on Ca2+ release from postsynaptic stores (Li et al., 2005; Cai et al., 2008). These findings suggest roles for Ca2+ release and actin dynamics in synaptic plasticity; however, mechanisms by which these processes contribute to 5-HT–dependent neurite outgrowth are not well understood. Here we describe a novel mechanism of neurite growth by which exposure to a soluble factor, 5-HT, triggers Ca2+ release from intracellular stores, which in turn promotes increased rates of retrograde actin network flow accompanied by calcineurin-dependent apCofilin activation (Figure 9A). Calcineurin, or PP2B, is a Ca2+/calmodulin-dependent serine– threonine phosphatase, which plays a role in coupling Ca2+ signals to many neuronal responses (Groth et al., 2003; Nguyen and Di Giovanni, 2008; Bodmer et al., 2011) and has been implicated in promoting neurite outgrowth (Ferreira et al., 1993; Chang et al., 1995; Sotogaku et al., 2007; Arie et al., 2009; Figge et al., 2011). We found that 5-HT continued to evoke Ca2+ release after calcineurin inhibition; however, accompanying increases in F-actin flow and neurite outgrowth were completely absent (Figure 7). Our results indicated that calcineurin activation was necessary for the observed changes in actin dynamics and raised the question of the calcineurin effector. Calcineurin-dependent activation of Slingshot phosphatase can activate cofilin (Wang et al., 2005; Pandey et al., 2007; Zhao et al., 2008). In agreement, we found that 5-HT treatments resulted in calcineurin-dependent activation of apCofilin1 in regions in which increased F-actin flow were observed (Figure 8).
The cytoskeletal mechanism of this 5-HT growth response contrasts with what was observed during acute transitions from nonpermissive to permissive extracellular growth substrates (Lin and Forscher, 1995) or after application of apCAM-coated beads, for which increased rates of advance were correlated with decreased retrograde actin flow rates (Suter and Forscher, 2000, 2001). The rate of retrograde flow (Vr) in the P domain is determined by the balance of forces on actin networks (Craig et al., 2012). Actin network assembly near the leading edge and nonmuscle myosin II contractility in the T zone generate pushing and pulling forces, fpoly and fmotor, respectively, which drive network flow (Figure 9B, red arrows; Lin et al., 1996; Henson et al., 1999; Mogilner and Oster, 2003; Medeiros et al., 2006). Constant actin polymer turnover is necessary to prevent buildup of compressive forces in the T zone (Figure 9B; fbreak), which resist actin filament flow (Van Goor et al., 2012). In addition to these internal forces, adhesion to extracellular substrates can generate traction forces (Figure 9B; fadhesion), which tend to oppose retrograde flow (Lin and Forscher, 1995) and are the basis of the “molecular clutch hypothesis” for regulation of neurite growth (Mitchison and Kirschner, 1988; Suter and Forscher, 1998; Suter and Forscher, 2001; Schaefer et al., 2008). Adhesion and network compression can be modeled as viscous drags (εadhesion and εbreak, respectively), which result in forces that scale with actin flow velocity. In summary, actin polymerization and myosin II contractility tend to increase retrograde flow rates, whereas network compression in the T zone and/or adhesion to extracelluar substrates tend to decrease it (Figure 9C; see Craig et al., 2012). We found that 5-HT treatments (or PLC activation) resulted in acceleration of Vr without a significant change in P domain width. This means that increases in actin assembly had to be matched by increases in filament turnover. In line with this finding, recent related studies from our group support a key role for actin filament turnover in determining retrograde flow rates and P domain geometry (Van Goor et al., 2012; Yang et al., 2012). The importance of F-actin turnover for axon extension has also been reported (Bradke and Dotti, 1999; Gallo et al., 2002). Cofilin activation promotes actin filament turnover, thereby reducing network density and decreasing εbreak, which would support the faster F-actin flow rates observed. Moreover, actin filament disassembly tends to increase G-actin concentration. Together these processes would increase polymerization rates and facilitate the accelerated actin treadmilling rates observed. In addition,
FIGURE 6: The 5-HT–induced increase in actin flow is independent of myosin II activity. (A–C) Cells were pretreated for 20 min with blebbistatin (60 μM) and drug maintained throughout experiments. (A) Alexa 594–phalloidin FSM (top) and corresponding flow map (bottom) from a growth cone before and after 5 and 10 min in 5-HT. Bar, 10 μm. Flow map generated as described. (B) Summary of changes in retrograde F-actin flow rates in response to 5-HT. Images acquired every 5 s with 1-min elapsed recording time. No pretreatment (control) from Figure 2B is shown for comparison. N = 3 growth cones for each condition. Values are mean ± SEM. (C) DIC (top) and phalloidin–Alexa 594 FSM (middle) of a blebbistatin-treated growth cone before and after 30 and 60 min in 5-HT. Bar, 10 μm. Images were acquired every 5 s with 2-min elapsed recording time. Bottom, kymographs sampled across the P domain near yellow arrowheads showing rates of retrograde flow before and after 30 and 60 min of 5-HT exposure. Before, 4.55 ± 0.25; 30-min 5-HT, 5.55 ± 0.27; 60-min 5-HT, 5.69 ± 0.25 μm min−1 (mean ± SD, five measurements each). (D) Summary of normalized P domain retrograde flow rates in response to 10 μM 5-HT with or without myosin II inhibition. Data normalized to rates before 5-HT addition. No pretreatment control: N = 25 growth cones from Figure 2D shown; blebbistatin (N = 22, 60 μM pretreatment for 10–20 min). *P < 0.001 vs. before 5-HT addition. (E) Summary of neurite outgrowth sampled 60 min before and 60 min after 5-HT addition. Control conditions (N = 58 growth cones), blebbistatin pretreatment (60 μM, 10 min, and presence throughout, N = 36); ML-7 pretreatment (10 μM, 60 min, and presence throughout, N = 34). Control is from Figure 1C for comparison. In blebbistatin background, data were excluded from growth cones undergoing branching. Values are mean ± SEM. Statistical analysis by two-tailed paired t test. *p < 0.001. Volume 23 December 15, 2012
Actin treadmilling and neurite growth | 4841
FIGURE 7: The 5-HT–induced increases in actin flow rates and neurite outgrowth depend on calcineurin activation downstream of Ca2+ release. (A) The Ca2+ ratio image (left) and phalloidin–Alexa 594 FSM (right) of a growth cone before and after 30 and 60 min in 5-HT. The cell was pretreated with FK-506 (2.5 μM) for 30 min. Note that FK-506 was present throughout. Bar, 10 μm. The Ca2+ ratio image is coded by pseudocolors in the linear scale (see scale bar). Data were acquired every 10 s with 2-min elapsed recording time. (B) Top, plot of Ca2+ response to 5-HT. Data obtained from the entire growth cone in A. Fo, the average Ca2+ level before 5-HT addition. (B) Bottom, summary of Ft/Fo plot recorded in the entire growth cone area quantifying Ca2+ response to 5-HT after calcineurin inhibition. Data were acquired every 10 s with 2- to 3-min elapsed recording time. Fo, the average Ca2+ level before 5-HT addition. Number of growth cones tested (N) = 6 (CN-AIP, injected, 0.2 mM in needle), 8 (FK-506, 2.5 μM pretreatment for 30 min and presence throughout), or 6 (CsA, 1 μM pretreatment for 30 min and presence throughout). Values are expressed as mean ± SEM. Statistical analysis was done by two-tailed paired t test. *P < 0.005. (C) Top, kymographs created from area of interest as indicated in A (yellow arrowhead), showing rates of P domain retrograde flow before and after 30 and 60 min of 5-HT exposure. Before, 3.22 ± 0.23, vs. 30-min 5-HT, 3.24 ± 0.24, vs. 60-min 5-HT, 3.21 ± 0.26 μm min−1 (mean ± SD, five measurements). (C) Bottom, summary of normalized P domain retrograde flow rates in response to 5-HT after 4842 | X.-F. Zhang et al.
Molecular Biology of the Cell
Name
Sequence
apCofilin1
MASGIKIADTVKEVYSRISLNSVKQTKLKYGVFKFADDGASIVVETTATNADAMSYDELISGLPKDDVRYIAYDFDFLSKDNVKTSEIVLVSWAPEKSAIKRKMMCASTFNSLKMALAVSKNVLQGDSFDEVDSVAALDKVGGKPLP
NP1
Ac-AMASGIKIADTV-Camide
PP1
Ac-AMA(pS)GIKIADTV-Camide
ApCofilin1 contains 147 amino acids and has a predicted molecular weight of 15.985 kDa. Homologue-specific antibody to apCofilin1 was generated against the full-length protein of apCofilin1; phospho-specific anti-apCofilin1 antibody was raised against the first 11 amino acids of apCofilin1. Ac, acetyl group added to remove positive charge of the amine group; Camide, amide group added to remove negative charge of the carboxylic acid group; pS, phosphorylated serine.
Table 3: The full-length apCofilin1 protein sequence and peptide sequences used for homologue-specific antibody and phosphospecific antibody generation.
increased cofilin activity leads to barbed-end production, which increases the density of actin assembly sites and promotes leading-edge protrusion during cell migration in response to soluble growth factors in nonneuronal cells (Pollard and Borisy, 2003; Ghosh et al., 2004; Kiuchi et al., 2007) and to neurotrophic factors (BDNF, NGF, or netrin-1) in embryonic DRG and retinal neuron growth cones (Gehler et al., 2004; Marsick et al., 2010). In line with these findings, we recently reported a high density of free barbed ends in a band along the leading edge of bag cell neuron growth cones that were sensitive to treatments that inhibit cofilin activity (Van Goor et al., 2012). How can these observations be reconciled with the original molecular clutch hypothesis, which predicts that accelerated neurite outgrowth is correlated with decreased rates of retrograde actin flow? As per the foregoing discussion, retrograde flow rates depend on four parameters: 1) actin filament assembly, 2) myosin II contractility, 3) actin filament severing/recycling, and 4) cell adhesion (Figure 9, B and C). Assembly and turnover facilitate retrograde flow, whereas network compression and adhesion tend to oppose it. The present results suggest that a revision of the original molecular clutch hypothesis is in order. In particular, a less constrained multi level slip clutch model as suggested by Giannone et al. (2009) can explain the results we observed. Indeed, with a viscous slip clutch– type model, faster flow rates alone without a change in adhesion strength (εadhesion) would result in increased traction force due to increased viscous drag (Figure 9C). Alternatively, εadhesion could increase, but the resulting increase in drag force (fadhesion) would have to be matched by increased polymerization and/or motor force to account for the flow rate acceleration observed. It is also possible that flow rates are increasing in 5-HT as a result of decreased εadhesion. It will be of interest to measure traction forces in parallel with actin dynamics to address these outstanding issues. It should
be noted that the present results are not without precedent: immune system dendritic cells have been shown to migrate under conditions of extremely low adhesion by increasing their retrograde actin flow rates (Renkawitz et al., 2009). Myosin II activity can also promote actin turnover in growth cones (Medeiros et al., 2006) and nonneuronal cells (Guha et al., 2005; Murthy and Wadsworth, 2005; Haviv et al., 2008). Here we investigated potential roles for myosin light-chain kinase and myosin II activity in 5-HT growth responses. Of interest, 5-HT–dependent increases in network turnover and retrograde flow persisted even after MLCK inhibition or direct inhibition of myosin II (Figures 5 and 6, A–D, and Table 2). In contrast, neurite outgrowth depended on myosin II activity (Figures 5, 6E, and 9), as previously observed in vertebrate neurons (Bridgman et al., 2001; Turney and Bridgman, 2005). Myosin II activity might regulate adhesion site dynamics and maturation (Papusheva and Heisenberg, 2010) involved in generating traction forces that promote neurite extension (Zheng et al., 1991; Heidemann and Buxbaum, 1994; Heidemann et al., 1995). Although our results are consistent with myosin II inhibition reducing point contact consolidation (Woo and Gomez, 2006), further studies involving measurement of growth cone traction force are necessary to address this outstanding issue.
Materials and Methods Cell culture and chemicals Primary culture of Aplysia bag cell neurons was as previously described (Forscher et al., 1987). Coverslips were pretreated by 20 μg/ ml poly-l-lysine (Sigma-Aldrich, St. Louis, MO) for 15 min, then incubated in a 50 μg/ml laminin (Sigma-Aldrich) solution for 2 h and rinsed in L15-ASW. 5-HT , U-73122, xestospongin C (XeC), Gly-ArgGly-Asp-Ser (RGD), and Ser-Asp-Gly-Arg-Gly (DGR) were from Sigma-Aldrich. Blebbistatin, ML-7, calcineurin autoinhibitory peptide (CN-AIP), FK-560, and CsA were from Calbiochem (La Jolla, CA). Calcium green-1 dextran, potassium salt, 10,000 MW (CG-1), Alexa Fluor 568 dextran, 10,000 MW (Alexa 568), Alexa Fluor 647 dextran, 10,000 MW (Alexa 647), Alexa Fluor 488 dextran, 10,000 MW (Alexa 488), Alexa Fluor 568–rabbit skeletal muscle G-actin (Alex 568 G-actin), and Alex Fluor 594 phalloidin were purchased from Molecular Probes (Eugene, OR).
Solutions Artificial seawater (Na-ASW) contained (in mM) 400 NaCl, 10 KCl, 15 4-(2-hydroxyethyl)-1-piperazineethanesulfonic acid (HEPES), 10 CaCl2, and 55 MgCl2 at pH 7.8. Na-AWS was supplemented with 3 mg/ml bovine serum albumin (BSA), 0.5 mM vitamin E (Sigma-Aldrich), and 1 mg/ml carnosine (Sigma-Aldrich) before experiments. The Ca2+ injection buffer consisted of (in mM) 100 potassium aspartate and 10 HEPES at pH 7.4.
Microinjection Microinjection protocol as described previously (Lin and Forscher, 1995). For Ca2+ imaging, neurons were injected with CG-1 and Alexa 647 or Alexa 568 in Ca2+ injection buffer (needle concentration
calcineurin inhibition. Data normalized to rates before 5-HT addition. Data were acquired every 5 or 10 s with 2- to 3-min elapsed recording time. Number of growth cones tested (N) = 10 (CN-AIP, injected, 0.2 mM in needle), 11 (FK-506, 2.5 μM pretreatment for 30 min and presence throughout), or 9 (CsA 1 μM pretreatment for 30 min and presence throughout). Values are expressed as mean ± SEM. (D) Summary of neurite outgrowth 1 h before and after 5-HT addition in various conditions. No pretreatment (control) from Figure 1C is shown for comparison. Control (N = 58), CN-AIP (N = 45), FK-506 (N = 52), and CsA (N = 50). Values are expressed as mean ± SEM. Statistical analysis was done by two-tailed paired t test. *p < 0.001. Volume 23 December 15, 2012
Actin treadmilling and neurite growth | 4843
FIGURE 8: 5-HT increases calcineurin-dependent cofilin activity. (A) Ratio images of phosphorylated vs. total cofilin of growth cones. Cells were treated with vehicle (Na-ASW, left), 5-HT (10 μM, middle) for 30 min or pretreated with FK-506 (2.5 μM) for 30 min, followed by 30 min in 5-HT (10 μM) with the continuous presence of FK-506 (right). Dual labeling of total and phosphorylated apCofilin1 was assessed with R-α-apCofilin1 (1:1000) and Sh-α-P-apCofilin1 (1:100) primary antibodies and Alexa 488 D-α-R (1:100) and Alexa 594 D-α-Sh (1:100) secondary antibodies. Bar, 10 μm. Ratio image is coded by pseudocolors in the linear scale (see scale bar). (B, C) Line scan analysis of the ratio of phosphorylated vs. total
4844 | X.-F. Zhang et al.
Molecular Biology of the Cell
(needle concentration, 20 μM). For simultaneous Ca2+ imaging and actin dynamics, neurons were injected with CG-1, Alexa 647, and Alexa Fluor 594–phalloidin (needle concentration, 11.5 mg/ml, 0.9 mg/ml, and 38 μM, respectively). Reagent or vehicle solution injections were typically ∼10% of cell volume. After microinjection, cells were incubated in Na-ASW 1 h before imaging.
Confocal microscopy Images were acquired using an Andor Revolution XD spinning disk confocal system (Andor, Belfast, United Kingdom) with a CSU-X1 confocal head (Yokogawa, Tokyo, Japan) and mounted on a Nikon TE 2000E inverted microscope with Perfect Focus (Nikon, Melville, NY). Confocal images were acquired using an Andor iXonEM+ 888 electron-multiplying charge-coupled device (CCD) camera. Transillumination was provided by a halogen lamp and controlled by a SmartShutter (Sutter Instrument, Novato, CA). Confocal excitation was provided by an Andor Laser Combiner with three laser lines at 488, 561, and 647 nm. Emission wavelength was controlled using a Sutter LB10W-2800 filter wheel outfitted with bandpass filters from Chroma Technology (Bellows Falls, VT). Image acquisition and all other peripherals were controlled by iQ software (Andor). A Nikon CFI Plan Apo 100×/1.4 numerical aperture (NA) objective was used.
Ca2+ imaging and analysis Fluorescence images of growth cones loaded with the Ca2+ dye CG-1 and volume tracer were obtained using the described Andor confocal microscope. Paired images with comparable intensities of CG-1 and Alexa 568 or Alexa 647 were recorded every 10 s using 300- to 500-ms integration times for Ca2+ signal (488-nm laser line) and 200to 300-ms integration times for the volume signal (561- or 647-nm laser line). The emission fluorescence filters used (denoted as FIGURE 9: Model. (A) Growth on a laminin substrate elevates basal Rac activity levels and center wavelength/bandwidth) were 535/40, supports 5-HT–evoked Ca2+ release from IP3-gated internal stores. Ca2+ release leads to 605/40, and 700/40 nm, respectively calcineurin-dependent cofilin activation, with increased actin filament turnover promoting faster (Chroma Technology). For each paired imnetwork treadmilling. Accelerated network treadmilling can occur independent of myosin II age, Gaussian convolution was used to reactivity; however, 5-HT–dependent increases in neurite outgrowth need myosin II activity. duce noise levels, and a binary mask was (B, C) Schematic and formula showing components that can define retrograde actin flow rate. also used to eliminate noise amplification 10–15 mg/ml for CG-1 and 0.8–0.9 mg/ml for volume tracer). outside the cell. The ratio images (CG-1/volume) were then created For actin dynamics, neurons were injected with Alex 568–G-actin by dividing background-corrected intensity values of CG-1 fluorescence by volume fluorescence and converted into time-lapse (needle concentration, 0.4 mg/ml) or Alexa Fluor 594–phalloidin apCofilin1 fluorescence in growth cones. Scattered dots represent data set from individual growth cones. Solid lines represent the population average. N, growth cones measured. (B) Comparison between cells treated with vehicle (control, red) and cells treated with 5-HT (10 μM, 30min, blue). (C) In FK-506 backgrounds (2.5 μM FK-506 pretreatment for 30 min), comparison between cells treated with vehicle (control, purple) and cells treated with 5-HT (10 μM, 30 min, green) in the continuous presence of FK-506. (D) Quantification of average ratio of phosphorylated vs. total cofilin in sectors 1 and 3 (see inset for schematic) for each condition in B and C. N, growth cones measured. *p < 0.001 with two-tailed unpaired t test. Volume 23 December 15, 2012
Actin treadmilling and neurite growth | 4845
montages for data analysis as reported previously (Zhang and Forscher, 2009). Average pixel intensity values were obtained from the entire area of the growth cones of interest. The Ca2+ changes over time were expressed as ΔF/Fo, where ΔF = Ft − Fo and Fo is the average Ca2+ level sampled during the 3- to 5-min baseline period (before 5-HT addition). ΔF/Fo (%) levels of >10% are considered significant.
separated on 1% agarose gels, and bands of the correct size (∼450 base pairs) were cut out and purified with the QIAquick Gel Extraction Kit (Qiagen, Valencia, CA). Eluted DNA was digested with BamHI and NcoI restriction enzymes (New England BioLabs, Ipswich, MA), ligated into pET15b (Novagen, Gibbstown, NJ) vector digested with the same enzymes, and transformed into DH5α bacteria (Invitrogen) for amplification. Plasmids were confirmed by the Keck DNA Sequencing Facility (Yale University, New Haven, CT).
Quantification of actin dynamics by fluorescent speckle microscopy
Antibody generation
Two methods were used to visualize F-actin for FSM: 1) fluorescently labeled G-actin incorporated into actin filaments and 2) low levels of fluorescent phalloidin, which specifically binds F-actin but not G-actin. Briefly, two-channel images were acquired using 500- to 900-ms integration times for actin fluorescent probe and 120 ms for DIC with 5-or 10-s intervals as previously described (Burnette et al., 2007). Kymography and automated speckle tracking were used to determine rates of F-actin movement. For kymographs, analysis was done as reported (Zhang et al., 2003). For automated flow tracking, an adaptive multiframe correlation algorithm was performed, as described (Ji and Danuser, 2005). For image presentation only, the contrast of F-actin FSM images was enhanced by processing with an unsharp mask, followed by low-pass spatial filters.
Bacterially expressed, recombinant apCofilin1 and apCofilin2 were purified and sent to Proteintech Group (Chicago, IL) for generation of antibodies. apCofilin1 and apCofilin2 antibodies were generated in a rabbit or a guinea pig host against full-length apCofilin1 and apCofilin2, respectively, and were used without affinity purification. Generation of phospho-specific anti-apCofilin1 was performed by 21st Century Biochemicals (Marlboro, MA) from phosphorylated peptide corresponding to the first 11 amino acids of apCofilin1 (PP1). The antibody was generated in a sheep host, affinity depleted against the nonphosphorylated peptide (NP1), and affinity purified with the PP1 peptide. An attempt to generate a phospho-specific anti-apCofilin2 antibody against the first 10 amino acids of apCofilin2 was unsuccessful.
Tandem Ca2+ ratio and F-actin FSM imaging
Western blots
Ratiometric Ca2+ imaging was used to measure Ca2+ levels in the growth cone at the same time as F-actin dynamics was assessed using the methods described. Cells were injected with CG-1, Alexa 647–dextran, and Alex Fluor–594 phalloidin. DIC, Ca2+ level, volume signal, and F-actin were recorded in tandem with 5- or 10-s sampling intervals. CG-1, Alex Fluor 594–phalloidin, and Alexa 647–dextran were excited simultaneously with 488-, 561-, and 647-nm laser lines and emission monitored using 535/40-, 605/40-, and 700/40-nm filters, respectively (Chroma Technology). The F-actin dynamics was quantitatively compared and contrasted with corresponding Ca2+ levels in the growth cone.
Western blots were performed using standard methodology. Protein samples were resolved by SDS–PAGE, transferred to nitrocellulose membranes (Scheicher & Schuell BioScience, Dassel, Germany) by semidry transfer (TransBlot SD; Bio-Rad, Hercules, CA), probed with the indicated primary and secondary antibodies, developed with SuperSignal West Pico Chemiluminescent Substrate (Pierce, Rockford, IL), and digitally exposed using the Epi Chemi II Darkroom (UVP Laboratory Products, Upland, CA). For antigen competition assays, the primary antibody was preincubated with excess antigen for 30 min at 4°C before use; the control was preincubated with buffer. For alkaline phosphatase treatment, the nitrocellulose membranes were incubated in CIP buffer (50 mM Tris-HCl, pH 7.9, 100 mM NaCl, 10 mM MgCl2, 1 mM dithiothreitol) at 37°C for 60 min, with or without 25 U/ml calf intestinal phosphatase (CIP; New England BioLabs). The membranes were washed extensively in TBS-T (50 mM Tris, pH 7.5, 150 mM NaCl, 0.1% Tween-20) and then processed normally.
Neurite outgrowth analysis For long-term time-lapse experiments a Zeiss Axiovert 10 microscope with phase contrast optics (10× Achrostigmat/NA 0.25) and a CoolSnapHQ (Photometrics, Tucson, AZ) cooled CCD camera were used. Hardware and image acquisition were controlled with the open-source μ-Manager device adapter library (www.micromanager .org) through a custom Java user interface. To quantify growth cone advance 1 h before and after 5-HT addition in culture, a Nikon Eclipse TE300 microscope equipped with a Photometrics Quantix 57 backilluminated cooled CCD camera and MetaMorph instrumentation control software were used (Molecular Devices, Sunnyvale, CA). The displacement of growth cone’s leading edge along the presumed growth axis in 1 h was used to depict neurite outgrowth.
Cloning A. californica cofilin1 (apCofilin1) and A. californica cofilin2 (apCofilin2) Primers (apCofilin1for and apCofilin1rev; apCofilin2for and apCofilin2rev) were designed to amplify apCofilin1 and apCofilin2 from cDNA while introducing NcoI sites at the initiation codon and BamHI restriction sites after the stop codon. Extra nucleotides were included outside the restriction sites to allow efficient digestion of PCR products. PCR was performed using Herculase polymerase (Stratagene, Santa Clara, CA). A cDNA library was constructed using mRNA extracted from bag cell neurons. PCR products were 4846 | X.-F. Zhang et al.
Immunocytochemistry In a flow chamber, cells were incubated in Fix (4% Formalin, 400 mM NaCl, 10 mM KCl, 15 mM HEPES, pH 7.8, 10 mM CaCl2, 55 mM MgCl2, and 400 mM sucrose) for 20–30 min and 1% Triton X-100 in Fix for 30 min before three washes with PBS-T (0.1% Triton X-100, 137 mM NaCl, 2.7 mM KCl, 10 mM phosphate, pH 7.5). For antibody labeling, cells were blocked for 30 min in 5% BSA/PBS-T, incubated with primary antibody for 20–30 min in 5% BSA/PBS-T, washed three times in 5% BSA/PBS-T, and incubated for 30 min to 1 h in secondary antibody diluted in 5% BSA/PBS-T. For antigen competition assays, the diluted primary antibody was incubated with 100- to 500-fold excess antigen for 30 min at 4°C with rotation before use. For actin visualization, Alexa 594 or Alexa 488–phalloidin was included in the secondary antibody solution at 0.66 μM. Cells were washed three times in PBS-T and mounted in Mowiol media.
Cofilin line scan analysis Line scans of ratio images of background-corrected intensity values of phosphorylated cofilin divided by total cofilin were used to Molecular Biology of the Cell
analyze the spatial intensity distribution of phosphorylated (inactive) relative to total cofilin. A 50-pixel-wide line was drawn from the leading edge to 1.5× peripheral domain (P domain) width along the presumed growth axis. Average intensity was measured with the plot profile function in ImageJ (National Institutes of Health, Bethesda, MD) and the data exported to Excel (Microsoft, Redmond, WA). Intensity was plotted versus distance normalized by growth cone size for population analysis of line scans. Distance was normalized by setting the beginning (left end) of the lines scan at the leading edge and letting the two-thirds position be the peripheral– central domain interface. Alternatively, to compare phosphorylated cofilin normalized to total cofilin in P domain under different conditions, the peripheral domain was divided into three equal annular sectors parallel to the leading edge, and average intensities in sectors 1 and 3 were calculated (Figure 8D, inset) and compared between different conditions.
ACKNOWLEDGMENTS We thank Gaudenz Danuser (Harvard Medical School, Boston, MA) for providing the actin flow-tracking software and Alex Mogiliner and Austin Elam and Forscher lab members for their comments and insightful discussion of this work. This work was supported by National Institutes of Health Grants RO1-NS28695 and RO1-NS051786 to P.F. and the Nikon Partners-in-Research Program.
REFERENCES
Allingham J, Smith R, Rayment I (2005). The structural basis of blebbistatin inhibition and specificity for myosin II. Nat Struct Mol Biol 12, 378–379. Arie Y, Iketani M, Takamatsu K, Mikoshiba K, Goshima Y, Takei K (2009). Developmental changes in the regulation of calcium-dependent neurite outgrowth. Biochem Biophys Res Commun 379, 11–15. Bae YS, Lee TG, Park JC, Hur JH, Kim Y, Heo K, Kwak JY, Suh PG, Ryu SH (2003). Identification of a compound that directly stimulates phospholipase C activity. Mol Pharmacol 63, 1043–1050. Bodmer D, Ascano M, Kuruvilla R (2011). Isoform-specific dephosphorylation of dynamin1 by calcineurin couples neurotrophin receptor endocytosis to axonal growth. Neuron 70, 1085–1099. Bradke F, Dotti CG (1999). The role of local actin instability in axon formation. Science 283, 1931–1934. Briancon-Marjollet A et al. (2008). Trio mediates netrin-1-induced Rac1 activation in axon outgrowth and guidance. Mol Cell Biol 28, 2314–2323. Bridgman P, Dave S, Asnes C, Tullio A, Adelstein R (2001). Myosin IIB is required for growth cone motility. J Neurosci 21, 6159–6169. Burnette D, Schaefer A, Ji L, Danuser G, Forscher P (2007). Filopodial actin bundles are not necessary for microtubule advance into the peripheral domain of Aplysia neuronal growth cones. Nat Cell Biol 9, 1360–1369. Cai D, Chen S, Glanzman D (2008). Postsynaptic regulation of long-term facilitation in Aplysia. Curr Biol 18, 920–925. Campbell DS, Holt CE (2001). Chemotropic responses of retinal growth cones mediated by rapid local protein synthesis and degradation. Neuron 32, 1013–1026. Chang HY, Takei K, Sydor AM, Born T, Rusnak F, Jay DG (1995). Asymmetric retraction of growth cone filopodia following focal inactivation of calcineurin. Nature 376, 686–690. Cheng S, Geddis MS, Rehder V (2002). Local calcium changes regulate the length of growth cone filopodia. J Neurobiol 50, 263–275. Craig EM, Van Goor D, Forscher P, Mogilner A (2012). Membrane tension, myosin force, and actin turnover maintain actin treadmill in the nerve growth cone. Biophys J 102, 1503–1513. DesMarais V, Ghosh M, Eddy R, Condeelis J (2005). Cofilin takes the lead. J Cell Sci 118, 19–26. Dropic A, Brailoiu E, Cooper R (2005). Presynaptic mechanism of action induced by 5-HT in nerve terminals: possible involvement of ryanodine and IP3 sensitive 2 +stores. Comp Biochem Physiol A Mol Integr Physiol 142, 355–361. Endo M, Ohashi K, Sasaki Y, Goshima Y, Niwa R, Uemura T, Mizuno K (2003). Control of growth cone motility and morphology by LIM kinase and Slingshot via phosphorylation and dephosphorylation of cofilin. J Neurosci 23, 2527–2537. Volume 23 December 15, 2012
Ferreira A, Kincaid R, Kosik KS (1993). Calcineurin is associated with the cytoskeleton of cultured neurons and has a role in the acquisition of polarity. Mol Biol Cell 4, 1225–1238. Figge C, Loers G, Schachner M, Tilling T (2011). Neurite outgrowth triggered by the cell adhesion molecule L1 requires activation and inactivation of the cytoskeletal protein cofilin. Mol Cell Neurosci 49, 196–204. Forscher P, Kaczmarek L, Buchanan J, Smith S (1987). Cyclic AMP induces changes in distribution and transport of organelles within growth cones of Aplysia bag cell neurons. J Neurosci 7, 3600–3611. Fruman DA, Klee CB, Bierer BE, Burakoff SJ (1992). Calcineurin phosphatase activity in T lymphocytes is inhibited by FK 506 and cyclosporin A. Proc Natl Acad Sci USA 89, 3686–3690. Gafni J, Munsch J, Lam T, Catlin M, Costa L, Molinski T, Pessah I (1997). Xestospongins: potent membrane permeable blockers of the inositol 1,4,5-trisphosphate receptor. Neuron 19, 723–733. Gallo G, Yee HJ, Letourneau P (2002). Actin turnover is required to prevent axon retraction driven by endogenous actomyosin contractility. J Cell Biol 158, 1219–1228. Gao Y, Dickerson J, Guo F, Zheng J, Zheng Y (2004). Rational design and characterization of a Rac GTPase-specific small molecule inhibitor. Proc Natl Acad Sci USA 101, 7618–7623. Gehler S, Shaw AE, Sarmiere PD, Bamburg JR, Letourneau PC (2004). Brain-derived neurotrophic factor regulation of retinal growth cone filopodial dynamics is mediated through actin depolymerizing factor/ cofilin. J Neurosci 24, 10741–10749. Ghosh M, Song X, Mouneimne G, Sidani M, Lawrence D, Condeelis J (2004). Cofilin promotes actin polymerization and defines the direction of cell motility. Science 304, 743–746. Giannone G, Mege RM, Thoumine O (2009). Multi-level molecular clutches in motile cell processes. Trends Cell Biol 19, 475–486. Gordeeva AV, Zvyagilskaya RA, Labas YA (2003). Cross-talk between reactive oxygen species and calcium in living cells. Biochem Biokhim 68, 1077–1080. Grabham P, Reznik B, Goldberg D (2003). Microtubule and Rac 1-dependent F-actin in growth cones. J Cell Sci 116, 3739–3748. Groth RD, Dunbar RL, Mermelstein PG (2003). Calcineurin regulation of neuronal plasticity. Biochem Biophys Res Commun 311, 1159–1171. Gruenbaum L, Carew T (1999). Growth factor modulation of substratespecific morphological patterns in Aplysia bag cell neurons. Learn Mem 6, 292–306. Guha M, Zhou M, Wang YL (2005). Cortical actin turnover during cytokinesis requires myosin II. Curr Biol 15, 732–736. Hashimoto Y, Perrino BA, Soderling TR (1990). Identification of an autoinhibitory domain in calcineurin. J Biol Chem 265, 1924–1927. Hatada Y, Wu F, Sun Z, Schacher S, Goldberg D (2000). Presynaptic morphological changes associated with long-term synaptic facilitation are triggered by actin polymerization at preexisting varicositis. J Neurosci 20, RC82. Haviv L, Gillo D, Backouche F, Bernheim-Groswasser A (2008). A cytoskeletal demolition worker: myosin II acts as an actin depolymerization agent. J Mol Biol 375, 325–330. Heidemann SR, Buxbaum RE (1994). Mechanical tension as a regulator of axonal development. Neurotoxicology 15, 95–107. Heidemann SR, Lamoureux P, Buxbaum RE (1995). Cytomechanics of axonal development. Cell Biochem Biophys 27, 135–155. Henson J, Svitkina T, Burns A, Hughes H, MacPartland K, Nazarian R, Borisy G (1999). Two components of actin-based retrograde flow in sea urchin coelomocytes. Mol Biol Cell 10, 4075–4090. Hu K, Ji L, Applegate K, Danuser G, Waterman-Storer C (2007). Differential transmission of actin motion within focal adhesions. Science 315, 111–115. Ji L, Danuser G (2005). Tracking quasi-stationary flow of weak fluorescent signals by adaptive multi-frame correlation. J Microsc 220, 150–167. Jin W, Lo T, Loh H, Thayer S (1994). U73122 inhibits phospholipase C-dependent calcium mobilization in neuronal cells. Brain Res 642, 237–243. Kamm K, Stull J (2001). Dedicated myosin light chain kinases with diverse cellular functions. J Biol Chem 276, 4527–4530. Kennedy TE, Serafini T, de la Torre JR, Tessier-Lavigne M (1994). Netrins are diffusible chemotropic factors for commissural axons in the embryonic spinal cord. Cell 78, 425–435. Kiuchi T, Ohashi K, Kurita S, Mizuno K (2007). Cofilin promotes stimulusinduced lamellipodium formation by generating an abundant supply of actin monomers. J Cell Biol 177, 465–476. Kuhn T, Brown M, Bamburg J (1998). Rac1-dependent actin filament organization in growth cones is necessary for beta1-integrin-mediated advance but not for growth on poly-D-lysine. J Neurobiol 37, 524–540. Actin treadmilling and neurite growth | 4847
Laforest S, Milanini J, Parat F, Thimonier J, Lehmann M (2005). Evidences that beta1 integrin and Rac1 are involved in the overriding effect of laminin on myelin-associated glycoprotein inhibitory activity on neuronal cells. Mol Cell Neurosci 30, 418–428. Lautermilch NJ, Spitzer NC (2000). Regulation of calcineurin by growth cone calcium waves controls neurite extension. J Neurosci 20, 315–325. Li L, Hutchins BI, Kalil K (2009). Wnt5a induces simultaneous cortical axon outgrowth and repulsive axon guidance through distinct signaling mechanisms. J Neurosci 29, 5873–5883. Li Q, Roberts A, Glanzman D (2005). Synaptic facilitation and behavioral dishabituation in Aplysia: dependence on release of Ca2+ from postsynaptic intracellular stores, postsynaptic exocytosis, and modulation of postsynaptic AMPA receptor efficacy. J Neurosci 25, 5623–5637. Li X, Giot J, Kuhl D, Hen R, Kandel E (1995). Cloning and characterization of two related serotonergic receptors from the brain and the reproductive system of Aplysia that activate phospholipase C. J Neurosci 15, 7585–7591. Lin C, Forscher P (1995). Growth cone advance is inversely proportional to retrograde F-actin flow. Neuron 14, 763–771. Lin CH, Espreafico EM, Mooseker MS, Forscher P (1996). Myosin drives retrograde F-actin flow in neuronal growth cones. Neuron 16, 769–782. Liu J, Farmer JD Jr, Lane WS, Friedman J, Weissman I, Schreiber SL (1991). Calcineurin is a common target of cyclophilin-cyclosporin A and FKBPFK506 complexes. Cell 66, 807–815. Marsick BM, Flynn KC, Santiago-Medina M, Bamburg JR, Letourneau PC (2010). Activation of ADF/cofilin mediates attractive growth cone turning toward nerve growth factor and netrin-1. Dev Neurobiol 70, 565–588. Matsuo N, Terao M, Nabeshima Y, Hoshino M (2003). Roles of STEF/Tiam1, guanine nucleotide exchange factors for Rac1, in regulation of growth cone morphology. Mol Cell Neurosci 24, 69–81. Meberg PJ, Bamburg JR (2000). Increase in neurite outgrowth mediated by overexpression of actin depolymerizing factor. J Neurosci 20, 2459–2469. Medeiros N, Burnette D, Forscher P (2006). Myosin II functions in actin-bundle turnover in neuronal growth cones. Nat Cell Biol 8, 215–226. Ming G, Lohof AM, Zheng JQ (1997). Acute morphogenic and chemotropic effects of neurotrophins on cultured embryonic Xenopus spinal neurons. J Neurosci 17, 7860–7871. Mitchison T, Kirschner M (1988). Cytoskeletal dynamics and nerve growth. Neuron 1, 761–772. Mogilner A, Oster G (2003). Polymer motors, pushing out the front and pulling up the back. Curr Biol 13, R721–733. Murthy K, Wadsworth P (2005). Myosin-II-dependent localization and dynamics of F-actin during cytokinesis. Curr Biol 15, 724–731. Ng J, Luo L (2004). Rho GTPases regulate axon growth through convergent and divergent signaling pathways. Neuron 44, 779–793. Nguyen T, Di Giovanni S (2008). NFAT signaling in neural development and axon growth. Int J Dev Neurosci 26, 141–145. Pandey D, Goyal P, Siess W (2007). Lysophosphatidic acid stimulation of platelets rapidly induces Ca2+-dependent dephosphorylation of cofilin that is independent of dense granule secretion and aggregation. Blood Cells Mol Dis 38, 269–279. Papusheva E, Heisenberg CP (2010). Spatial organization of adhesion, forcedependent regulation and function in tissue morphogenesis. EMBO J 29, 2753–2768. Perrino BA, Ng LY, Soderling TR (1995). Calcium regulation of calcineurin phosphatase activity by its B subunit and calmodulin. Role of the autoinhibitory domain. J Biol Chem 270, 340–346. Pollard T, Borisy G (2003). Cellular motility driven by assembly and disassembly of actin filaments. Cell 112, 453–465. Renkawitz J, Schumann K, Weber M, Lämmermann T, Pflicke H, Piel M, Polleux J, Spatz J, Sixt M (2009). Adaptive force transmission in amoeboid cell migration. Nat Cell Biol 11, 1438–1443. Rosner H, Moller W, Wassermann T, Mihatsch J, Blum M (2007). Attenuation of actinomyosinII contractile activity in growth cones accelerates
4848 | X.-F. Zhang et al.
filopodia-guided and microtubule-based neurite elongation. Brain Res 1176, 1–10. Ruchhoeft M, Harris W (1997). Myosin functions in Xenopus retinal ganglion cell growth cone motility in vivo. J Neurobiol 32, 567–578. Schaefer AW, Schoonderwoert VT, Ji L, Mederios N, Danuser G, Forscher P (2008). Coordination of actin filament and microtubule dynamics during neurite outgrowth. Dev Cell 15, 146–162. Schmidt J, Morgan P, Dowell N, Leu B (2002). Myosin light chain phosphorylation and growth cone motility. J Neurobiol 52, 175–188. Sotogaku N, Tully SE, Gama CI, Higashi H, Tanaka M, Hsieh-Wilson LC, Nishi A (2007). Activation of phospholipase C pathways by a synthetic chondroitin sulfate-E tetrasaccharide promotes neurite outgrowth of dopaminergic neurons. J Neurochem 103, 749–760. Straight A, Cheung A, Limouze J, Chen I, Westwood N, Sellers J, Mitchison T (2003). Dissecting temporal and spatial control of cytokinesis with a myosin II Inhibitor. Science 299, 1743–1747. Suter DM, Forscher P (1998). An emerging link between cytoskeletal dynamics and cell adhesion molecules in growth cone guidance. Curr Opin Neurobiol 8, 106–116. Suter DM, Forscher P (2000). Substrate-cytoskeletal coupling as a mechanism for the regulation of growth cone motility and guidance. J Neurobiol 44, 97–113. Suter DM, Forscher P (2001). Transmission of growth cone traction force through apCAM-cytoskeletal linkages is regulated by Src family tyrosine kinase activity. J Cell Biol 155, 427–438. Tahirovic S, Bradke F (2009). Neuronal polarity. Cold Spring Harb Perspect Biol 1, a001644. Tucker B, Rahimtula M, Mearow K (2005). Integrin activation and neurotrophin signaling cooperate to enhance neurite outgrowth in sensory neurons. J Comp Neurol 486, 267–280. Turney SG, Bridgman PC (2005). Laminin stimulates and guides axonal outgrowth via growth cone myosin II activity. Nat Neurosci 8, 717–719. Udo H, Jin I, Kim J, Li H, Youn T, Hawkins R, Kandel E, Bailey C (2005). Serotonin-induced regulation of the actin network for learning-related synaptic growth requires Cdc42, N-WASP, and PAK in Aplysia sensory neurons. Neuron 45, 887–901. Van Goor D, Hyland C, Schaefer AW, Forscher P (2012). The role of actin turnover in retrograde actin network flow in neuronal growth cones. PloS One 7, e30959. Wang Y, Shibasaki F, Mizuno K (2005). Calcium signal-induced cofilin dephosphorylation is mediated by Slingshot via calcineurin. J Biol Chem 280, 12683–12689. Woo S, Gomez T (2006). Rac1 and RhoA promote neurite outgrowth through formation and stabilization of growth cone point contacts. J Neurosci 26, 1418–1428. Yang Q, Zhang XF, Pollard TD, Forscher P (2012). Arp2/3 complex-dependent actin networks constrain myosin II function in driving retrograde actin flow. J Cell Biol 197, 939–956. Zhang X, Forscher P (2009). Rac1 modulates stimulus-evoked Ca(2+) release in neuronal growth cones via parallel effects on microtubule/endoplasmic reticulum dynamics and reactive oxygen species production. Mol Biol Cell 20, 3700–3712. Zhang X, Schaefer A, Burnette D, Schoonderwoert V, Forscher P (2003). Rho-dependent contractile responses in the neuronal growth cone are independent of classical peripheral retrograde actin flow. Neuron 40, 931–944. Zhao R, Du L, Huang Y, Wu Y, Gunst S (2008). Actin depolymerization factor/cofilin activation regulates actin polymerization and tension development in canine tracheal smooth muscle. J Biol Chem 283, 36522–36531. Zheng J, Lamoureux P, Santiago V, Dennerll T, Buxbaum RE, Heidemann SR (1991). Tensile regulation of axonal elongation and initiation. J Neurosci 11, 1117–1125. Zhou F, Cohan C (2001). Growth cone collapse through coincident loss of actin bundles and leading edge actin without actin depolymerization. J Cell Biol 153, 1071–1084. Zhou W, Sugioka M, Yamashita M (1999). Lysophosphatidic acid-induced Ca(2+) mobilization in the neural retina of chick embryo. J Neurobiol 41, 495–504.
Molecular Biology of the Cell