RESEARCH REPORTS Clinical
M. Kebschull1,7, P. Guarnieri2, 3, R.T. Demmer4, A.L. Boulesteix5, P. Pavlidis6, and P.N. Papapanou1* 1
Division of Periodontics, Section of Oral and Diagnostic Sciences, Columbia University College of Dental Medicine, New York, NY, USA; 2 Biomedical Informatics Shared Resources, Bioinformatics Division, Herbert Irving Comprehensive Cancer Center; 3Columbia Initiative in Systems Biology, Columbia University Medical Center, New York, NY, USA; 4Department of Epidemiology, Mailman School of Public Health, Columbia University, New York, NY, USA; 5Computational Molecular Medicine Research Group, Department of Medical Informatics, Biometry and Epidemiology, University of Munich, Munich, Germany; 6UBC Centre for High-Throughput Biology, Michael Smith Laboratories, University of British Columbia, Vancouver, BC, Canada; and 7Present address, Department of Periodontology, Operative and Preventive Dentistry, University of Bonn, Bonn, Germany; *corresponding author,
[email protected]
Molecular Differences between Chronic and Aggressive Periodontitis
J Dent Res DOI: 10.1177/0022034513506011
Appendix Materials & Methods The design and procedures of the study were approved by the Columbia University Institutional Review Board (Columbia University Medical Center IRB approval #AAAB0896). We have previously reported on this study population, or subgroups of it, in reports focusing on gene expression in healthy and diseased gingival tissues (Demmer et al., 2008; Kebschull et al., 2009), gene expression and the corresponding subgingival microbial profiles (Papapanou et al., 2009), and gene expression and the expression of targeting miRNAs (Stoecklin-Wasmer et al., 2012).
Participants In total, 120 individuals with moderate to severe periodontitis (65 with chronic and 55 with aggressive periodontitis) were recruited among the patients referred for periodontal therapy to the Clinic for Post-doctoral Periodontics, Columbia University College of Dental Medicine. Eligible patients: (i) were at least 13 yrs old; (ii) had a minimum of 24 teeth present; (iii) had no past history of systematic periodontal therapy other than occasional prophylaxis provided by the referring general dentist; (iv) had received no systemic antibiotics or anti-inflammatory drugs for at least 6 mos; (v) harbored a minimum of 4 teeth with radiographic bone loss; (vi) did not suffer from diabetes mellitus; (vii) did not suffer from any of the systemic conditions or genetic disorders that entail a diagnosis of “Periodontitis as a manifestation of systemic diseases” (Lindhe et al., 1999b); (viii) were not pregnant, and (ix) were not current users of tobacco
products or of nicotine replacement medication. Signed informed consent was obtained prior to enrollment.
Clinical Examination and Assignment of Periodontal Diagnosis All participants underwent a full-mouth examination of the periodontal tissues by a calibrated examiner using a manual probe at 6 sites per tooth. The examination included assessments of the presence/absence of dental plaque and bleeding on probing (BoP), and linear measurements of probing pocket depth (PPD) and clinical attachment level (CAL). All data were entered chair-side into a computer and stored at a central server. Two periodontists jointly reviewed the radiographic and clinical records of each patient, re-examined the patients as needed, and assigned a consensus diagnosis of either chronic or aggressive periodontitis according to the established criteria (Armitage, 1999). Specifically, aggressive periodontitis patients were required to: (i) be systemically healthy; (ii) display a severity of disease disproportionate to the amount of local etiologic factors; and (iii) show evidence of rapid attachment loss and bone loss either with respect to their age, or based on comparisons of available sets of clinical or radiographic records obtained at different time-points. In addition, a reported history of familial aggregation of periodontal disease was interpreted as strongly suggestive of aggressive periodontitis. In all other cases, a diagnosis of chronic periodontitis was assigned. Following the assignment of diagnosis, patients were further subdivided, according to the extent of attachment and bone loss, into a localized or a generalized periodontitis subgroup. Thus, in
DS1
DS2
Kebschull et al.
J Dent Res
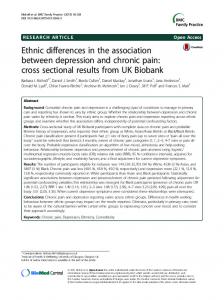
Appendix Figure 1. Microarray classifier distinction of gingival lesions from AgP and CP – DLDA algorithm with different feature set sizes. For each of the 1,000 splittings into training/evaluation sets, a diagonal linear discriminant analysis (DLDA) classifier algorithm was trained based on the training set to distinguish AgP from CP gingival lesions with either 5, 10, 50, 100, 250, 500, 750, 1,000, 2,500, or 5,000 genes. Performance of the algorithms in the classification of the corresponding evaluation datasets was then assessed by the sensitivity and specificity of AgP detection, as well as by (ROC) area under the curve (AUC) (a). In addition, for each number of features, a ROC curve was generated for a representative iteration (b). The long straight slanting lines in the ROC curves are due to ties in the probabilities output generated by the CMA package. Use of discriminants instead of probabilities produced slightly different results that do not affect our conclusions. The DLDA algorithm showed an optimal performance with a 50-gene signature, with larger signatures resulting in inferior performance, possibly due to increasing noise.
Molecular Differences between CP and AgP DS3 DLDA 5 genes
DLDA 10 genes 1.0
0.8
0.8
0.8
0.4
1−specificity
0.8
0.8
0.8
0.6 0.4
0.4 0.2
1−specificity
DLDA 750 genes
DLDA 1,000 genes
DLDA 2,500 genes
0.8
0.8
0.2
1−specificity DLDA 5,000 genes
1−specificity
1.0
Sensitivity
0.8 0.6 0.4 0.2
1−specificity
Appendix Figure 1. (continued)
1.0
0.8
0.4
0.2
0.0
0.6
AUC=0.622
0.0
1.0
0.4
1.0
0.6
0.4
0.2
0.0
1−specificity
AUC=0.642
0.0
0.8
AUC=0.675
0.0 1.0
0.8
0.6
0.4
0.0
0.4
0.6
0.2 AUC=0.685
0.8
0.2
0.4
0.6
0.2
0.4
0.6
0.0
0.6
Sensitivity
0.8 Sensitivity
1.0
1.0
0.8
1−specificity
1.0
0.2
0.2
0.0
1−specificity
1.0
0.0
AUC=0.706
0.0 1.0
0.6
0.4
0.2
0.0
0.0
0.8
AUC=0.755
1.0
0.8
0.6
0.4
0.2
0.6
0.6
0.2 AUC=0.824 0.0
Sensitivity
Sensitivity
1.0
Sensitivity
1.0
0.2
1.0
DLDA 500 genes
1.0
0.4
0.8
1−specificity
DLDA 250 genes
0.6
0.6
0.0
1−specificity
DLDA 100 genes
0.0
AUC=0.854
0.0
1.0
0.6
0.4
0.2
0.0
0.0
0.8
AUC=0.827
1.0
0.8
0.6
0.4
0.2
0.0
0.0
0.4 0.2
0.2 AUC=0.784
0.6
0.4
0.4
0.6
0.2
0.6
Sensitivity
1.0
0.2
Sensitivity
DLDA 50 genes
1.0
Sensitivity
Sensitivity
(b)
0.4
J Dent Res
DS4
Kebschull et al.
J Dent Res
Appendix Figure 2. Microarray classifier distinction of gingival lesions from AgP and CP – PLS-LSA algorithm with different feature set sizes. For each of the 1,000 splittings into training/evaluation sets, partial least-squares dimension reduction followed by linear discriminant analysis (PLSLDA) was trained based on the training to distinguish AgP from CP gingival lesions with gene signatures of 10, 50, 100, 250, 500, 750, 1,000, 2,500, or 5,000 genes specific to the individual learning set. Performance of the algorithms in the classification of the corresponding evaluation datasets was then assessed by the sensitivity and specificity of AgP detection, as well as by (ROC) area under the curve (AUC) (a). In addition, for each number of features, a ROC curve was generated for a representative iteration (b). The PLS-LDA algorithm showed improving performance with increasing signature size.
Molecular Differences between CP and AgP DS5
PLS−LDA 10 genes
PLS−LDA 50 genes 1.0
0.8
0.8
0.8
0.2
1−specificity
1−specificity
PLS−LDA 250 genes
PLS−LDA 500 genes
PLS−LDA 750 genes
0.8
0.8
0.8
1−specificity PLS−LDA 5,000 genes 1.0
0.8
0.8
0.8
0.4 0.2
1−specificity
Appendix Figure 2. (continued)
0.6 0.4 0.2
1−specificity
1−specificity
1.0
0.8
0.6
AUC=0.973
0.0 1.0
0.4
0.2
0.0
0.8
AUC=0.974
0.0 1.0
0.6
0.4
0.2
0.0
0.8
AUC=0.978
0.6
0.2
0.6
0.4
0.4
Sensitivity
1.0
Sensitivity
1.0
0.6
1.0
PLS−LDA 2,500 genes
0.8
PLS−LDA 1,000 genes
0.4
1−specificity
0.0
1−specificity
AUC=0.978
0.0 1.0
0.8
0.4
0.2
0.0
1.0
0.8
0.6
0.4
0.2
0.0
0.0
0.6
0.0
0.2 AUC=0.975
0.6
0.2
AUC=0.968
0.4
0.2
0.2
0.4
0.6
0.2
0.4
0.6
0.0
0.6
Sensitivity
1.0
Sensitivity
1.0
1.0
0.0
1−specificity
1.0
0.0
AUC=0.948
0.0 1.0
0.8
0.4
0.2
0.0
0.6
AUC=0.926
0.0 1.0
0.8
0.6
0.4
0.2
0.0
0.4
0.8
0.2 AUC=0.834
0.0
Sensitivity
0.4
0.6
0.6
0.4
0.6
0.2
0.6
Sensitivity
1.0
0.2
Sensitivity
PLS−LDA 100 genes
1.0
Sensitivity
Sensitivity
(b)
0.4
J Dent Res
DS6
Kebschull et al.
J Dent Res
Appendix Figure 3. Microarray classifier distinction of gingival lesions from AgP and CP – SVM algorithm with different feature set sizes. For each of the 1,000 splittings into training/evaluation sets, a support vector machine (SVM) classifier algorithm was trained based on the training set to distinguish AgP from CP gingival lesions with either 5, 10, 50, 100, 250, 500, 750, 1,000, 2,500, or 5,000 genes. Performance of the algorithms in the classification of the corresponding evaluation datasets was then assessed by the sensitivity and specificity of AgP detection, as well as by (ROC) area under the curve (AUC) (a). In addition, for each number of features, a ROC curve was generated for a representative iteration (b). The SVM algorithm showed improving performance with increasing signature size.
Molecular Differences between CP and AgP DS7 SVM 5 genes
SVM 10 genes 1.0
0.8
0.8
0.8
0.2
1−specificity
1−specificity
SVM 250 genes
SVM 500 genes
1.0
1.0
0.2
1−specificity
1−specificity
1−specificity
SVM 1,000 genes
SVM 2,500 genes
1.0
1.0
1−specificity
Sensitivity
0.8 0.6 0.4 0.2
1−specificity
1.0
0.8
0.4
0.2
0.0
0.6
AUC=0.99
0.0
1.0
0.8
0.4
1−specificity
SVM 5,000 genes
1.0
AUC=0.987
0.0 1.0
0.8
0.4
0.2
0.0
1−specificity
Appendix Figure 3. (continued)
1.0
0.2 AUC=0.982
0.0 1.0
0.8
0.6
0.4
0.0
0.4
0.6
0.2 AUC=0.979
0.6
0.2
0.4
0.6
0.2
0.4
0.6
0.0
0.6
0.8 Sensitivity
Sensitivity
0.8
1.0
0.8
0.6
0.4
1.0
0.8
0.4
0.2
0.0
AUC=0.975
0.0
SVM 750 genes
0.8
0.2
0.4 0.2
AUC=0.965
0.0 1.0
0.6
0.4
0.2
0.0
0.0
0.8
AUC=0.938
0.6
0.2
0.4
0.6
0.2
0.4
0.6
0.0
0.6
0.8 Sensitivity
Sensitivity
0.8
0.0
0.8
1−specificity SVM 100 genes
0.8
1.0
AUC=0.912
0.0 1.0
0.8
0.4
0.2
0.0
0.6
AUC=0.832
0.0 1.0
0.8
0.6
0.4
0.2
0.0 1.0
0.4
0.6
0.2 AUC=0.784
0.0
Sensitivity
0.4
0.6
0.2
0.4
0.6
0.0
0.6
Sensitivity
1.0
0.2
Sensitivity
SVM 50 genes
1.0
Sensitivity
Sensitivity
(b)
0.4
J Dent Res
DS8
Kebschull et al.
J Dent Res
Appendix Table 1. General Characteristics of the Study Participants (n = 120) (data presented as means or % ± SD plus range) Characteristic N (patients) N (biopsies) Age (yrs) Female Race (n, % of group) Black White Asian Mixed Other Declined to report Ethnicity (n, % of group) Hispanic Non-Hispanic Declined to report Periodontal parameters Participants with localized disease Number of teeth Sites with bleeding on probing (%) Mean plaque index (%) Probing depth (mm) Number of sites with PD ≥ 5 mm Clinical attachment level (mm) Number of sites with CAL ≥ 5 mm
Aggressive Periodontitis
Chronic Periodontitis
55 136 34.1 ± 11.7 (11–64) 27 (49.1%)
65 174 45.7 ± 11.6 (24-76) 32 (49.2%)
15 (27.3%) 22 (40%) 2 (3.6%) 12 (21.8%) 4 (7.3%) 0
11 25 1 21 3 4
(16.9%) (38.5%) (1.5%) (32.3%) (4.6%) (6.2%)
36 (65.5%) 17 (30.9%) 2 (3.6%)
52 (80%) 13 (20%) 0
18 (32.7%) 29.0 ± 2.6 (22-32) 69 ± 21 (21-100) 91.1 ± 8.4 (60-100) 4.4 ± 1.0 (2.9-8.3) 70.5 ± 34.0 (12-179) 4.8 ± 1.3 (3.0-8.7) 73.8 ± 36.8 (11-177)
38 (58.5%) 27.8 ± 2.3 (21-32) 69 ± 18 (32-100) 91.0 ± 8.5 (49-100) 3.7 ± 0.6 (2.9-5.3) 50.3 ± 18.9 (19-101) 4.0 ± 0.8 (2.7-6.3) 49.8 ± 24.7 (10-133)
cases of aggressive periodontitis, participants displaying attachment and bone loss at more than 2 teeth other than incisors and first molars were regarded as suffering from generalized aggressive periodontitis (Lang et al., 1999). Likewise, in cases of chronic periodontitis, participants displaying periodontal lesions at more than 30% of their tooth sites were regarded as suffering from generalized chronic periodontitis (Lindhe et al., 1999a).
Gingival Tissue Donor Areas and Tissue Sample Collection Specially developed software identified periodontally ‘diseased’ and ‘healthy’ tooth sites based on the collected clinical data. ‘Diseased’ sites showed BoP, an interproximal PPD of ≥ 4 mm, and a concomitant CAL of ≥ 3 mm. ‘Healthy’ sites showed no BoP, PPD of ≤ 4 mm, and CAL of ≤ 2 mm. Next, the software identified: (i) maxillary ‘diseased’ or ‘healthy’ interdental papillae, based on the above criteria; and (ii) pairs of ‘diseased’ interdental papillae with similar clinical presentation, i.e., with PPD and CAL within 2 mm of each other. A posterior maxillary sextant encompassing a pair of qualifying ‘diseased’ interdental papillae was identified. Periodontal surgery was performed at the identified sextant without any prior supra- or subgingival instrumentation. After infiltration with an appropriate local anesthetic, submarginal incisions were performed, mucoperiosteal flaps were reflected,
and the portion of each interproximal gingival papilla that adhered to the root surface was carefully dissected. This section was comprised of the ulcerated epithelial lining of the interproximal periodontal pockets and a portion of the underlying connective tissue. After dissection, the obtained gingival tissue specimens were thoroughly rinsed with sterile normal saline solution and transferred into Eppendorf tubes containing 5 vol of an RNA stabilization reagent (RNAlater, Ambion, Austin, TX, USA). At least 2 diseased papillae were harvested from each sextant, and, whenever available, a healthy periodontal tissue specimen was obtained from an adjacent site. After collection of the gingival tissue specimens, pocket elimination/ reduction periodontal surgery was completed according to standard procedures. All patients received additional periodontal therapy according to their individual needs.
Microarray Sample Preparation and Hybridization The harvested gingival tissue samples were subjected to transcriptomic analysis, as described earlier (Kebschull and Papapanou, 2010). In brief, total RNA was isolated, in vitro transcribed and biotin labeled, and analyzed on Affymetrix Human Genome U-133 Plus 2.0 arrays. Hybridizations, probe array scanning, and gene expression analysis were performed at the Gene Chip Core Facility at the Columbia University Genome Center, according to the manufacturer’s specifications.
J Dent Res
Molecular Differences between CP and AgP DS9
Appendix Table 2. Characteristics of the Assayed Gingival Tissue Biopsies Aggressive Periodontitis Characteristic N (biopsies) Mean probing depth (mm) Mean clinical attachment level (mm)
Chronic Periodontitis
‘Healthy’
‘Diseased’
‘Healthy’
‘Diseased’
25 2.3 ± 0.6 (1-4) 2.9 ± 1.7 (1-7)
111 7.6 ± 1.9 (4-11) 8.3 ± 3.1 (3-18)
44 2.3 ± 0.5 (2-4) 2.6 ± 1.2 (2-7)
130 5.7 ± 1.4 (4-10) 5.5 ± 1.6 (3-12)
Microarray Data Pre-processing Assessment of signal intensities and subsequent statistical analyses were performed within the R/Bioconductor statistical framework. Quality control and pre-processing of raw data were performed with limma (Smyth, 2004; Smyth et al., 2005). Specifically, for each individual array, standard Affymetrix metrics were evaluated. Subsequently, all arrays were assessed for outliers by visual inspection of the ensemble relative log expression (RLE) and normalized unscaled standard error (NUSE) plots (Brettschneider et al., 2008). Finally, expression intensities of the arrays that passed quality control were background-corrected, normalized, and summarized with the Robust Multi-array Algorithm (RMA) (Bolstad et al., 2003). Experimental details and results following the MIAME (minimal information about a microarray experiment) standards (Brazma et al., 2001) are available at the Gene Expression Omnibus (GEO, http:// www.ncbi.nlm.nih.gov/geo/) under accession number GSE16134.
Differential Expression Analysis Quality-controlled, RMA-normalized data were corrected for batch effects with ComBat (Johnson et al., 2007) and analyzed for differential expression with R/Bioconductor and limma (Smyth, 2004) to identify differentially expressed probe sets after correction for multiple testing with the BenjaminiHochberg False-Discovery Rate (FDR) (Benjamini and Hochberg, 1995) and Bonferroni procedures (Storey and Tibshirani, 2003). In these analyses, patients were modeled as random effects to account for the high correlation of multiple samples from the same individual.
Functional Analysis The resulting ranked gene lists were analyzed for enrichment of functional groups by gene set enrichment analysis (GSEA) 2.0.10 (Subramanian et al., 2005) and the Broad Institute’s Molecular Signatures Database collection C2, containing 4,722 curated gene sets. GSEA results at p < .05 were visualized with Cytoscape 2.8.3 (Shannon et al., 2003) and the plugin Enrichment Map (Merico et al., 2011). Cytoscape-generated networks were further modified in Adobe Illustrator CS6.
Supervised Classification For the supervised classification, several class prediction algorithms were applied with CP/AgP as the dependent variable.
Their prediction accuracy was evaluated as implemented in the CMA package 1.19.2 (Slawski et al., 2008). First, the available patients (n = 120, contributing a total of 241 ‘diseased’ biopsies) were randomly assigned to either the training group (consisting of 2/3 of all patients) or the evaluation group (the remaining patients). The training set was then populated with all samples belonging to the patients assigned to the training group, while the evaluation set consisted of all samples from patients assigned to the evaluation group. This procedure ensured that the evaluation of the classifiers was performed based on samples from patients who were not used for training, a necessary condition for reliable accuracy estimates to be obtained. The splitting procedure was repeated 1,000 times, i.e., 1,000 random partitions into training/evaluation sets were successively generated. For each partition into training/evaluation set, selection of features (i.e., genes) that could best distinguish between the 2 entities was performed with limma’s moderated t statistics (Smyth, 2004) applied to the respective training set only while ignoring the evaluation set, according to well-known ‘good practice’ guidelines (Ambroise and McLachlan, 2002; Dupuy and Simon, 2007). Different classifier algorithms were then applied to the training set with the top-ranking features as predictors, whereby the number of considered top-ranking features was successively set to 5, 10, 50, 100, 250, 500, 750, 1,000, 2,500, and 5,000. Several candidate classifiers were considered successively: (i) diagonal linear discriminant analysis (DLDA); (ii) partial least-squares (PLS) analysis in combination with linear discriminant analysis (PLS-LDA), with the number of PLS components as the tuning parameter; (iii) shrunken centroids discriminant analysis, with the shrinkage parameter as the tuning parameter (scDA, without preliminary feature selection); or (iv) a support vector machine with a linear kernel (SVM), with the cost as the tuning parameter. Where applicable, parameter tuning was performed by three-fold cross-validation as implemented in CMA. Evaluation of the different classifiers and different numbers of features was then performed with the evaluation set based on the accuracy measures misclassification rate and ROC areaunder-the-curve. This procedure (feature selection, classifier, evaluation) was repeated for all 1,000 splittings and averaged accuracy measures were computed. Boxplots displaying the considered accuracy measures for the 1,000 splittings were generated for each classifier/number of features combination. In addition, ROC curves were generated for a representative iteration. The long straight slanting lines in the ROC curves for the scDA and DLDA results are due to ties in the probabilities
DS10
Kebschull et al.
output by CMA. Use of discriminants instead of probabilities would give slightly different results without affecting our conclusions.
Appendix References Ambroise C, McLachlan GJ (2002). Selection bias in gene extraction on the basis of microarray gene-expression data. Proc Natl Acad Sci USA 99:6562-6566. Armitage GC (1999). Development of a classification system for periodontal diseases and conditions. Ann Periodontol 4:1-6. Benjamini Y, Hochberg Y (1995). Controlling the false discovery rate: a practical and powerful approach to multiple testing. J R Stat Soc 57:289-300. Bolstad BM, Irizarry RA, Astrand M, Speed TP (2003). A comparison of normalization methods for high density oligonucleotide array data based on variance and bias. Bioinformatics 19:185-193. Brazma A, Hingamp P, Quackenbush J, Sherlock G, Spellman P, Stoeckert C et al. (2001). Minimum information about a microarray experiment (MIAME)-toward standards for microarray data. Nat Genet 29:365371. Brettschneider J, Collin F, Bolstad BM, Speed TP (2008). Quality assessment for short oligonucleotide microarray data. Technometrics 50:241264. Demmer RT, Behle JH, Wolf DL, Handfield M, Kebschull M, Celenti R, et al. (2008). Transcriptomes in healthy and diseased gingival tissues. J Periodontol 79:2112-2124. Dupuy A, Simon RM (2007). Critical review of published microarray studies for cancer outcome and guidelines on statistical analysis and reporting. J Nat Cancer Inst 99:147-157. Johnson WE, Li C, Rabinovic A (2007). Adjusting batch effects in microarray expression data using empirical Bayes methods. Biostatistics 8:118-127. Kebschull M, Papapanou PN (2010). The use of gene arrays in deciphering the pathobiology of periodontal diseases. Methods Mol Biol 666:385393.
J Dent Res
Kebschull M, Demmer R, Behle JH, Pollreisz A, Heidemann J, Belusko PB, et al. (2009). Granulocyte chemotactic protein 2 (gcp-2/cxcl6) complements interleukin-8 in periodontal disease. J Periodontal Res 44:465-471. Lang N, Bartold MP, Cullinan M, Jeffcoat M, Mombelli A, Murakami S, et al. (1999). Consensus Report: Aggressive periodontitis. Ann Periodontol 4:53. Lindhe J, Ranney R, Lamster I, Charles A, Chung CP, Flemmig T, et al. (1999a). Consensus Report: Chronic periodontitis. Ann Periodontol 4:38. Lindhe J, Ranney R, Lamster I, Charles A, Chung CP, Flemmig T, et al. (1999b). Consensus report: Periodontitis as a manifestation of systemic diseases. Ann Periodontol 4:64. Merico D, Isserlin R, Bader GD (2011). Visualizing gene-set enrichment results using the Cytoscape plug-in enrichment map. Methods Mol Biol 781:257-277. Papapanou PN, Behle JH, Kebschull M, Celenti R, Wolf DL, Handfield M, et al. (2009). Subgingival bacterial colonization profiles correlate with gingival tissue gene expression. BMC Microbiol 9:221. Shannon P, Markiel A, Ozier O, Baliga NS, Wang JT, Ramage D, et al. (2003). Cytoscape: a software environment for integrated models of biomolecular interaction networks. Genome Res 13:2498-2504. Slawski M, Daumer M, Boulesteix AL (2008). CMA: a comprehensive Bioconductor package for supervised classification with high dimensional data. BMC Bioinformatics 9:439. Smyth GK (2004). Linear models and empirical bayes methods for assessing differential expression in microarray experiments. Stat Appl Genet Mol Biol 3:Article3. [Epub 2004 Feb 12, 2004]. Smyth GK, Michaud J, Scott HS (2005). Use of within-array replicate spots for assessing differential expression in microarray experiments. Bioinformatics 21:2067-2075. Stoecklin-Wasmer C, Guarnieri P, Celenti R, Demmer RT, Kebschull M, Papapanou PN (2012). MicroRNAs and their target genes in gingival tissues. J Dent Res 91:934-940. Storey JD, Tibshirani R (2003). Statistical significance for genomewide studies. Proc Natl Acad Sci USA 100:9440-9445. Subramanian A, Tamayo P, Mootha VK, Mukherjee S, Ebert BL, Gillette MA, et al. (2005). Gene set enrichment analysis: a knowledge-based approach for interpreting genome-wide expression profiles. Proc Natl Acad Sci USA 102:15545-15550.