brokers and the process of mortgage securitization. With this restructuring, the housing finance system is now integrated with the broader capital markets in the ...
Jonathan McCarthy and Richard W. Peach
Monetary Policy Transmission to Residential Investment Introduction
T
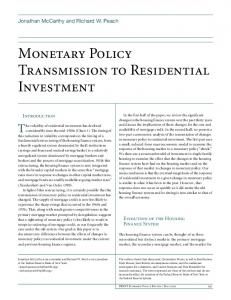
he volatility of residential investment has declined considerably since the mid-1980s (Chart 1). The timing of this reduction in volatility corresponds to the timing of a fundamental restructuring of the housing finance system, from a heavily regulated system dominated by thrift institutions (savings and loans and mutual savings banks) to a relatively unregulated system dominated by mortgage bankers and brokers and the process of mortgage securitization. With this restructuring, the housing finance system is now integrated with the broader capital markets in the sense that “mortgage rates move in response to changes in other capital market rates, and mortgage funds are readily available at going market rates” (Hendershott and Van Order 1989). In light of this restructuring, it is certainly possible that the transmission of monetary policy to residential investment has changed. The supply of mortgage credit is now less likely to experience the sharp swings that occurred in the 1960s and 1970s. This, along with much greater competitiveness in the primary mortgage market prompted by deregulation, suggests that a tightening of monetary policy is less likely to result in nonprice rationing of mortgage credit, as was frequently the case under the old system. Our goal in this paper is to document any differences between the effects of changes in monetary policy on residential investment under the current and previous housing finance regimes.
Jonathan McCarthy is an economist and Richard W. Peach a vice president at the Federal Reserve Bank of New York.
In the first half of the paper, we review the significant changes in the housing finance system over the past thirty years and discuss the implications of these changes for the cost and availability of mortgage credit. In the second half, we present a two-part econometric analysis of the transmission of changes in monetary policy to residential investment. The first part uses a small, reduced-form macroeconomic model to examine the response of the housing market to a monetary policy “shock.” We then use a structural model of investment in single-family housing to examine the effect that the changes in the housing finance system have had on the housing market and on the response of that market to changes in monetary policy. Our main conclusion is that the eventual magnitude of the response of residential investment to a given change in monetary policy is similar to what it has been in the past. However, that response does not occur as quickly as it did under the old housing finance system and its timing is now similar to that of the overall economy.
Evolution of the Housing Finance System The housing finance system can be thought of as three interrelated but distinct markets: the primary mortgage market, the secondary mortgage market, and the market for
The authors thank their discussant, Christopher Mayer, as well as Ken Kuttner, Trish Mosser, Jean Boivin, an anonymous referee, and the conference participants for comments, and Lauren Munyan and Don Rissmiller for research assistance. The views expressed are those of the authors and do not necessarily reflect the position of the Federal Reserve Bank of New York or the Federal Reserve System. FRBNY Economic Policy Review / May 2002
139
Chart 1
Residential Investment: Single-Family Structures Billions of 1996 Chain-Weighted Dollars Year-over-year percentage change 80 60 40 20 0 -20 -40 1960
65
70
75
80
85
90
95
00
Sources: Bureau of Economic Analysis; Board of Governors of the Federal Reserve System, Flow of Funds. Note: Shaded regions indicate periods of deposit outflows.
mortgage-backed securities (MBSs). Over the past thirty years, the underlying institutional setting of those markets has changed dramatically in response to macroeconomic conditions, deregulation, and financial and technological innovation. This section reviews those changes and discusses their implications for the cost and availability of mortgage credit.
Trends in the Primary Mortgage Market The primary mortgage market is where homeowners (mortgagors) borrow from mortgage lenders (originators), pledging their home as collateral for the debt. The debt instrument created in this transaction is typically referred to as a whole loan. Thirty years ago, the primary market was dominated by the heavily regulated thrift industry. Today, it is dominated by the relatively unregulated mortgage banking industry. As recently as the 1970s, the primary mortgage market had essentially the same structure as the one created during the 1930s, often referred to as the New Deal system.1 Under that system, thrifts gathered primarily local time deposits and made long-term fixed-rate mortgage loans on residential properties located near their home offices,2 which were then held in the thrift’s portfolio. To enable thrifts to attract more easily the funds needed for mortgage lending, Regulation Q, which established maximum interest rates on deposits, gave thrifts a ceiling 25 basis points higher than the one for
140
Monetary Policy Transmission to Residential Investment
commercial banks. Although thrifts were subject to restrictions on the assets they could acquire—no corporate loans, bonds, or equities—they benefited from a unique tax provision that made it very profitable for them to invest in residential mortgages.3 This system was established for a variety of motives, including the promotion of home ownership and stable economic growth. It was also dictated to a large extent by the nature of the mortgage asset. Mortgages are promises to pay made by individuals, with their properties serving as collateral. Assessment of credit risk requires substantial knowledge of local market conditions, making individual mortgages relatively illiquid. The New Deal housing finance system worked quite well in the relatively low-inflation environment of the 1950s and early 1960s. However, by the late 1960s, as inflation began to increase, the weaknesses of this system became evident. Thrifts funded their portfolios of primarily long-term mortgage assets with primarily short-term savings deposits. As interest rates increased, thrifts’ cost of funds rose quickly while the rate of return on their portfolio of mortgages rose very slowly, sharply reducing their net income. Moreover, as short-term interest rates rose above the Regulation Q ceilings, those short-term deposits often flowed out of thrifts and commercial banks to higher yielding alternatives, such as the newly emerging money market mutual funds. As a consequence, these institutions were forced to contract the flow of mortgage credit sharply, leading to steep contractions of residential construction and sales of existing homes. In addition to this interest rate risk, the geographic limits placed on thrifts exposed them to substantial credit risk during regional downturns. Finally, as thrifts went from profitability to losses, the value of their loan loss tax provision fell to zero.4 The declining earnings of thrifts and these episodes of disintermediation led to two major policy thrusts. One was to expand thrifts’ asset and liability powers to bolster their earnings and preserve them as lending institutions with a focus on housing finance.5 The second was to foster the development of a market for mortgage-backed securities to enhance thrifts’ liquidity and broaden the investor base for home mortgages, which we discuss in the next section. At the time, these efforts may have been viewed as complementary. With hindsight, however, it is clear that the rapid growth of the market for mortgage-backed securities contributed greatly to the loss of thrifts’ cost advantages and thus to their declining importance in housing finance. Indeed, in the 1970s, thrifts originated 55 percent of longterm mortgages on one-to-four-family properties (Chart 2). At that time, mortgage companies or bankers tended to specialize in loans insured by the Federal Housing Administration (FHA)
and loans guaranteed by the Department of Veterans Affairs (VA). This specialization limited their primary market share to just 19 percent. Unlike thrifts, mortgage bankers are not depository institutions. They fund mortgages through assorted forms of short-term borrowing—sometimes referred to as a warehouse line of credit—and then sell the loans for cash or “swap” them for mortgage-backed securities in the secondary mortgage market.6 By the mid-1990s, mortgage bankers and thrifts had switched roles, with mortgage bankers originating 63 percent of loans closed over 1995-96 and thrifts originating just 19 percent.7 The rise of mortgage banking in the primary market was largely dependent upon changes in the secondary mortgage market and the development of the market for MBSs.
Trends in the Secondary Mortgage Market The secondary mortgage market involves the sale and purchase of whole loans originated in the primary market. Here, as in the primary market, the role of thrift institutions has changed markedly over the past thirty years. In the 1970s, thrifts’ net acquisitions of mortgages exceeded their originations, indicating that thrifts were net purchasers of mortgages in the secondary market.8 However, after 1980, thrifts became net sellers of mortgages, like commercial banks and mortgage bankers. The counterpart to thrifts becoming net sellers of mortgages as well as the increasing market share of mortgage bankers in the primary market has been the growth of the government-
sponsored mortgage pools and, more recently, private conduits as net acquirers of mortgages in the secondary market. These acquisitions then serve as the collateral for mortgage-backed securities, which entitle the holder to a portion of the cash flow generated by a pool of mortgage loans. The governmentsponsored mortgage pools are the Government National Mortgage Association (GNMA, or Ginnie Mae), the Federal National Mortgage Association (FNMA, or Fannie Mae), and the Federal Home Loan Mortgage Corporation (FHLMC, or Freddie Mac).9 In addition to issuing MBSs, Fannie Mae and Freddie Mac, which are government-sponsored enterprises (GSEs) or federal credit agencies, have issued debt and acquired substantial portfolios of mortgage loans (and MBSs).10 Chart 3 presents the net acquisitions of the governmentsponsored mortgage pools, the federal credit agencies, and private conduits as shares of total single-family loan originations from 1970 to the late 1990s. In the early 1970s, the government-sponsored pools acquired just 5 percent of total originations. In the 1990s, their purchases averaged around 50 percent of total originations.11 Private conduits did not exist in the early 1980s, but by the late 1990s they were acquiring 5 percent of total originations. Also by the late 1990s, the federal credit agencies were purchasing 10 to 15 percent of the flow of originations to hold in their portfolios. Collectively, the government-sponsored pools, the federal credit agencies, and the private conduits were net purchasers of about twothirds of single-family originations during the late 1990s. This tremendous growth is a testament to the advantages provided by mortgage securitization, a process that began in
Chart 2 Chart 3
Market Shares of Long-Term Loan Originations for Single-Family Properties
Ratio of Net Acquisitions to Total Originations for Long-Term Single-Family Loans
Market share, percentage of total 70
Mortgage companies
Thrifts
60 50
0.7
Mortgage pools
0.6 0.5
40 Commercial banks
30 20
0.4 0.3
Federal credit agencies Private mortgage-backed securities conduits
0.2
10
0.1
Others
0 1970
75
80
85
90
95
0 1970
75
80
85
90
95
Source: Housing and Urban Development Agency, Office of Financial Management, Survey of Mortgage Lending Activity.
Source: Housing and Urban Development Agency, Office of Financial Management, Survey of Mortgage Lending Activity.
Note: Figures are based on quarterly averages of monthly survey data.
Note: Figures are based on quarterly averages of monthly survey data.
FRBNY Economic Policy Review / May 2002
141
earnest when Ginnie Mae issued the first mortgage pass-through security in 1970 and Freddie Mac began issuing mortgage participation certificates backed by conventional mortgage loans in 1971.12 Mortgage securitization is a way of overcoming the inherent illiquidity of whole mortgage loans. By pooling individual mortgages, it is possible to diversify credit risk over a large number of geographically dispersed borrowers and properties. With diversification, credit risk could be more easily evaluated, allowing the security issuer to add credit enhancement. For example, Ginnie Mae, Fannie Mae, and Freddie Mac mortgage-backed securities guarantee payment of interest and principal, freeing the investor from credit risk, although the investor is still subject to prepayment risk.13 In addition to the diversification benefits derived from pooling mortgages, several other key factors spurred the growth of securitization. Because of the advantages conferred by their GSE status, Fannie Mae and Freddie Mac gained a significant cost advantage over thrifts.14 The GSE advantages include the market perception of a Treasury guarantee of the securities and debt that the agencies issue; the “qualified investment” status of the agencies’ debt for regulated financial institutions; and exemption from state and local taxes, Securities and Exchange Commission registration fees and requirements, and many state securities laws. In addition, FIRREA lowered thrifts’ capital requirements for mortgagebacked securities relative to whole loans, increasing their incentive to hold MBSs. Finally, new financial products further enlarged the investor pool for MBSs. For example, in 1983, Freddie Mac issued the first collateralized mortgage obligation (CMO), which divides the cash flow of a pool of mortgages into various maturity tranches, simultaneously creating short-term securities backed by mortgages and addressing the prepayment risk faced by investors in traditional MBSs.15 Some private firms—private conduits—have begun securitizing mortgages, but they are limited primarily to nonconforming conventional loans.16 Private securitizers currently cannot compete with Fannie Mae and Freddie Mac in the conforming loan market because they must maintain more capital, their securitization costs are higher, and they do not have the economies of scale already realized by the GSEs.
Since 1980, thrifts’ holdings of whole loans and MBSs have declined from more than 50 percent of the stock of home mortgage debt to around 13 percent by early 2000. In contrast, the share of home mortgage debt held by the federally related mortgage pools has risen from essentially zero in 1970 to 10 percent in 1980, to 36 percent in 1990, and to 46 percent by 2000. The holdings of the GSEs and the private asset-backedsecurities issuers have also risen rapidly, particularly in the 1990s.
Implications for the Cost and Availability of Mortgage Credit With the development of the modern housing finance system, the primary mortgage market has become fully integrated with the capital markets. Consequently, the supply of mortgage credit is no longer subject to sharp swings in availability related to the fortunes of thrifts in securing deposits. Rather, mortgage credit is generally available at the going interest rate. This change is evident when comparing the growth of single-family residential investment with the rate of growth of thrift deposits. As seen in Chart 1, through the mid-1980s, periods of deposit outflows were associated with sharp declines in residential investment. After the mid-1980s, that relationship no longer existed. Also confirming the declining influence of thrift deposit flows, Bradley, Gabriel, and Wohar (1995) find that over the 1972-82 period, thrift provision of mortgage credit had a significant influence on the spread between mortgage interest rates and yields on comparable-maturity Treasuries. However, as the housing finance system evolved, the authors
Chart 4
Shares of Outstanding Mortgage Debt by Holder Percent 60 50
Savings institutions
40 Commercial banks
30
Trends in Holdings of Mortgage Debt Corresponding to the changes in the primary and secondary mortgage markets, the past thirty years have also witnessed dramatic changes in holdings of home mortgage debt. Chart 4 presents data on holdings of whole mortgage loans combined with our estimates of holdings of mortgage-backed securities.17
142
Monetary Policy Transmission to Residential Investment
20 10
Asset-backedsecurities issuers Rest of world
Government-sponsored enterprises
0 1970
75
80
85
90
95
Source: Board of Governors of the Federal Reserve System, Flow of Funds.
00
find that the influence of thrifts on that spread declined and effectively vanished by the late 1980s. The effect of the evolution of the housing finance system on the pricing of mortgage credit is not as clear. Several studies have concluded that the interest rates on conforming conventional mortgage loans are significantly less than those on nonconforming or “jumbo” conventional loans, and they attribute those lower rates to the cost advantages of Fannie Mae. For example, the Congressional Budget Office (CBO) recently concluded that over the 1995-2000 period, rates on conforming fixed-rate loans were on average 18 to 25 basis points below those on jumbo fixed-rate loans (Congressional Budget Office 2001). However, the CBO noted that this conclusion assumes that borrowers in the conforming and jumbo markets have similar risk characteristics, which may not be the case. Research suggests that prepayment and default risk may be higher for jumbo borrowers, and that the prices of more expensive homes tend to be more volatile than the prices of more moderately priced homes. From a longer term perspective, it does not appear that mortgage interest rates are now significantly lower than they were when the New Deal housing finance system was in reasonably healthy operation. For example, the spread between the contract rate on thirty-year fixed-rate mortgages and Aaarated corporate bonds in the 1990s was comparable to that of the 1970s, even though that spread widened substantially during the early 1980s as the old system began to deteriorate while the new system had not fully developed (Chart 5). Indeed, Hendershott and Van Order (1989) find that because of the aforementioned thrift tax advantages and portfolio restrictions, mortgage rates in the 1970s were on average 50 basis points below what they would have been in a “perfect” capital market. In the early 1980s, mortgage rates rose above the perfect capital market rate because of the reduced profitability of thrifts, which reduced the value of their tax advantage, and expanded thrift asset powers. By the late 1980s, actual mortgage rates and these estimated perfect market rates were essentially the same, suggesting that the mortgage market had become fully integrated into the broader capital markets. The evolution of the housing finance system has had additional effects on the cost and availability of mortgage credit that appear to have some impact on the behavior of residential investment. For instance, the initial fees and charges associated with obtaining a mortgage have declined from around 2½ percent of the loan amount in the early 1980s to just over ½ percent recently. Research suggests that the decline in these transaction costs has increased the propensity of homeowners to refinance their mortgages.18 This in turn suggests that increases in interest rates may present less of a restraint on home sales, provided that prospective homebuyers regard the
Chart 5
Thirty-Year Mortgage/Aaa-Rated Corporate Bond Spread Basis points 500 400 300 200 100 0 -100 1971
75
80
85
90
95
00
Sources: Board of Governors of the Federal Reserve System; Moody’s Investors Services.
increase in rates as temporary. The widespread availability of adjustable-rate mortgages likely has had a similar effect. In addition to allowing consumers to select a loan maturity (a place on the yield curve) that corresponds to their expectations of the life of their mortgage, ARMs appear to soften the blow of increases in long-term rates on the level of housing market activity, at least in the initial stages of those increases.
Housing within a Monetary Policy VAR Model We now turn to the issue of whether these changes to the housing finance system have altered the magnitude and/or timing of the impact of monetary policy on the housing sector. To analyze this issue, we first estimate the response of residential investment to monetary policy changes within a vector autoregression (VAR) model similar to one used by Bernanke and Gertler (1995).19 Our VAR consists of two lags of the logarithms of real GDP, the GDP deflator, commodity prices, residential investment in single-unit structures, and single-family home prices relative to the GDP deflator, as well as the levels of the federal funds rate and mortgage rates.20 Because the transition from the New Deal system to the current system was largely completed by the mid-1980s, we arbitrarily split the sample in 1986:1 and estimate the model over two periods: 1975:1-1985:4 and 1986:1-2000:3.21 The
FRBNY Economic Policy Review / May 2002
143
effects of monetary policy in this model for each period are then measured by the impulse responses to a 50-basis-point “shock” in the federal funds rate.22 To identify the shocks, we follow standard practice and use a Choleski decomposition with the variables in the order described above.23 Under the New Deal system, the response of residential investment to a monetary policy shock is quite sharp (Chart 6). Residential investment responds quickly after an increase in the fed funds rate, declining by 3 percent after two quarters. Over the same horizon, GDP declines by about 0.3 percent. Residential investment then recovers quickly, returning to its baseline after one and a half years (it takes GDP about two years to do so). In contrast, residential investment responds more slowly after the mid-1980s. Two quarters after the shock, residential investment has hardly changed. It now takes two years—longer than the time it took for residential investment to return to its baseline in the earlier period—for residential investment to reach its maximum decline.24 Nonetheless, this maximum decline is greater than that of the earlier period, probably because the fed funds rate increase is more persistent and mortgage rates respond more in the later period (Chart 6). Chart 6 also shows that there are noticeable differences between the responses of home prices and mortgage rates in the two periods. Although there is initially little response, home prices eventually respond more during the later period than during the earlier one.25 In regard to mortgage rates, the initial response is larger in the later period, which is consistent with the greater integration between the mortgage market and the capital markets. The response over longer horizons is also larger in the later period. This reflects the greater persistence of the fed funds rate during this period.26 These responses indicate that the transmission of monetary policy to housing has changed. In the earlier period, residential investment responds quickly to monetary policy even though home prices and mortgage rates respond little. This pattern suggests that monetary policy affected housing primarily by rationing the quantity of mortgage credit and choking off demand. We find this even though our sample excludes earlier episodes of disintermediation found to have a large effect on housing.27 In the later period, the responses suggest that monetary policy affects housing through the pricing of mortgage credit and homes. The response of mortgage rates is greater initially and is more persistent. Home prices eventually respond more than they did in the earlier period. With monetary policy transmitted through these pricing channels, residential investment responds more slowly, but eventually strongly. Therefore, monetary policy still appears to have a strong effect on residential investment, but it takes longer for it to occur.
144
Monetary Policy Transmission to Residential Investment
To offer a better understanding of how and why the monetary policy transmission mechanism to the housing sector has changed, we examine the behavior of the sector more closely, using a structural model.
Chart 6
Impulse Responses to a Fed Funds Shock Before and after 1986 Log deviation 0.02
Residential Investment
Before 1986
0 After 1986 -0.02 -0.04 -0.06 Log deviation 0.004
Home Price
0.002
Before 1986
0 -0.002 -0.004 After 1986 -0.006 -0.008 Percent deviation 1.0
Fed Funds Rate
0.5 After 1986 0.0 Before 1986 -0.5 Percent deviation 0.3
Mortgage Rate
0.2 0.1 After 1986 0 Before 1986 -0.1 -0.2 0
5
10
Quarters after shock Source: Authors’ calculations.
15
20
A Model of the Housing Sector Underlying our structural model of the housing sector is the stock-flow model that has long been popular in the housing literature.28 Our model also takes into account the fact that the housing market responds gradually to monetary policy. First, we describe the long-run equilibrium portion of our model. On the demand side, given the stock of housing h t ,29 d∗ the long-run demand function determines the price p that would clear the current stock of housing.30 The position of this demand function in turn depends upon the permanent income of households, which we proxy using nondurables and services consumption c t and the user cost u t of holding the housing asset.31 This relationship (with all variables in logarithms) can then be expressed as: (1)
p td∗ = α 1 h t + α 2 c t + α 3 u t .
Because equation 1 is a demand curve, the coefficients on housing and user cost are expected to be negative, while that on consumption is expected to be positive. On the supply side, we assume that entry and exit ensure that home construction firms make zero profits in the long run. Therefore, given the cost structure of construction firms, the s∗ home price p induces a sufficiently high investment rate ( I ⁄ H ) to cover depreciation and expected housing stock growth ( ( I ⁄ H ) = ∆ h + δ , where δ is the depreciation rate). This relationship can be expressed as: (2)
p ts∗ = γ 1 ( i t – h t ) + γ 2 cc t .
In equation 2, i t is log residential investment (and so i t – h t is the log investment rate) and cc t is a construction cost index for single-family homes. Because this is a supply relationship, the coefficients on each of the variables should be positive. If the housing market adjusted to shocks instantaneously, then we could close the model by assuming the equilibrium condition p td∗ = p ts∗ = p∗t and estimate only equations 1 and 2. However, there is overwhelming evidence that both home prices and residential investment adjust slowly to shocks.32 We account for slow adjustment by incorporating an errorcorrection process in both the demand and supply sides of the model. Specifically, if the model was in equilibrium and a shock d∗ occurred, wedges develop between the current price and p as s∗ well as p . A fraction of each of these wedges is closed in a period, so that they slowly dissipate if no other shocks occur. According to these assumptions, a positive difference d∗ between the actual price level and p in the previous period, which indicates excess supply, reduces home price inflation. Beyond this effect, shocks to consumption and user costs lead to shifts in housing demand and affect home price inflation.
The financial wealth of households may affect homebuyers’ ability to meet down-payment and collateral constraints for obtaining mortgages; thus, wealth w t may affect short-run demand. Finally, tenant rent inflation ∆ p tr may affect housing demand because renting is a substitute for owner occupancy.33 Therefore, the short-run demand equation we estimate is (3)
∆ p t = λ d ( p t – 1 – p td–∗ 1 ) + β 0 + β 1 ∆ c t + β 2 ∆ u t + β 3 ∆ w t + β 4 ∆ p tr + εt .
In equation 3, ∆ is the first difference of a variable. The coefficients on p t – 1 – p td–∗ 1 and user cost are expected to be negative, while those on consumption growth, wealth growth, and tenant rent inflation are expected to be positive.34 According to our assumptions concerning the supply side, a s∗ positive difference between actual home price and p in the previous period, which indicates a good environment for home building, increases investment. Beyond this, higher construction costs should reduce investment, while Mayer and Somerville (2000) find that home price inflation affects investment positively. Rising land prices may indicate constraints on available lots for building, and thus may be negatively related to investment. Finally, many studies have shown that a variable reflecting the quantity of homes on the market affects residential investment.35 Therefore, our shortrun supply equation is (4)
∆ ( I ⁄ H ) t = λ s ( p t – 1 – p ts∗– 1 ) + θ 0 + θ 1 ∆ p t + θ 2 ∆ cc t + θ 3 r t + θ 4 ∆ p tl + θ 5 q t – 1 + v t .
In equation 4, ( I ⁄ H )t is the investment rate for single-unit residential structures: investment divided by the stock at the end of the previous period. The variable r t is a short-term interest rate using the rate on three-month certificates of deposit and PCE (personal consumption expenditures) deflator inflation; p tl is land price relative to the PCE deflator, where land price is proxied by the deflator on rental value of farm dwellings; q t – 1 is the quantity variable, the logarithm of the month’s supply (at current selling rates) of new homes for sale as of the end of the previous period. We expect the coefficients on home price inflation and p t – 1 – p ts∗– 1 to be positive and the coefficients on the other variables to be negative.
Estimation Results To preview our empirical results, we find that most of the demand and supply factors in our model have statistically and economically significant effects in the post–New Deal period
FRBNY Economic Policy Review / May 2002
145
only. These results thus suggest that monetary policy is now transmitted to housing through pricing channels, rather than through quantitative financing restrictions, as was typical during the New Deal financing system era.
equations 1 and 2 (Table 1, panel B). These restrictions are 1) the coefficients on residential investment and construction costs are zero in equation 1, 2) the coefficients on consumption and user cost are zero in equation 2, and 3) the coefficient on the housing stock in equation 2 is the negative of that on residential investment. We do not reject these restrictions, and the coefficient estimates also appear to be reasonable. The coefficients all have the correct sign, have reasonable magnitudes, and are statistically significant with the exception of user cost. In particular, the coefficient on consumption is greater than 1, indicating a high long-run income elasticity consistent with common conceptions about housing demand. The two error terms (not provided) are consistent with commonly held views on the behavior of the housing market and home prices. The error term from the long-run demand equation
Long-Run Demand and Supply Equations 1 and 2 imply that the following six variables should be cointegrated with two cointegrating vectors: home price, housing stock, consumption, user cost, residential investment, and construction cost. Using the Johansen trace statistic, we find that there indeed are two cointegrating vectors, as predicted by the model (Table 1, panel A).36 We then estimate the two cointegrating vectors imposing the restrictions implicit in
Table 1
Estimates and Tests of Long-Run Relationships Equations 1 and 2 Panel A: Johansen Cointegration Test Statistic Number of Cointegrating Vectors 0 1 2 3 4 5
Trace Statistic
90 Percent Significance Levela
114.17 65.71 42.67 23.31 6.29 0.12
89.48 64.84 43.95 26.79 13.33 2.69
Panel B: Estimates of Two Cointegrating Vectors Demand (Equation1) Variable Housing stock Consumption User cost Investment Construction cost
Memo: Test of overidentifying restrictions Chi-square (3) = 2.38
Supply (Equation 2)
Coefficient
Standard Error
Coefficient
Standard Error
-4.197 3.431 -0.029 — —
0.985 0.716 0.024 — —
-2.864 — — 2.864 4.545
0.379 — — 0.379 0.553
p-value = 0.50
Source: Authors’ calculations. Notes: There are four lags in the vector autoregression. The estimation period is 1975:1 to 2000:3. In panel B, the dependent variable is log home price. a
Significance levels are from Osterwald-Lenum (1992).
146
Monetary Policy Transmission to Residential Investment
Changes in Short-Run Price Adjustment
indicates that prices rise above demand “fundamentals” just before recessions, while the term from the long-run supply equation indicates that the investment rate is “too high” relative to fundamentals before recessions.
Turning to the short-run price adjustment equation— equation 3—we see that the coefficient estimates are consistent with our predictions when the equation is estimated over the entire sample (Table 2, regression 1).37 The coefficient on consumption growth is about two-thirds, indicating a shortrun elasticity smaller than the long-run elasticity. Although the
Table 2
Short-Run Demand Equation Regression 1 Variable Full-sample coefficients Error-correction term (-1) Consumption growth User cost difference Wealth growth Tenant rent inflation Loan-price ratio difference
Coefficient
Standard Error
-0.049 0.655 -0.005 0.035 0.403
0.024 0.210 0.005 0.021 0.259
Regression 2 Coefficient
Standard Error
Regression 3 Coefficient
Standard Error
-0.050 0.710 -0.004 0.029 0.336 -0.0025
0.024 0.216 0.005 0.022 0.255 0.0007
Regression 4 Coefficient
Standard Error
1975:1-1985:4 coefficients Error-correction term (-1) Consumption growth User cost difference Wealth growth Tenant rent inflation Loan-price ratio difference
-0.054 0.440 -0.001 0.046 0.058
0.025 0.346 0.006 0.066 0.406
-0.054 0.488 0.001 0.054 0.026 -0.0016
0.026 0.361 0.006 0.067 0.399 0.0013
1986:1-2000:3 coefficients Error-correction term (-1) Consumption growth User cost difference Wealth growth Tenant rent inflation Loan-price ratio difference
-0.077 0.832 -0.027 0.025 0.792
0.026 0.207 0.014 0.020 0.165
-0.081 0.855 -0.032 0.011 0.603 -0.0031
0.023 0.235 0.012 0.018 0.153 0.0006
Adjusted R2
Memo: Test for break in 1986:1a
0.308
0.350
Statistic 36.775
0.342
p-value 0.000
Statistic 41.748
0.376
p-value 0.000
Source: Authors’ calculations. Notes: The dependent variable is home price inflation. The estimation period is 1975:1 to 2000:3. All regressions include a constant (not reported), which is allowed to change in regressions 2 and 4. The estimation is performed using ordinary least squares with Newey-West standard errors (allowing for up to a fourth order moving average process). a
The test statistic is distributed chi-squared with degrees of freedom equal to the number of independent variables (six in regression 2 and seven in regression 4).
FRBNY Economic Policy Review / May 2002
147
coefficient on user cost is negative, it is statistically insignificant. The coefficient on the error-correction term is about -0.05, indicating that only about 18 percent of the difference between actual and equilibrium prices is closed within a year. This may seem slow, but it is roughly consistent with the adjustment rates found by other researchers.38 As we are interested in the possibility of a shift in short-run demand in the post–New Deal system period, we reestimate equation 3 allowing for a possible structural break in 1986. Estimating this expanded model, we find that the test statistic soundly rejects the null hypothesis of no structural break (Table 2, regression 2). Moreover, the coefficient estimates are consistent with a shift from a quantity-rationed market to a price-rationed one. Prior to the mid-1980s, the coefficient estimates are insignificant with the exception of the one on the error-correction term. In particular, home prices are unresponsive to user costs (and thus interest rates) and the price of the closest substitute, rental housing, suggesting a quantity-rationed market. Since the mid-1980s, home prices are responsive to most of the demand factors. The coefficients on consumption, user cost, and rent inflation are significant and have considerably larger magnitudes. The coefficient on the error-correction term suggests a somewhat higher adjustment rate of about 27 percent per year. All of this is consistent with a market where prices are the primary rationing mechanism. This shift suggests that monetary policy now works mostly through the price mechanism, resulting in a more delayed response of demand to monetary policy changes. With user costs a greater influence on demand and with interest rates an important factor in housing user costs, monetary policy eventually should have a strong influence on demand. Nevertheless, user costs are a complicated function of interest rates, expected home price inflation, and depreciation; thus, the effect of monetary policy is probably quite complicated and slow, much like in the case of business investment.39 Because price adjustment toward equilibrium remains slow, housing demand should decline more slowly in response to a monetary policy tightening than it did under the New Deal housing finance system.
Loan-Price Ratio and Housing Demand We wish to consider one other possible demand determinant with implications for monetary transmission to housing: the average loan-price ratio for mortgages. Because observed loanprice ratios reflect both demand and supply in the mortgage market, their relationship with home price inflation is not
148
Monetary Policy Transmission to Residential Investment
clear-cut. For lenders, higher down-payment (lower loan-price ratio) mortgages are desirable because they mitigate the informational problems inherent in lending. For borrowers, a higher loan-price ratio eases down-payment constraints, which should increase demand. However, most homebuyers use the net proceeds from the sale of their previous home as the down payment on their new mortgage. Therefore, periods of rapid home price appreciation may be associated with lower loanprice ratios because more loans are made to borrowers able to make larger down payments. Which effect dominates then becomes an empirical matter. Including the loan-price ratio in the price adjustment equation, we see that the latter effect appears to dominate. Estimating over the entire sample, we see that the coefficient on the ratio is negative, suggesting that down payments are greater during periods of strong demand (Table 2, regression 3). More importantly, when we allow for a break in 1986:1, the coefficient is twice as large after the break than before. In the later period, a one-percentage-point rise in the loan-price ratio is associated with a 31-basis-point decrease in home price inflation, which is about one-third of its standard deviation (Table 2, regression 4). This result thus reinforces our conclusion that pricing has become the principal rationing mechanism in the housing market, which in turn has affected the transmission of monetary policy to housing in a manner consistent with our VAR analysis.
Changes in Short-Run Supply Adjustment On the supply side of our model, estimates of equation 4 over the entire sample indicate that few supply factors have a significant effect on the residential investment rate, primarily because the estimates are imprecise (Table 3, regression 1).40 The coefficients on the error-correction term and the month’s supply variable have the expected signs and are statistically significant. However, home price inflation has little effect on the investment rate, and the coefficient on the interest rate, although negative as expected, is not statistically significant. Again, because we are interested in a possible shift in shortrun supply during the 1980s, we reestimate equation 4 allowing the coefficients to change beginning in 1986:1. The statistical tests of a structural break strongly reject the hypothesis of no structural break in favor of some coefficients changing between the two periods (Table 3, regression 2). Beyond this statistical test, the pattern of the coefficients is consistent with a shift from a quantity-rationed market to a price-rationed one. Prior to the mid-1980s, the coefficient on the month’s supply variable, which represents the effects of
Table 3
Residential Investment Regressions Regression 1 Variable Full-sample coefficients Error-correction term (-1) Home price inflation Construction cost inflation Real interest rate Land price inflation Month’s supply (-1) Net deposit flow
Coefficient
Standard Error
0.240 -0.006 0.176 -0.018 -0.138 -0.006
0.064 0.106 0.140 0.012 0.076 0.003
Regression 2 Coefficient
Standard Error
Regression 3 Coefficient
Standard Error
0.218 0.094 0.011 -0.030 -0.041 -0.003 0.003
0.065 0.061 0.106 0.007 0.073 0.001 0.006
Regression 4 Coefficient
Standard Error
1975:1-1985:4 coefficients Error-correction term (-1) Home price inflation Construction cost inflation Real interest rate Land price inflation Month’s supply (-1) Net deposit flow
0.219 -0.050 0.012 -0.018 0.157 -0.012
0.048 0.078 0.073 0.004 0.073 0.002
0.226 0.062 -0.058 -0.026 0.044 -0.010 0.005
0.081 0.047 0.095 0.006 0.044 0.001 0.011
1986:1-2000:3 coefficients Error-correction term (-1) Home price inflation Construction cost inflation Real interest rate Land price inflation Month’s supply (-1) Net deposit flow
0.120 0.097 -0.006 -0.027 -0.004 -0.001
0.034 0.026 0.031 0.008 0.031 0.002
0.128 0.103 0.011 -0.027 -0.009 0.000 -0.001
0.029 0.026 0.028 0.009 0.033 0.001 0.003
Standard error of regression J-statistica p-value
Memo: Test for break in 1986:1 b
0.0021 2.612 0.625
0.0015 6.381 0.496
Statistic 74.504
0.0015 4.657 0.324
p-value 0.000
Statistic 123.690
0.0011 6.978 0.431
p-value 0.000
Source: Authors’ calculations. Notes: The dependent variable is the change in the investment-capital ratio for single-unit residential structures. The estimation period is 1975:1 to 2000:3. All regressions include a constant (not reported). The estimation is performed using generalized method-of-moments. The instruments include a constant, the lagged error-correction term, the lagged month’s supply variable, the real interest rate, consumption growth, user cost difference, tenant rent inflation, manufacturing wage growth, manufacturing materials price inflation, the marginal personal income tax rate, and the average property tax rate. a The statistic is distributed chi-squared with degrees of freedom equal to the number of instruments minus the number of regressors (four in regressions 1 and 3 and seven in regressions 2 and 4). b
The test statistic is distributed chi-squared with degrees of freedom equal to the number of independent variables (seven in regression 2 and eight in regression 4).
FRBNY Economic Policy Review / May 2002
149
quantity constraints, is very statistically significant and much larger than the full-sample coefficient. The coefficient on the interest rate is more precisely estimated so that it is also statistically significant, although it is similar to its estimate over the entire sample. The coefficients on the other variables are roughly the same as they were over the entire sample. After the mid-1980s, the coefficients change markedly. Most notably, the coefficient on month’s supply becomes essentially zero, suggesting that nonprice factors have become less important for residential investment. Home price inflation has the expected positive effect on residential investment, suggesting that prices have become important in determining residential investment. The coefficient on the error-correction term becomes smaller, but remains statistically significant. The significantly negative coefficient on the real interest rate has become somewhat larger. As with demand, this shift in the supply adjustment equation suggests that monetary policy affects housing mostly through the price mechanism. As a consequence, we would expect residential investment to respond more slowly to monetary policy. Our estimates of the price adjustment equation indicate that home prices adjust slowly to shocks, which will tend to result in a slow response of residential investment to a monetary policy tightening. Nevertheless, because the direct effect of interest rates on supply has changed little, the eventual response of residential investment to a monetary tightening should be similar to that in the 1970s and early 1980s, consistent with the VAR impulse responses.
Do Deposit Flows Affect Supply? Another feature of the New Deal housing finance system was thrifts’ financing of many homebuilders, in part because some thrifts were controlled by homebuilders. Therefore, thrift deposit inflows may have led to more home construction, at least before the mid-1980s. To investigate this possibility, we added to equation 4 a net deposit inflow variable: deposit inflows into savings institutions as a fraction of deposits at the beginning of the quarter, from the Flow of Funds. Despite our expectations, deposit inflows had at best only small effects on residential investment during the New Deal finance system period (Table 3, regressions 3 and 4). Even in this period, the coefficient on deposit inflows is statistically insignificant, and the variable has little effect on the coefficients on the other variables.
150
Monetary Policy Transmission to Residential Investment
Conclusion The restructuring of the housing finance system has been an important factor behind the behavior of housing over the past twenty-five years. Before the mid-1980s, the housing finance system was dominated by specialized, highly regulated savings institutions. Now, less regulated mortgage bankers and the mortgage securitization process are the dominant players in the market. Consequently, the mortgage market today is largely integrated into the broader capital markets, reducing the swings in the availability of mortgage credit. As a result, quantitative financing constraints now have a smaller influence on home prices and residential investment than they did under the more regulated New Deal mortgage finance system. Instead, various aspects of the pricing of credit and capital costs—interest rates, user costs, and mortgage transaction costs—have become more important influences on the housing market, as pricing has become the rationing mechanism in mortgage credit markets. For the transmission of monetary policy to housing, the restructuring of the finance system has led to significant changes. Under the highly regulated savings-institution-based system, monetary policy largely affected housing through its influence on the availability of credit. A tightening of monetary policy reduced deposit flows to savings institutions, especially when Regulation Q deposit-rate ceilings were binding. This caused a dramatic drop in credit to the housing sector and a quick and dramatic drop in residential investment and housing starts. Because of this fast response, the housing sector was an early indicator of the influence of tighter monetary policy on the economy. Since the mid-1980s, tighter monetary policy has worked through the pricing of credit, user costs, and transaction costs, as well as through its effect on home prices. Because the effect of monetary policy on these variables is complicated, this transmission process takes longer to affect residential investment, although the ultimate effect remains quite large. A reader may still question why less regulation and greater dependence on the price mechanism have led to a slower response to monetary policy. Although a detailed analysis is beyond the scope of this paper, we believe that some features of the housing market can explain this economically counterintuitive result. One of these primary features is the fact that even though the mortgage market has become integrated with the capital markets, the market for housing units certainly is less efficient than the mortgage market. Homes remain illiquid and idiosyncratic assets, with their trading dominated by
households trading the homes in which they live. Although the original work of Case and Shiller (1989) on housing market efficiency used data from the New Deal housing financing system era, more recent work indicates that prices still adjust more slowly than they would in an efficient market. For example, Genesove and Mayer (1997, 2001) find that sellers are reluctant to reduce asking prices even when overall market conditions are weakening. These types of inefficiencies provide an explanation for a slow response of home prices. With prices responding slowly, we may then expect that the quantity response also should be slow. Moreover, homebuilders now have better access to financial markets, which may make them less susceptible to tighter policy initially. With financing available (even at higher interest rates) and with the fixed costs of
stopping and restarting projects, builders may find it less costly to complete current projects, even in less favorable market conditions, than to stop them and restart them later when conditions improve. We then would expect residential investment to respond slowly to tighter monetary policy. In the end, housing remains a sector sensitive to monetary policy, as one might suspect since most home purchases have to be financed. Nevertheless, as the mortgage market has become integrated with the capital markets, the timing of the housing sector’s response to monetary policy has become similar to that of the overall economy. Those analysts looking for an early response by the housing sector to monetary policy changes in the current environment are likely to be disappointed.
FRBNY Economic Policy Review / May 2002
151
Appendix A: Data
We discuss the sources and methods used to construct two variables in our analysis: the stock of single-unit residential structures and the user cost of residential capital.
User Cost To calculate the user cost of residential capital, we use the following standard expression: u t = p th [ ( 1 – τ ty ) ( it + τ tp ) + δ t – E π th+ 1 ] .
Housing Stock The source of our data on the stock of single-unit residential structures is the series published by the Bureau of Economic Analysis (BEA) and described in Herman (2000). These data are annual and stated as a quantity index (1996=100). We interpolate this series using the National Income and Product Accounts data on residential investment in single-unit structures. The investment series is used to allocate the annual logarithmic difference between quarters so that quarters with higher investment are those in which the stock grows more quickly. This gives a quarterly stock series as a chain-weighted quantity index. The quantity index is then converted into a chain-weighted dollar series by using the 1996 current dollar value of the single-unit residential structures.
152
Monetary Policy Transmission to Residential Investment
The variable p th is the real housing price, measured by the Office of Federal Housing Enterprise Oversight (OFHEO) home price index relative to the PCE (personal consumption expenditures) deflator. The variables τ ty and τ tp are the marginal federal income tax rate (for a household with twice the median household income) and the average state and local property tax rate, respectively. The source of these variables is the public database for the Board of Governors of the Federal Reserve System/U.S. macroeconomic model. The variable δ t is the depreciation rate as implied by the annual BEA stock data. The variable E π th+ 1 is the expected capital gains from housing, proxied by the twelve-quarter moving average of the annualized percentage change in the OFHEO index. The variable i t is the interest rate on three-month Treasury bills. This is consistent with the theory underlying the construction of this variable; see Poterba (1984). Nevertheless, using mortgage rates in place of the short-term rate (as many studies have done) has little effect on the results in the paper. Finally, a constant was added to the constructed series to ensure that there were no negative values of user costs.
Appendix B: Chronology of Key Events
1938
The Federal National Mortgage Association (FNMA) is established as a government agency to buy and sell Federal Housing Administration (FHA) mortgages.
1968
FNMA is split into two agencies: the Government National Mortgage Association (GNMA) is set up within the U.S. Department of Housing and Urban Development (HUD) to take responsibility for low-income housing mortgages; FNMA is set up as an off-budget, federally chartered corporation that capital markets regard as having agency status.
1970
GNMA issues the first mortgage-backed pass-through securities, representing pro rata shares of pools of FHA and Department of Veterans Affairs mortgage loans.
1970
The Emergency Home Finance Act creates the Federal Home Loan Mortgage Corporation (FHLMC) to purchase conventional loans from savings and loans (S&Ls); FNMA is granted authority to purchase conventional mortgages.
1971
FHLMC issues the first conventional mortgage-backed security: the mortgage participation certificate.
1978
Federally chartered S&Ls in California are given the authority to write and invest in adjustable-rate mortgages, or ARMs. (State-chartered thrifts had already been given that authority.)
1979
Federally chartered S&Ls nationwide are granted the authority to write and invest in ARMs. (The annual and life caps are fairly restrictive, such as ½ to 2½.)
1980
The Depository Institutions Deregulation and Monetary Control Act is passed.
1981
FNMA and FHLMC initiate mortgage swap programs for S&Ls; FNMA begins issuing conventional mortgage-backed securities.
1981
More liberal ARM authority is granted to federally chartered S&Ls and savings banks.
1982
The Garn-St. Germain Act increases deposit insurance coverage from $40,000 to $100,000. It allows use of brokered deposits and expanded thrift asset powers.
1982
The Deposit Institutions Act grants even more liberal ARM authority to federally chartered and state-chartered thrifts.
1983
FHLMC issues the first collateralized mortgage obligation.
1989
The Financial Institutions Reform, Recovery, and Enforcement Act is passed. Under the Act, capital requirements for thrifts are significantly increased. Also, the qualified thrift-lender test requires 70 percent of assets in qualified categories, up from 60 percent, and the types of nonhousing assets that qualify for this test are scaled back. In addition, the types and percentages of nonhousing assets in which thrifts could invest are cut back. One part of this Act turned FHLMC into a nearly carbon copy of FNMA, with a similar charter and the same type of board of directors.
FRBNY Economic Policy Review / May 2002
153
Endnotes
1. See Weicher (1994) for a more thorough explanation of this system.
8. Net acquisitions are defined as originations plus purchases minus sales.
2. Through 1964, the homes were required to be within fifty miles of the home office. After 1964, the requirement was changed to 100 miles.
9. Ginnie Mae securities are backed by FHA and VA loans. Unlike Fannie Mae and Freddie Mac, Ginnie Mae is not the issuer of the security. A private lender, typically a mortgage banker, is the issuer, while Ginnie Mae insures the timely payment of principal and interest. Securitization of FHA and VA loans occurred rapidly, with the entire FHA/VA origination volume having been securitized by 1982.
3. As long as a high percentage of their assets were invested in “qualified housing assets,” thrifts could transfer a fraction of their before-tax net income to loan loss reserves, thereby avoiding taxation on that portion of their net income. From 1962 through 1969, that fraction was 60 percent; between 1969 and 1979, the fraction was gradually reduced to 40 percent; the Tax Reform Act of 1986 reduced it to 8 percent. Of course, thrifts had to have positive net income for this tax provision to have value.
10. More recently, many of the regional Federal Home Loan banks, also GSEs, have begun buying mortgages in the secondary market. Unlike Fannie Mae and Freddie Mac, the Federal Home Loan banks do not issue mortgage-backed securities and do not assume the credit risk of the mortgages they buy. Instead, these banks pay the originating mortgage lender to retain that credit risk.
4. See Hendershott and Villani (1977). 5. To enhance thrifts’ earnings, the industry was deregulated considerably over the late 1970s and early 1980s. Regulation Q deposit-rate ceilings were relaxed beginning in 1978 and they would be removed substantially following the passage of the Depository Institutions Deregulation and Monetary Control Act in 1980. Beginning in 1979, with subsequent liberalization in 1981 and 1982, federally chartered thrifts were allowed to originate and purchase adjustable-rate mortgages (ARMs). The Garn-St. Germain Act of 1982 increased deposit insurance coverage from $40,000 to $100,000, allowed brokered deposits, and expanded thrifts’ asset powers. However, as is well-known today, the expansion of thrifts into nonhousing assets was not a resounding success. In 1989, the Financial Institutions Reform, Recovery, and Enforcement Act (FIRREA) was enacted to close failed thrifts and restructure what remained of the industry. Their nonhousing asset powers were scaled back and their capital requirements were increased. Along with the erosion of the tax preference of thrifts, these developments eliminated cost advantages that thrifts had in the primary market. See Hendershott (1991). 6. In most cases, the loans are sold “servicing retained,” where the originating mortgage banker then services the loan (collects monthly payments and distributes those funds, net of a servicing fee, to the appropriate parties). Mortgage brokers differ from mortgage bankers in that they typically do not have a warehouse line, so they must arrange for another lender to fund the mortgage. 7. Distinctions between the shares of commercial banks and mortgage bankers are somewhat blurred because many of the nation’s largest mortgage bankers are subsidiaries of bank holding companies.
154
Monetary Policy Transmission to Residential Investment
11. Note that the share of originations purchased by the governmentsponsored mortgage pools tends to be volatile. This is due to the fact that portfolio lenders such as thrifts and commercial banks prefer to hold adjustable-rate mortgages in their portfolios while selling fixedrate mortgages. Thus, whenever the ARM share of loans closed in the primary market increases, portfolio lenders gain market share over mortgage bankers, and less of the total volume of loans originated in the primary market is sold in the secondary market. 12. Conventional mortgages are loans not insured or guaranteed by the government, although they are frequently insured by private mortgage insurers. Fannie Mae began issuing MBSs backed by conventional loans in 1981. Through the 1970s, FNMA essentially operated as a giant thrift institution, buying whole loans for its portfolio and funding them through sales of debt. 13. Because the conventional mortgages underlying Fannie Mae and Freddie Mac securities are not insured to the extent that FHA and VA mortgages are, the credit guarantee provided by Fannie Mae and Freddie Mac adds more value to the underlying mortgage than does the Ginnie Mae guarantee (Hendershott 1992). 14. Hendershott and Shilling (1989) estimate that as of 1986, that cost advantage was 30 to 35 basis points. 15. CMOs are often referred to as resecuritizations, since the collateral is often MBSs. 16. Legally, the dollar ceilings on FHA and VA loans and the conforming loan limit are the limits on securitization by Ginnie Mae,
Endnotes (Continued)
Fannie Mae, and Freddie Mac. The conforming loan limit is the maximum conventional loan amount that Fannie Mae and Freddie Mac are permitted to purchase, which in 2001 was $275,000 for single-family homes. 17. The Flow of Funds, produced by the Board of Governors of the Federal Reserve System, provides information on the holdings of government agency securities, which are primarily mortgage-backed securities of government-related mortgage pools and the debt of government-sponsored enterprises. In allocating the stock of mortgage-backed securities, we assume that these enterprises’ holdings of agency securities consist solely of mortgage-backed securities. The remaining stock of mortgage-backed securities was allocated on the basis of the share of total agency securities holdings. 18. Bennett, Peach, and Peristiani (2001) find that the decline in fees and other transaction costs, as well as the greater competitiveness of mortgage lenders, has contributed to an increased propensity to refinance mortgages. 19. VARs have been used by Christiano, Eichenbaum, and Evans (1996) to examine the effects of monetary policy and by Kahn (1989) and Pozdena (1990) to study the interactions between the housing market and monetary policy. 20. We use residential investment in single-unit structures to be consistent with our subsequent analysis concentrating on singlefamily homes. Using total residential investment has little effect on the substantive results. The choice of two lags is necessitated by the short samples over which we estimate the model. An alternative would be to use a longer lag structure in a Bayesian VAR (see Kahn [1989]). The Bayesian VAR imposes a prior distribution on the coefficients of the model that reduces the number of parameters to be estimated. We estimated Bayesian VARs with four and five lags and found little substantive difference in the results from those presented here. 21. We choose 1975 as the starting date because our preferred measure of home prices—the repeat sales index from the Office of Federal Housing Enterprise Oversight (OFHEO)—begins then. If this series is extended by splicing the median home sales price series (which starts in 1968) to it, the substantive results of this exercise are similar. Using this longer home price series and excluding the 1979-82 Volcker monetary experiment period also has little effect on the substantive results. Furthermore, using a split date between 1984:1 and 1988:1 has little effect on the results.
22. For a motivation for using the federal funds rate to identify monetary policy, see Bernanke and Blinder (1992). 23. With this ordering, we assume that the mortgage rate responds to monetary policy shocks in the same quarter. Conversely, the fed funds rate does not respond to shocks in mortgage rates in the same quarter. Although this identification is far from perfect, it is reasonable for our purposes, as much of the information in mortgage rates concerning future inflation should be captured by the other variables. Moreover, ordering the mortgage rate before the fed funds rate had little effect on the response of residential investment and home prices. Other studies have used more complicated “structural” decompositions based on theoretical considerations (for example, see Christiano, Eichenbaum, and Evans [1999]). For our purposes, the conclusions from these models are not substantially different from our simpler model. 24. Although we do not graph the standard error bands, it is worth noting that the maximum decline in residential investment is statistically significant in both periods, suggesting that the timing difference is significant. 25. However, there is a “home price puzzle” in the later period, as the initial response is positive. This may reflect two factors. First, sellers may be reluctant to realize losses in a downturn, either because of loan-to-value constraints (Stein 1995; Genesove and Mayer 1997) or loss aversion (Genesove and Mayer 2001). Second, ARMs may allow potential buyers to beat further prospective rate increases, sustaining demand for a time after a monetary tightening. 26. For more on how changes in short-term interest rate persistence have affected long-term rates, see Watson (1999). 27. For example, see Ryding (1990a, b). 28. An early example is Alberts (1962). Fair (1972) reviews many of the early studies. Another important development in this literature is Kearl (1979). The error-correction framework within our model has also been used by DiPasquale and Wheaton (1994). 29. Because the growth of the real housing stock averages only about 2.5 percent per year, assuming that the housing stock is given within a single period would appear to be innocuous for the quarterly data that we use. Our method for measuring the housing stock is described in Appendix A.
FRBNY Economic Policy Review / May 2002
155
Endnotes (Continued)
30. As in the VAR model, we use the repeat sales index from OFHEO to measure home prices.
36. Cointegration and the Johansen trace statistic are discussed extensively in Hamilton (1994).
31. See Appendix A for our definition and measurement of user cost.
37. Because the housing stock is assumed in the model to be fixed within a period, simultaneity problems usually associated when estimating a demand function do not apply here, and thus we estimate equation 3 using ordinary least squares.
32. For example, see Fair (1972), Rosen and Smith (1983), DiPasquale and Wheaton (1994), and Mayer and Somerville (2000). On the demand side, slow adjustment is characterized by lagged vacancy rates affecting prices, rents, and starts, which is not consistent with the simple model (see also McCarthy and Peach [2000]). On the supply side, slow adjustment is characterized by quantitative indicators of housing supply affecting housing investment, even after controlling for prices.
38. For example, see Fair (1972), Rosen and Smith (1983), and, in particular, DiPasquale and Wheaton (1994). 39. The role of interest rates and user costs in empirical investment models typically is smaller and less immediate than that implied in theoretical models; for example, see Chirinko (1993).
33. For example, see Rosen, Rosen, and Holtz-Eakin (1984). 34. Besides the substitution effect, the coefficient on tenant rent will be positive to the extent that high rent inflation today indicates higher rents tomorrow, which would increase the asset value of homes. 35. For example, see Topel and Rosen (1988), DiPasquale and Wheaton (1994), and Mayer and Somerville (2000).
156
Monetary Policy Transmission to Residential Investment
40. In contrast to equation 3, simultaneity bias may be a problem in estimating equation 4. We cannot assume that home prices in the supply side are fixed within a period. We therefore estimate equation 4 using the generalized method-of-moments, with the instruments identified in the notes to Table 3.
References
Alberts, William W. 1962. “Business Cycles, Residential Construction Cycles, and the Mortgage Market.” Journal of Political Economy 70, no. 3: 263-81. Bennett, Paul, Richard W. Peach, and Stavros Peristiani. 2001. “Structural Change in the Mortgage Market and the Propensity to Refinance.” Journal of Money, Credit, and Banking 33, no. 4 (November): 955-75.
Fair, Ray C. 1972. “Disequilibrium in Housing Models.” Journal of Finance 27, no. 2: 207-21. Genesove, David, and Christopher J. Mayer. 1997. “Equity and Time to Sale in the Real Estate Market.” American Economic Review 87, no. 3: 255-69.
———. 2001. “Loss Aversion and Seller Behavior: Evidence from the Housing Market.” NBER Working Paper no. 8143, March.
Bernanke, Ben S., and Alan S. Blinder. 1992. “The Federal Funds Rate and the Channels of Monetary Transmission.” American Economic Review 82, no. 4: 901-21.
Hamilton, James D. 1994. Time Series Analysis. Princeton, N.J.: Princeton University Press.
Bernanke, Ben S., and Mark Gertler. 1995. “Inside the Black Box: The Credit Channel of Monetary Policy Transmission.” Journal of Economic Perspectives 9, no. 4 (fall): 27-48.
Hendershott, Patric H. 1991. “An Altered U.S. Housing Finance System: Implications for Housing.” NBER Working Paper no. 3770.
Bradley, Michael G., Stuart A. Gabriel, and Mark E. Wohar. 1995. “The Thrift Crisis, Mortgage-Credit Intermediation, and Housing Activity.” Journal of Money, Credit, and Banking 27, no. 2: 476-97.
———. 1992. “The Market for Home Mortgage Credit: Recent
Case, Karl E., and Robert J. Shiller. 1989. “The Efficiency of the Market for Single-Family Homes.” American Economic Review 79, no. 1: 125-37. Chirinko, Robert S. 1993. “Business Fixed Investment Spending: A Critical Survey of Modeling Strategies, Empirical Results, and Policy Implications.” Journal of Economic Literature 31, no. 4: 1875-1911. Christiano, Lawrence J., Martin Eichenbaum, and Charles L. Evans. 1996. “The Effects of Monetary Policy Shocks: Evidence from the Flow of Funds.” Review of Economics and Statistics 78, no. 1: 16-34.
———. 1999. “Monetary Policy Shocks: What Have We Learned and to What End?” In John B. Taylor and Michael J. Woodford, eds., Handbook of Macroeconomics, 65-148. Amsterdam: North-Holland. Congressional Budget Office. 2001. “Interest Rate Differentials between Jumbo and Conforming Mortgages, 1995-2000.” May. DiPasquale, Denise, and William C. Wheaton. 1994. “Housing Market Dynamics and the Future of Housing Prices.” Journal of Urban Economics 35, no. 1: 1-27.
Changes and Future Prospects.” In The Changing Market in Financial Services, 99-123. Proceedings of the Fifteenth Annual Economic Policy Conference of the Federal Reserve Bank of St. Louis. Boston: Kluwer Academic Publishers. Hendershott, Patric H., and James D. Shilling. 1989. “The Impact of the Agencies on Conventional Fixed-Rate Mortgage Yields.” Journal of Real Estate Finance and Economics 2, no. 2: 101-15. Hendershott, Patric H., and Robert Van Order. 1989. “Integration of the Mortgage and Capital Markets and the Accumulation of Residential Capital.” Regional Science and Urban Economics 19, no. 2 (May): 189-210. Hendershott, Patric H., and Kevin Villani. 1977. Regulation and Reform of the Housing Finance System. Washington, D.C.: American Enterprise Institute. Herman, Shelby W. 2000. “Fixed Assets and Consumer Durable Goods for 1925-99.” Survey of Current Business 80, no. 9 (September): 19-30. Kahn, George A. 1989. “The Changing Interest Sensitivity of the U.S. Economy.” Federal Reserve Bank of Kansas City Economic Review, November: 13-34. Kearl, J. R. 1979. “Inflation, Mortgages, and Housing.” Journal of Political Economy 87, no. 5: 1115-38.
FRBNY Economic Policy Review / May 2002
157
References (Continued)
Mayer, Christopher J., and C. Tsuriel Somerville. 2000. “Residential Construction: Using the Urban Growth Model to Estimate Housing Supply.” Journal of Urban Economics 48, no. 1: 85-109.
Ryding, John. 1990a. “Housing Finance and the Transmission of Monetary Policy.” Federal Reserve Bank of New York Quarterly Review, summer: 42-55.
———. 1990b. “Housing Finance and the Transmission Mechanism McCarthy, Jonathan, and Richard W. Peach. 2000. “Rent Increases in the CPI: Are They Plausible?” Unpublished paper, Federal Reserve Bank of New York, November. Osterwald-Lenum, Michael. 1992. “A Note with Quantiles of the Asymptotic Distribution of the Maximum Likelihood Cointegration Rank Test Statistics.” Oxford Bulletin of Economics and Statistics 54, no. 3: 461-72. Poterba, James M. 1984. “Tax Subsidies to Owner-Occupied Housing: An Asset-Market Approach.” Quarterly Journal of Economics 98, no 4: 731-52. Pozdena, Randall J. 1990. “Do Interest Rates Still Affect Housing?” Federal Reserve Bank of San Francisco Economic Review, summer: 3-14.
of Monetary Policy.” In Studies on Financial Changes and the Transmission of Monetary Policy, 44-74. New York: Federal Reserve Bank of New York. Stein, Jeremy C. 1995. “Prices and Trading Volume in the Housing Market: A Model with Down-Payment Effects.” Quarterly Journal of Economics 110, no. 2: 379-406. Topel, Robert, and Sherwin Rosen. 1988. “Housing Investment in the United States.” Journal of Political Economy 96, no. 4: 718-40. Watson, Mark W. 1999. “Explaining the Increased Variability in LongTerm Interest Rates.” Federal Reserve Bank of Richmond Economic Quarterly 85, no. 4 (fall): 71-96. Weicher, John C. 1994. “The New Structure of the Housing Finance System.” Federal Reserve Bank of St. Louis Review, July/August.
Rosen, Harvey S., Kenneth T. Rosen, and Douglas Holtz-Eakin. 1984. “Housing Tenure, Uncertainty, and Taxation.” Review of Economics and Statistics 66, no. 3: 405-16. Rosen, Kenneth T., and Lawrence B. Smith. 1983. “The PriceAdjustment Process for Rental Housing and the Natural Vacancy Rate.” American Economic Review 73, no. 4: 779-86.
The views expressed are those of the authors and do not necessarily reflect the position of the Federal Reserve Bank of New York or the Federal Reserve System. The Federal Reserve Bank of New York provides no warranty, express or implied, as to the accuracy, timeliness, completeness, merchantability, or fitness for any particular purpose of any information contained in documents produced and provided by the Federal Reserve Bank of New York in any form or manner whatsoever. 158
Monetary Policy Transmission to Residential Investment