itations of currently available measurement tech- niques (11, 12). ... Florida Everglades (8), tend to predict a linear re- sponse, but there .... ed with the aid of a mechanistic model. ... balance between financial resources and scientific rationale.
Monitoring the Response to Changing MERCURY DEPOSITION
Scientists and policy makers need a cohesive framework ecause advisories have been posted
B
to evaluate the effectiveness
for so many water bodies against
of regulations on mercury
consumption of fish with elevated
emissions in the United
concentrations of potentially dan-
States and Canada.
gerous methylmercury (MeHg), regulations
limiting mercury emissions have been promulgated in many countries or are likely to be put forward in the near future (1–5). Yet, many questions about the environmental benefits of emissions reductions remain unanswered. Current computer models and other assessment tools provide widely divergent estimates for the effectiveness of emissions controls at reducing MeHg levels in fish (6– 8). In addition, no broad-scale data sets are available to test model predictions. Some intensive studies and syntheses of regional databases have been conducted, but their overall applicability to different ecosystems or at the continental scale is uncertain. The problem is that the terrestrial–aquatic mercury cycle is complex, with many nonlinear processes that link atmospheric mercury emissions and MeHg bioaccumulation in fish and wildlife (7; Figure 1). As a result, how efROBERT P. MASON CHESAPEAKE BIOLOGICAL LABORATORY, UNIVERSITY OF MARYLAND MICHAEL L. ABBOTT I D A H O N AT I O N A L L A B O R AT O RY
fective emissions reductions will be in decreasing biotic MeHg levels in freshwater, estuarine, and coastal ecosystems is not clear. Thus, any changes in the MeHg levels in aquatic ecosystems, particularly in fish and wildlife populations, should be documented
R. A. BODALY FISHERIES AND OCEANS CANADA O. RUSSELL BULLOCK, JR. NATIONAL OCEANIC AND ATMOSPHERIC ADMINISTRATION
and compared with reductions in mercury emissions and deposition. Although a significant effort has been made over the past decade to understand the causal link be-
CHARLES T. DRISCOLL SYRACUSE UNIVERSITY
tween mercury emissions and MeHg bioac-
DAVID EVERS BIODIVERSITY RESEARCH INSTITUTE
currently no coherent monitoring or assess-
STEVEN E. LINDBERG OAK RIDGE NATIONAL LABORATORY
cumulation into aquatic food chains, ment framework exists that can quantitatively document the temporal environmental changes in mercury levels across ecosystems. Clearly, it is crucial for scientists and policy
MICHAEL MURRAY NATIONAL WILDLIFE FEDERATION
makers to develop a monitoring framework
EDWARD B. SWAIN MINNESOTA POLLUTION CONTROL AGENCY
of current and pending regulation. This paper
© 2005 American Chemical Society
that can accurately evaluate the effectiveness proposes such a framework. JANUARY 1, 2005 / ENVIRONMENTAL SCIENCE & TECHNOLOGY ■ 15A
The monitoring strategy outlined here was developed in September 2003, by 32 mercury scientists from academia, industry, government, and nonprofit organizations in the United States, Canada, and Europe who were gathered in Pensacola, Fla., for a Society of Environmental Toxicology and Chemistry (SETAC)-sponsored workshop. The workshop was charged with identifying suitable chemical and biological indicators of mercury in the environment and proposing a network for measuring and documenting changes resulting from reductions in mercury emissions in the United States (10). The design of that kind of program is complicated by uncertainties, such as the sources of mercury deposition at any specific location and the sensitivity of different watersheds and water bodies to mercury input, specifically in terms of its rate of conversion to MeHg and its subsequent bioaccumulation. A holistic, multimedia, long-term monitoring approach is needed to detect change across such a diverse and complex system. Ideally, the program would begin immediately to establish a baseline and would continue for 15–20 years. FIGURE 1
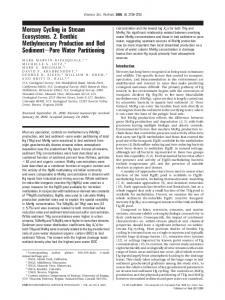
Major routes into the environment (a) Mercury can take several routes into ecosystems, including wet and dry deposition. (b) Most methylation of mercury takes place in aquatic systems.
Primer on mercury biogeochemical cycling Figure 1 indicates the links between mercury deposition and MeHg bioaccumulation in aquatic food chains. Atmospheric mercury occurs in two forms in the gas phase: elemental mercury (Hg0), which is the dominant form, and ionic HgII species, which are collectively termed reactive gaseous mercury (RGHg). This is an operational definition because of the limitations of currently available measurement techniques (11, 12). The dominant component of aerosol mercury (HgP) and of both dissolved and particulate matter in the aqueous phase is HgII. With a life16A ■ ENVIRONMENTAL SCIENCE & TECHNOLOGY / JANUARY 1, 2005
time of hours to days, RGHg is rapidly removed from the atmosphere, whereas less-reactive Hg0 has a residence time of up to a year (7, 13). Uptake of Hg0 by vegetation is now considered an important deposition mechanism. The different forms of mercury have varying reactivity following deposition. Dissolved HgII species can be reduced to Hg0 in surface waters. If waters become saturated with Hg0, then a substantial fraction is returned to the atmosphere via evasion (13). Reduction and re-emission also occur in terrestrial ecosystems. Although the time scale is not well determined, the route of mercury through watersheds to the aquatic system is thought to be slow and convoluted (14). It has been estimated that only a relatively small amount of the total input of mercury to most watersheds, typically