CROATICA CHEMICA ACTA CCACAA, ISSN 0011-1643, e-ISSN 1334-417X
Croat. Chem. Acta 85 (2) (2012) 139–145. http://dx.doi.org/10.5562/cca1966 Original Scientific Article
Monthly and Seasonal Variations of NO2, SO2 and Black-smoke Located Within the Sport District in Urban Area, City of Split, Croatia Marija Bralić,a Maša Buljac,a,* Neno Periš,b Marijo Buzuk,a Pero Dabić,a and Slobodan Brinića a
Faculty of Chemistry and Technology, Department of Environmental Chemistry, University of Split, Teslina 10/V, HR-21000 Split, Croatia b Teaching Public Health Institute of Splitsko-dalmatinska County, Department of Health Ecology, Vukovarska 46, HR-21000 Split, Croatia RECEIVED SEPTEMBER 8, 2011; REVISED NOVEMBER 29, 2011; ACCEPTED JANUARY 13, 2012
Abstract. This paper represents, for the first time, scientific data as a part of monitoring air quality in the city of Split. The city has a problem with the air pollution mostly caused by anthropogenic activities and partly by natural origin activities. This study presents results of monthly and seasonal variations of NO2, SO2 and black-smoke as well as the influence of meteorological parameters on observed concentration levels. Average seasonal values for SO2 ranged from 22.54 to 54.81 g m–3, for NO2 from 48.24 to 56.38 g m–3 and for black-smoke from 4.15 to 5.64 g m–3. The results obtained for SO2 and black-smoke were below, while for NO2 were above the limit value of pollutants in the air recommended by Croatian Government (Air Protection Act (OG 178/04); Regulation on limit values of pollutants in air (OG 133/05)). As the result of stable meteorological conditions (high temperatures and drought), the increase in SO2 concentration was significant in summer period, while the concentrations of NO2 and black-smoke were not significantly changed during year and did not depend on other parameters. (doi: 10.5562/cca1966) Keywords: air quality, SO2, NO2, black-smoke, seasonal variation, meteorological conditions
INTRODUCTION Urban air pollution and its impact on the urban air quality is a world-wide problem. It manifests itself differently in different regions, depending on economic, political and technological developments, on climate and topography and on the nature of the available energy sources. Although the air quality in European cities has generally improved in recent decades, air pollution is still considered to be a top priority environmental problem with both, urban and large scale impacts.1 Atmospheric releases of acidic pollutants, which include sulphur and nitrogen compounds in both gas and aerosol species can cause adverse health effects and have potential to cause other environmental damage (e.g. acid rain). Once released into the atmosphere either by man-made (anthropogenic) or natural sources, these compounds can undergo several different processes, such as transformations, due to the atmospheric reactions (e.g. gas to particle conversion), transport associated with wind and finally wet and dry deposition.2 Urbanization processes have increased pollution levels in urban areas which require long-term researches for
understanding.3 Produced mainly by the burning of fossil fuels, SO2 and NO2 are atmospheric gasses that contribute to acid deposition in terrestrial ecosystems by dry deposition and by precipitation in dissolved forms such as fogs and clouds. When converted into aerosols, they also impact visibility.4 SO2 is major acid rain precursor, and its oxidation product, sulphate, plays an important role in radiative forcing of climate.5 NO2 concentrations at urban and at street locations are controlled by NOx emissions due to combustion processes by industries, power production, household heating and traffic, and the ozone/NOx equilibrium.6 It is a reactive pollutant, produced by oxidation of nitrogen released into the atmosphere in the process of fuel combustion at high temperatures and it is a key component in creating secondary toxic pollutants. Nitrate in the rainfall is the final result of the multiphase reaction processes of nitrogenous gases, atmospheric particles and cloud water.7 The major nitric compound released in the atmosphere from biomass burning is nitric oxide (NO), subsequently oxidized into NO2.8 Black-smoke consists of large number of small particles of solid or liquid substances (aerosol) scattered
* Author to whom correspondence should be addressed. (E-mail:
[email protected])
140
M. Bralić et al., Variations of NO2, SO2 and Black-smoke Within Split, Croatia
in the air and created by the incomplete combustion of substances. They cover wide range from few nm in diameter to 100 or more m. They also vary in shape, chemical composition and optical properties. However, black-smoke data are known to be related to PM10 concentrations. Black-smoke consists of fine solid particles suspended in air, which mainly arise from incomplete burning of fossil fuels such as coal, oil and peat in domestic, industrial or transport sectors. Open fires in dwelling houses (fireplaces, wood stoves and cooking emissions) are major source of the particulate material emitted to air as a smoke. The main concern, associated with particulates, is their potential effect on human health, notably the respiratory system, since particles of small size can be inhaled into and deposited in the respiratory system and can remain there for long period of time. Also, it must be emphasized that the black-smoke contains a large number of organic compounds that are potentially carcinogenic. The influence of black smoke on human health is the subject of numerous studies that describe the relationship of black-smoke and mortality.9,10,11 Over the last two decades, black-smoke concentration was systematically determined by measurements of particulate matter in air.12,13 Concentration of pollutants is being influenced by the meteorology of the region. The accuracy of predicted concentration depends on detailed and accurate emission inventory of all sources and accurate measurement of meteorological parameters in that area.14 The aim of this study was to analyse monthly and seasonal variation of NO2, SO2 and black-smoke within the sports district urban areas and the influence of some meteorological parameters on the spatial and temporal dynamics of these pollutants. EXPERIMENTAL Study Area The city of Split, second largest city in Croatia, is economic, administrative, educational, sport and tourist centre of Middle Dalmatia, with an approximately 178 192 inhabitants (as per 2011 census). Split, with its surrounding area, is an important industrial centre with cement, plastic, food and textile industry and shipbuilding. Also, it is an important traffic centre (vehicular, ship and air traffic). The climate of Split is Mediterranean with hot, dry summer and wet, mild winter. Average annual air temperature is 17.2 C. December is the coldest month (average 8 C) and July the hottest (average 27.9 C). Annual average of 122 days with precipitation is recorded (annual average 188 mm). Monitoring station for air quality is located in the north-western part of the City of Split, which includes Croat. Chem. Acta 85 (2012) 139.
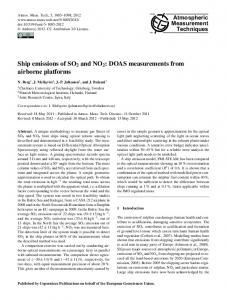
Figure 1. Monitoring area with sampling station (Poljud).
sport and recreation zones (pool, stadium and sports halls). The area is placed between the sea and road traffic with medium intensity and distanced about 2 km northern from cement and steel mills plants. The geographical coordinates for this station are 43°31'319'' N 16°25'871'' E (Figure 1). Sampling and Analysis Procedure The monitoring parameters used in the present study were collected from January 2007 to January 2008. The monitoring semi-automatic station was set-up outside the building, approximately 3 m above ground level. The samples were collect during 24 hours, as follow: (i) black-smoke particles were collected on filter paper with standard diameter (Whatman No.1). (ii) SO2 was absorbed and oxidized in sulphates by absorption in 1 % hydrogen peroxide solution (ISO-4219, 1979). (iii) NO2 were collected using a passive collector, adsorption on Whatman No.1 filter papers impregnated with a solution of triethanolamine and acetone in a ratio of 1:1. The pollutant concentrations were determinated in the laboratory. The mass concentrations of black-smoke were determined according to international standard (ISO-4219, 1979), and its optical density was measured by refractometer. The conversion of measured values of the reflection spots of diameter 25 mm in the mass values is performed using international calibration curve for OECD Whatman No.1. SO2 as sulphate was determined by titration with sodium tetraborate (ISO-4220, 1984). The mass concentration of NO2 was determined sectrophotometrically (Varian Cary 500 spectrophotometer) at a wavelength, λ = 540 nm (ISO 6768, 1998).15 Meteorological parameters (wind velocity and direction, relative humidity, rainfall and ambient temperature) were obtained from the Meteorological and Hydrological Institute of the Republic of Croatia, Department for Maritime Meteorology Split.
M. Bralić et al., Variations of NO2, SO2 and Black-smoke Within Split, Croatia
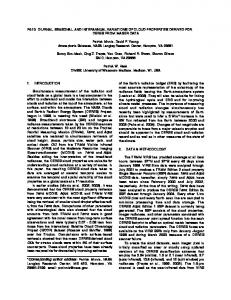
Figure 2. Monthly concentrations of SO2, NO2 and blacksmoke from January 2007 to January 2008.
RESULTS AND DISCUSSION The results presented in this paper are part of the systematic measurements which were carried out in 2007 as a part of the air monitoring study of the City of Split, which is continuously being carried out since 1960 by the Teaching Public Health Institute of Split-Dalmatia County, Department for Health Ecology.
141
As it can be seen from Figure 2, during the study period the highest monthly mean concentration of SO2 was 64.00 g m–3, while the highest daily concentration of SO2 (193.7 g m–3) was noticed in July. The annual average concentration during the study period was 33.41 g m–3. Figure 3 represents temperature and concentrations of pollutants during four seasons. The highest concentration of SO2 was recorded during summer, while the lowest was obtained in winter. Somewhat higher values for NO2 were observed in winter and were probably caused by increased emissions (e.g. from heating processes). However, unlike the concentrations of SO2, NO2, values were not significantly changed throughout spring, summer and autumn. In addition, the black-smoke concentration does not show significant seasonal variations. By increasing temperature during the summer time concentration of SO2 also increased. Figure 4 shows the dependence of average daily concentrations of SO2 with the change of average rainfall during the characteristic months in the season. High concentrations of SO2 in summer months can be attributed to high temperatures (average temperature in summer is 26.6 °C) and low humidity (Figures 4 and 5),
Figure 3. Seasonal variations in concentrations of SO2 (a), NO2 (b), black-smoke (c) and temperature (d) at the measuring station Poljud from January 2007 to January 2008. Croat. Chem. Acta 85 (2012) 139.
142
M. Bralić et al., Variations of NO2, SO2 and Black-smoke Within Split, Croatia
Figure 4. The influence of average rainfall on daily average concentrations of SO2.
leading to low-rate SO2 removal from atmosphere. Another reason may be due to evaporation from the sea surface, because the monitoring station is located near the seashore by the registered thermal springs containing SO2. Relatively high sulphate content within the incoming air masses during summer time can be explained by referring to sulphate formation mechanism. During summer, homogeneous conversion of SO2 to particulate sulphate can be assumed to be the main oxidation
Figure 5. Influence of cloudiness on the concentration of SO2. Croat. Chem. Acta 85 (2012) 139.
mechanism under the conditions generally prevailing over eastern Mediterranean region.16 In addition, lower concentrations of SO2, observed during winter months, can be explained analogously, by numerous rainy days, when removal of SO2 from the atmosphere is preferred. Other researchers in Mediterranean region have shown similar results.16,17,18 Also, some authors from other region reported similar results.2 It is well established that the inter-conversion of O3, NO and NO2 under atmospheric conditions is generally dominated by the following reactions: NO2 + h NO + O
(1)
O + O2 + M O3 + M
(2)
M (usually N2 or O2) represents a molecule that absorbs the excess vibrational energy and thereby stabilizes formed O3 molecule. h represents the energy of a photon (with a wavelength, λ < 424 nm) and O is active monoatomic oxygen molecule.19 Nitrogen dioxide is formed by the oxidation of nitric oxide (NO) emitted from combustion sources. Two major pathways are known for the NO2 formation in urban atmospheres: NO oxidation by peroxy radicals (radical channel) produced by photooxidation of
M. Bralić et al., Variations of NO2, SO2 and Black-smoke Within Split, Croatia
143
Figure 6. Frequency of wind direction.
nonmethane hydrocarbons (NMHC) and that by O3 (O3 pathway):20 NO + ROO• NO2 + RO•
(3)
NO + O3 NO2 + O2
(4)
These reactions therefore represent closed system in which NOx (NO and NO2) components and OX (O3 and NO2) components relate separately. Maximum concentration of NO2 in this investigation was reached in coldest and driest days due to increased fossil fuel consumption. Due to more stable atmospheric conditions in spring, the concentrations were lower comparing to winter ones, while lowest concentrations were measured in summer. Average monthly concentrations of NO2 ranged from 40.47 to 71.02 g m–3. The highest daily concentration of NO2 was observed in October (187.3 g m–3). The annual average of NO2 concentration was 50.37 g m–3 (Figure 2). Presented values correlate to those measured in Rampur,2 Osaka,20 and Barcelona.21 Average monthly concentrations of black-smoke were within the range of 4–7 g m–3. Daily maximum concentration was recorded in February and was 25 g m–3,
while the highest monthly concentration of black-smoke was recorded in March. The annual average concentration of black-smoke in the monitoring period (one year) was 5 g m–3 (Figure 2) and did not show significant deviations (Figure 3). Although distinguishable minimum of black smoke concentration in summer and little maximum in spring were expected , if we bear in mind major source of black-smoke, which are diesel-powered vehicles, our results are not in coherence with previous claim. Possible contribution to the pollution particles can be found in wind carry particles from the north where cement, steel mills and shipyard plants are located. The results of black-smoke concentration are similar to those reported in previous research studies.22,23 We must emphasis an importance of monitoring the concentration of black-smoke in the air, due to the fact that these particles have influence on respiratory system, which may result in fatal consequences. For that reason today to conduct studies that describes the relationship of smoke and mortality, especially in big cities worldwide.24 Thus, European first Daughter Directive (99/30/EC), as for legislation elsewhere, sets limits for PM10 (annual limit value is 20 g m–3) in recognition of the effects of particles on human health.22
Croat. Chem. Acta 85 (2012) 139.
144
M. Bralić et al., Variations of NO2, SO2 and Black-smoke Within Split, Croatia
Table 1. Spearman correlation among different pollutants and meteorological parameters in Split urban area for 4 seasons (statistically important correlations P < 0.01 are marked with bold letters, n = 124) SO2
NO2
NO2
–0.24
black-smoke
–0.10
–0.01
0.74
–0.10
average daily temperature
black-smoke
average daily temperature
daily rainfall
–0.02
daily rainfall
–0.36
0.08
0.10
–0.32
wind speed
–0.25
0.01
0.17
–0.24
0.33
cloudiness
–0.52
0.28
0.10
–0.42
0.41
Influence of Meteorological Parameters The relationship between ambient air quality data and meteorological parameters, such as wind speed, temperature, rainfall and relative humidity was evaluated in order to assess the influence of meteorological conditions on urban air quality.25 The wind and temperature measurements were one of the main factors influencing concentrations of air pollutants. The available set of data was divided into 16 main wind directions. The frequency of wind direction during the measurement period is presented in Figure 6. In our measurement prevailing wind direction were found to be from north-east, with an average wind speed from 2.9 to 4.3 m s–1. This has an important influence on concentration of pollutants, during days with dominant wind direction; if we bear in mind location of industrial pollution sources (see Section 2.1). Also, it is important to emphasize that the locations of the monitoring stations are always exposed to air currents either by sea or land. Furthermore, correlation between low summer wind speed and cloudiness and highest concentration of SO2 is evident in the examined period. As the concentrations of other pollutants (NO2 and black-smoke) did not significantly change during the year, there was no significant influence of the meteorological parameters. This is supported with obtained Spearman rank correlation coefficients between measurement meteorological parameters and air pollutants (Table 1). The resulting positive correlation of SO2 concentrations with average daily temperature, indicate that SO2 is accumulated in the atmosphere during warm days. However, negative correlation of SO2 concentrations with rainfall, wind speed and cloudiness can be attributed to its removal from the atmosphere, which can be seen on Figure 4 and Figure 5. Also, negative correlation between SO2 and NO2 indicates diverse removal paths from atmosphere and their different origin. Moreover, positive correlation of NO2 with daily cloudiness in winter was noticed. For the black-smoke concentrations any significant correlation did not found, as can be seen at Figure 2 and 3. Croat. Chem. Acta 85 (2012) 139.
wind speed
0.39
CONCLUSION This paper for the first time presents results of simultaneous measurement of NO2, SO2 and black-smoke concentrations in the urban area of Split, measured from January 2007 to January 2008. The results obtained for SO2 (33.41 µg m-3) and black-smoke (5.00 µg m-3) were bellow limits, while for NO2 (50.37 µg m-3) were above limit value by Regulation on limit values of pollutants in the air (OG 133/05) enacted by Government of the Republic of Croatia according to the law on air protection (OG 178/04). Comparison of seasonal pollutant concentrations suggests that the increase in SO2 concentration was significant in summer, while concentrations of NO2 increased in winter and black-smoke was not significantly changed. Negative correlation between wind speed and SO2 was noticed. Increase in SO2 concentration was significant in summer as a result of stabile meteorological conditions (high temperature and dry period). On the contrary, concentration of NO2 was significant in period from October to March, while the rest of year did not significantly change. Highest values were obtained in cloudiness period. Concentration of black-smoke did not significantly changed during the year and its concentration did not depend on other obtained parameters. Acknowledgements. The authors thank the Meteorological and Hydrological Institute of the Republic of Croatia, Department for Maritime Meteorology Split for making available the meteorological data.
REFERENCES 1. 2. 3. 4. 5. 6.
M. A. Žujić, B. B. Radak, and D. A Marković, J. Serb. Chem. Soc. 72 (2007) 889–899. A. Gupta, Atmos. Environ. 37 (2003) 4837–4846. L. Gratani and L. Varone, Atmos. Environ. 39 (2005) 2619–2624. Z. Y. Meng, G. A Ding, X. B. Xu, X. D. Xu, H. Q. Yu, and S. F. Wang, Sci. Total Environ. 390 (2008) 456–465. T. Wang, V. T. F. Cheung, K. S. Lam, G. L. Kok, and J. M Harris, Atmos. Environ. 35 (2001) 2735–2746. M. Keuken, M. Roemer, and S. van den Elshout, Atmos. Environ. 43 (2009) 4780–4783.
M. Bralić et al., Variations of NO2, SO2 and Black-smoke Within Split, Croatia 7. 8. 9. 10. 11. 12. 13. 14. 15. 16.
J. N. Mphepya, J. J. Pienaar, C. Galy-Lacaux, G. Held, and C. R. Turner, J. Atmos. Chem. 47 (2004) 1–24. A. Alebić-Juretić, Environ. Pollut. 154 (2008) 439–447. G. J. Prescott, G. R. Cohen, R. A. Elton, F. G. Fowkes, and R. M. Agius, Occup. Environ. Med. 55 (1998) 697–704. M. Carder, R. McNamee, I. Beverland, R. Elton, G. R. Cohen, J. Boyd, M. Van Tongeren, and R. M. Agius, Occup. Environ. Med. 67 (2010) 104–110. C. D. Bogdanović, S. D. Nikić, G. Z. Milošević, and M. A. Stanković, Cent. Eur. J. Med. 1 (2006) 292–297. A. Chaloulakou, P. Kassomenos, G. Grivas, and N. Spyrellis, Environ. Int. 31 (2005) 651–659. P. Quincey, Atmos. Environ. 41 (2007) 7964–7968. A. D. Bhanarkar, S. K. Goyal, R. Sivacoumar, and C. V. Chalapati Rao, Atmos. Environ. 39 (2005) 7745–7760. V. Vadić, Sigurnost 48 (2006) 243–256. V. Matvev, U. Dayan, I. Tass, and M. Peleg, Sci. Total Environ. 291 (2002) 143–154.
17. 18. 19. 20. 21. 22. 23. 24. 25.
145
E. Marmer, and B. Langmann, Atmos. Environ. 39 (2005) 4659– 4669. E. Yörük, Composition of Atmosphere at the Central Anatolia. Dissertation, University of Ankara (2004). S. Han, H. Bian, Y. Feng, A. Liu, X. Li, F. Zeng, X. Zhang, Aerosol Air Qual. Res. 11 (2011) 128–139. Y. Itano, H. Bandow, N. Takenaka, Y. Saitoh, A. Asayama, and J. Fukuyama, Sci. Total Environ. 379 (2007) 46–55. T. Moreno, J. Lavin, X. Querol, A. Alastuey, M. Viana, and W. Gibbons, Atmos. Environ. 43 (2009) 4178–4186. M. R. Heal, L. R. Hibbs, R. M. Agius, and I. J. Beverland, Atmos. Environ. 39 (2005) 3711–3718. L-W. A. Chen, B. G. Doddridge, and R. R. Dickerson, Geophys. Res. Lett. 28 (2001) 1711–1714. H. R. Anderson, S. A, Bremner, R. W. Atkinson, R. M. Harrison, and S. Walters, Occup. Environ. Med. 58 (2001) 504–510. A. K. Gupta, K. Karar, S. Ayoob, and K. John, Atmos. Res. 87 (2008) 103–115.
Croat. Chem. Acta 85 (2012) 139.