A peak in monarch butterfly mortality may coincide with the timing of their annual ... The number of monarch butterflies killed may have exceeded 500,000 ...
Journal of the Lepidopterists' Society 55(2). 2001. 63-68
MORTALITY OF LEPIDOPTERA ALONG ROADWAYS IN CENTRAL ILLINOIS DUANE D . MCKENNA KATHERINE M. MCKE NNA Department of Organismic and Evolutionary Biology, Harvard University, 26 Oxford Street, Cambridge, Massachusetts 02138, USA STEPHEN B. MALCOM Department of Biological Sciences, Western Michigan University, 3151 Wood Hall, 1903 W. Michigan Avenue, Kalamazoo, Michigan 49008, USA AND MAY
R. BERENBAUM
Department of Entomology, University of Illinois, 320 Morrill Hall, 505 S. Goodwin, Urbana, Illinois 61801, USA ABSTRACT. We conducted this study to inves tigate the magnitude of roadway mortality of Lepidoptera in central Illinois. To quantify the number and kinds of Lepidoptera killed along roadways, dead adult Lepidoptera were collected, identified, and counted from along 13 roadside transects in the vicinity of ChampaignIU rbana, Illinois, with collections occurring weekly on each transect for six weeks. During the six weeks of this study, 1824 presumably road-killed Lepidoptera were collected. At traffic rates of 1000, 13,500, and 19,700 vehicles per day, more Lepidoptera were collected per 100 m than at other traffic rates. A peak in monarch butterfly mortality may coincide with the timing of their annual migration through the area. Based on these data, the number of Lepidoptera killed along roadways for the entire state of Illinois during one week was estimated at more than 20,000,000 individuals. The number of monarch butterflies killed may have exceeded 500,000 individuals. Our results suggest that increases in traffic rate and speed limit may to a certain extent increase mortality. Additional key words:
Butterflies, Danaus plexippus, traffic.
Although roadway traffic is known to affect population densities of amphibians (Fahrig et al. 1995), snakes (Bernardino & Dalrymple 1992), koalas (Canfield 1991), wolves (Mech 1989), turkeys (Holbrook & Vaughan 1985), badgers (Davies et al. 1987), and other vertebrates (Lalo 1987, Putman 1997), practically nothing is known about the impact that roadways have on invertebrates (Seibert & Conover 1991 ). In fact , a recent book on butterfly conservation (New 1997) makes no mention of the subject, and roads are mentioned only briefly in two other recent books on insect conservation, as barriers to butterfly movement (Samways 1994, Pullin 1995). Samways (1994) states "Roads are line corridors that can cause high mortality where traffic volume is high. In 1989, 100 m of Tennessee roadside was a graveyard for over 120 traffickilled butterflies" (Samways 1994:117). Other than these sources, the best information on road mortality of butterflies is by Munguira and Thomas (1992) in England. They found that roads were not a serious barrier to butterfly movement, but that vehicles killed up to 7% of adult butterflies from some populations. Illinois has 2050 miles of interstate, 276 miles of toll road, 14,892 miles of highway, and 120,782 miles of county, municipal, and other roads (Illinois Department of Transportation pers. com. 1998). Although this
comprises the third largest state highway system in the United States, nothing is known about the magnitude of lepidopteran mortality along Illinois roadways. This study was conducted to investigate the magnitude of roadway mortality of Lepidoptera in central Illinois. To quantify the number and kinds of Lepidoptera killed, dead adult Lepidoptera were collected, counted, and identified from along 13 roadside transects in the vicinity of ChampaigniU rbana 40 0 2'N, 88°17W, Champaign Co., Illinois, with collections occurring weekly on each transect for six weeks. This study is the first to document systematically the magnitude of roadway mortality of Lepidoptera anywhere in the United States. MATERIALS AND METHODS
Eleven roadside transects were chosen at the outset of this study to represent different rates of traffic and different roadway types (Table I ). Traffic rates ranged from 0-26,000 vehicles per 24 hour period (Illinois Department of Transportation (lOOT) pers. com. ). To facilitate comparisons, traffic rates above 500 vehicles per day were rounded to the nearest 100. Each roadside transect fit into one of the following general plant community types: remnant prairie, agriculture, or woodland. Roadways were classified into four types:
64
JOURNAL OF THE LEPIDOPTERISTS' SOCIETY
TABLE 1.
Transect numher I 2 3 4
5 6 7 8 9 10 II
12 13
Transect
nmne Highway 150 #1 Highway 150 #2 Highway ISO #.3 Cunningham #1 Cunningham #2 Cunningham #3 1-74 M-,57 Trelease \"Ioods Brownfield Woods Airport Grass Control Country Road Control Highway 150
Roadway type Highway Highway Highway Divided Ilighway Divided Highway Divided Highway Interstate Interstate Country Road Country Road N/A (Mowed Airfield) Country Road Paved Country Road
Transect Characteristics. Roadside community type * Prairie/Ag Prairi e/Ag Prairie/Ag Ag Ag Ag Ag Ag Old Field/Woodland Woodland Mowed Grass Ag Prairie/Ag
Transect length (m) 150 250 180 180 250 180 200 200 160 200 100 200 600
Speed limit (mph ) 55 5.5 55 5.5 55 5.5 65 6.5 35 0-35*** N/A 0-45 *** 45
Vehicles/24 hours ** (#Vehicles ) 1,000 1,000 1,000 ]3,500 13,500 13,500 26,000 19,700 150 1000 0 150 50
* Ag ~ Agriculture. **The number of ve hicl es per day (24 hour period) was obtained through the Illinois Division of Highways . *** The range of speeds given are those typically observed for vehicl es accelerating from the stop signs at the beginning of these transects.
paved country road, highway, divided highway, and interstate. One additional transect was chosen to control for the effects of roadside mowing. A second additional transect was chosen to quantify the baseline mortality in mowed grass, a habitat rese mbling the mowed roadsides of all transects . Two transects were abandoned one week into the study due to road construction. These transects were replaced with two new transects, and two interstate transects were also added, for a total of 13 transects (Table 1). The nine original transects were first sampl ed on 25 August 1998. The two replacement transects were first collected on 2 September 1998, and the two interstate transects were first collected on 9 Scptember 1998. We collected along transects weekly until 19 October] 998. Over the two weeks after that date, no dead Lepidoptera were found and the sampling was terminated. Once every seven days each transect was walked and road-killed Lepidoptera were collected into a plastic bag. All 1.3 transects were collected ovcr a two-day period each week. Transects with a median were searched on all sides of the road, including both sides of the median. As a safety precaution, the medians of interstate transects were not sampled. Both sides of the road were walked against the flow of traffic. Lepidopte ra were collected that lay dead within two meters of the edge of the road. This usually included the shoulder and about one meter of "ditch". Lepidoptera lying on the roadway itself were not collected, but fewer than 10 such individuals were noticed throughout the entire study. Transect length varied from 100 to 610 m, with a mean of 219 m and standard deviation of 121 m (Table
I ). A total of 2850 m of transect was sampled during weeks when all 13 transects were sampled. The Thomasboro, Illinois office of the Illinois Division of Highways repOlted that transect locations received similar roadside maintenance, but on different days. Typical maintenance included mowing and trash removal. After collection, the Lepidoptera were sorted by species or speci.es-group and were counted. They were sorted into six taxonomic groups: 1. Hesperiidae, mostly Epargyreus clarus (silverspotted skipper). 2. Lycaenidae, which were not ide ntified below the family level. 3. Moths , mostly Arctiidae and Noctuidae, grouped together because too few individuals from most families were collected to warrant separate treatment. 4. Nymphalidae, including Danaus plexippus (monarch ), Euptoieta claudia (variegated fritillary), Libytlieana carineta (American snout butterfly), Limenitis archippus (viceroy), Limenitis arthemis astyanax (red-spotted purple), Phyciodes tharos (pearl crescent) , Polygonia interrogationis (question mark), Junonia coenia (common buckeye), and Vanessa cardui (painted lady). 5. Papilionidae, represented in the roadside transects only by Papillo polyxenes (black swallowtail). 6. Pieridae, including Colias eurytheme (yellow sulfur) and Coli as philodice (clouded sulfur) , which due to hybridization and difficulty in separation into species were grouped together and called the C. eurytheme/C. philodice hybrid complex. Pieridae also included Eurema lisa (little yellow) and Pieris rapae (cabbage whitc).
YQLUME55,NuMBER2
65
1,510 .8
.6
.s 4 ·
.2
214
Pieridae
Nymphalidae
Moths
15
13
Hesperi idae
Papillionidae
3 Lycaenidae
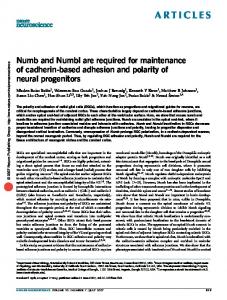
Group FIG . 1. Proportion of total mortality for each group of Lepiuopte ra stuuied. The total number of individuals collected lJ'om each group is given above each column. N = 1824.
Data were analyzed using analysis of variance (ANOYA) techniques. Weeks one and two were exduded from the analyses because they included data for only a subset of the 13 transects. Results were considered significant at p ~ .05. Calculations of theoretical statewide mortality were made by multiplying the number of meters of roadway in Illinois of each of the roadway "types" (see above) by the number of butterflies killed pe r meter of roadside transect for each roadway type during the week of 9 September 1998 (IDOT pers. com.). RESULTS During the six weeks of this study, 1824 Lepidoptera we re collected from along the 13 roadside
transects, including 10510 Pieridae, 214 Nymphalidae, 69 moths, 15 Hesperiidae, 13 Papilionidae, and 3 Lycaenidae (Fig. 1). Insects b elonging to orders other than Lepidoptera were only infrequently encountered and are not reported here. The greatest number of Lepidoptera killed p er 100 m of transect occurred during week 1 (Fig. 2). Mortality decreased thereafter, except for a slight increase at week 4. Not included in the figures are the last two weeks of transect samples during which no dead Lepidoptera were found. The first week of collection resulted in the two highest mortality rates per 100 m recorded for any of the traffic rates during the study (Table 2). At 1000, and 13,500 vehicles per day, 051.28 and 49.34 individuals
so 8 0 0
.-...0-
45 40
"0
35
Q
30
.-....'"
25
~ +-'
00 "0 20
'i5.. .-
"'0"'
15
j
4-