PERSPECTIVES IN DIABETES
Metabolomics Applied to Diabetes Research Moving From Information to Knowledge James R. Bain, Robert D. Stevens, Brett R. Wenner, Olga Ilkayeva, Deborah M. Muoio, and Christopher B. Newgard
T
ype 2 diabetes is caused by a complex set of interactions between genetic and environmental factors. Recent work has shown that human type 2 diabetes is a constellation of disorders associated with polymorphisms in a wide array of genes, with each individual gene accounting for ⬍1% of disease risk (1). Moreover, type 2 diabetes involves dysfunction of multiple organ systems, including impaired insulin action in muscle and adipose, defective control of hepatic glucose production, and insulin deficiency caused by loss of -cell mass and function (2). This complexity presents challenges for a full understanding of the molecular pathways that contribute to the development of this major disease. Progress in this area may be aided by the recent advent of technologies for comprehensive metabolic analysis, sometimes termed “metabolomics.” Herein, we summarize key metabolomics methodologies, including nuclear magnetic resonance (NMR) and mass spectrometry (MS)-based metabolic profiling technologies, and discuss “nontargeted” versus “targeted” approaches. Examples of the application of these tools to diabetes and metabolic disease research at the cellular, animal model, and human disease levels are summarized, with a particular focus on insights gained from the more quantitative targeted methodologies. We also provide early examples of integrated analysis of genomic, transcriptomic, and metabolomic datasets for gaining knowledge about metabolic regulatory networks and diabetes mechanisms and conclude by discussing prospects for future insights. In principal, metabolomics can provide certain advantages relative to other “omics” technologies (genomics, transcriptomics, proteomics) in diabetes research: 1) Estimates vary, but one current source, the Human Metabolome Database (HMDB)-Canada (3), currently lists ⬃6,500 discrete small molecule metabolites, significantly less than the estimate of 25,000 genes, 100,000 transcripts, and 1,000,000 proteins. 2) Metabolomics measures chemical phenotypes that are the net result of genomic, transcriptomic, and proteomic variability, therefore providing the most integrated profile of biological status. 3) Metabolomics is in theory a precise tool for discerning mechanisms of action and possible toxicological effects of drug theraFrom the Sarah W. Stedman Nutrition and Metabolism Center, Department of Pharmacology and Cancer Biology and Department of Medicine, Duke University Medical Center, Durham, North Carolina. Corresponding author: Christopher B. Newgard,
[email protected]. Received 21 April 2009 and accepted 3 August 2009. DOI: 10.2337/db09-0580 © 2009 by the American Diabetes Association. Readers may use this article as long as the work is properly cited, the use is educational and not for profit, and the work is not altered. See http://creativecommons.org/licenses/by -nc-nd/3.0/ for details. diabetes.diabetesjournals.org
pies. However, metabolomics is still a field in its infancy, with significant limitations and potential for misuse of technologies and overinterpretation of data. Here we seek to provide a critical evaluation of progress to date in application of metabolomics technologies for the understanding of diabetes and obesity mechanisms, for subclassification of different forms of diabetes to assist in tailoring of therapeutic strategies, and for more detailed evaluation of the safety and efficacy of drugs used to treat the disease. Overview of current metabolomics technologies. Genome-wide association studies and mRNA profiling by microarray analysis are relatively mature technologies that have developed to a point where core laboratories that provide these services are common in both the academic and private sectors. This is not yet the case for metabolomics. One reason for this is the complexity inherent in measuring large numbers of intermediary metabolites with diverse chemical properties in a quantitatively rigorous and reproducible fashion. Underlying issues include the wide-ranging concentrations of metabolites in tissues and bodily fluids (ranging from subnanomolar to millimolar), problems encountered in efficient extraction of metabolites from different biological matrices (e.g., tissues, blood, urine), and the chemical diversity of the analytes. Given these variables, it is perhaps not surprising that no single technology exists for measurement of all of the metabolites in the “metabolome.” Instead, groups that practice comprehensive metabolic profiling do so with quite diverse sets of instruments and methods for data analysis, the choice of which is influenced by factors such as cost, personal experience, and specific research goals. This places a large burden on the current core labs and their clients to ensure reproducibility of their findings in the absence of very little standardization of methods across groups. The U.S. National Institutes of Health has recognized the problem and recently convened a workshop on development of standardized methods for metabolomics, leading to a summary of recommendations (4). The two major instrument platforms for measuring metabolite levels in biological samples are NMR and MS (5–13). Raman and infrared spectroscopy (14) and liquid chromatography coupled to ultraviolet or coulometric electrode array detection (15) have also been used by several labs. In general, research groups in the field tend to fall into two camps that adopt either “nontargeted/topdown” approaches or “targeted/bottom-up” methods as their core technologies, although a few groups, including our own, have both kinds of platforms in their repertoire. Targeted methods. For scientists with core interests in biological mechanisms rather than biomarkers, knowledge about the identity of metabolites being surveyed and their exact concentrations is essential. This encourages some DIABETES, VOL. 58, NOVEMBER 2009
2429
METABOLOMICS APPLIED TO DIABETES RESEARCH
A Targeted method
B Non-targeted method
Sample
Control Samples
Experimental Samples
Add Internal Standards (IS)
Extraction of Metabolites
Extraction of Metabolites
LC-MS Analysis
LC-MS Analysis
Extract Metabolites/IS
Derivatize Metabolites/IS
Data Extraction
Mass Spec Analysis
Statistical Analysis (ANOVA, PCA, etc.)
Data Extraction
Metabolite Identification (database search, MS/MS)
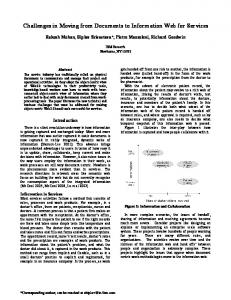
Ratio Metabolites:IS for Quantification FIG. 1. Schematic summary of targeted and nontargeted metabolomics methods. A: When using targeted methods, quantification of specific analytes is facilitated by addition of stable isotope-labeled standards to the sample prior to the sample extraction and derivatization steps. This allows reporting of targeted analytes in true units of measure (e.g., mol/l). B: In contrast, when performing nontargeted analysis, the goal is usually to obtain a global comparison of a large number of analytes across several classes. This is achieved by assaying replicate samples from contrasting conditions (e.g., drug-treated vs. control cells). Samples are processed and analyzed by MS to generate two independent datasets that are subjected to univariate and multivariate statistical analysis to identify features that are different between the two conditions, although in the absence of added standards, the concentration of the analytes is not reported in true units of measure. In addition, for many of the peaks, the chemical identity of the metabolite cannot be immediately discerned due to limitations in current spectral and chemical standard libraries. PCA, principal components analysis.
metabolic profiling laboratories to emphasize targeted and quantitative MS-based analyses. These methods focus on quantification of discrete clusters of chemically related metabolites within a “module” using various combinations of chromatographic separations technologies and MS instruments that are most compatible with the analyte class. Most targeted metabolic profiling methods use stableisotope dilution for accurate quantification of analytes, involving addition of several stable isotope–labeled standards to the biological sample prior to the extraction and derivatization steps that may be necessary for the particular MS approach (Fig. 1A). Ideally, each unknown analyte will be paired with its labeled cognate (often an M⫹3 heavy isotope, e.g., methionine with methyl-D3 methionine, pyruvate with 13C3-pyruvate, etc.) to control for differences in analyte loss during sample processing and to compensate for ionization-suppression effects (example in Fig. 2). One limitation of this approach is the relatively narrow range of stable isotope–labeled standards that are available from commercial suppliers and their significant cost. Several groups are now engaged in expanding standard libraries through custom synthesis, but with the reagents available today, most labs are limited to measurement of ⱕ300 discrete metabolites by targeted methods. Although targeted metabolomics platforms tend to use conventional instruments such as electrospray ionization (ESI)-tandem MS-MS and gas chromatography (GC)-MS, significant challenges must still be overcome in building rigorous and fully vetted analysis modules for groups of metabolites. For example, when using GC-MS for measurement of fatty acids or organic acids, chromatography is performed in the gas phase at a high temperature, and 2430
DIABETES, VOL. 58, NOVEMBER 2009
analytes must be volatile and have sufficient thermal stability to survive the analysis. To help stabilize the analytes under study, reactive carboxyl, carbonyl, sulfhydryl, amine, or hydroxyl groups are derivatized by akylation, oximation, acylation, or silylation (5,11,16,17). These methods, while effective, add complexity beyond that already introduced by sample extraction to the analytical procedures and can result in batch-to-batch variation if not properly controlled. Similarly, analysis of acylcarnitines or amino acids/urea cycle intermediates by ESI-MS-MS requires module-specific derivatization, specifically treatment with acidic methanol for acylcarnitines and n-butanol for amino acids/urea cycle intermediates (17– 20). Nevertheless, experience has proven that these methods can be deployed for reliable and quantitative analysis of metabolite modules, with coefficients of variation in replicate assays of major analytes of ⬃15% or less. Targeted and nontargeted MS-based metabolic analysis has been applied for years in the clinical diagnosis of metabolic disease and newborn screening, and today it is used to detect ⬎40 different genetic diseases of lipid and amino acid metabolism (21,22). In these applications, less emphasis is placed on absolute quantification of multiple analytes in a module, since the screen only requires detection of differences in a single or discrete cluster of analytes with respect to established laboratory norms. For example, a defect in HMG-CoA lyase results in large and specific increases in 3-hydroxy-isovaleryl-carnitine and 3-methylglutaryl-carnitine species detected by MS-MS, whereas defects in long-chain 3-hydroxyacyl CoA dehydrogenase (LCHAD) or mitochondrial trifunctional protein diabetes.diabetesjournals.org
J.R. BAIN AND ASSOCIATES
A
Total Ion Chromatogram 2.13
100
lactate
90 80
fumarate 3.18
70 60 50 40 30
pyruvate α-Kg
2.25
20 10
2.52 2.53 2.68 2.81
2.33
0 2.0
2.2
2.4
2.6
2.8
citrate
3.68
3.05
3.22 3.36
3.0
4.03
malate
succinate 3.2
3.61
3.4
3.6
3.85 4.00
3.8
4.0
4.20 4.27
4.2
4.48 4.58
4.4
4.70
4.95
4.6
4.8
Time (min)
B 100
Single ion monitoring (SIM) of derivatized pyruvate and its internal standard 188.00
pyruvate
90 80 70 60 50 40 191.00
30
13C
20
3-pyruvate
10 219.00
0 188
190
192
194
196
198
200
202
204
206
208
210
212
214
216
218
220
222.00
222
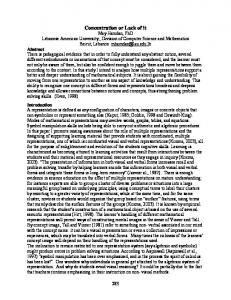
m/z FIG. 2. Targeted isotope-dilution analysis of organic acids by GC-MS. When performing targeted isotope-dilution analysis, a group of heavy isotope standards specific to the assay module are added immediately following sample homogenization and prior to chromatographic resolution and MS. A: Total ion chromatogram following GC of a rat liver homogenate in which multiple organic acids are resolved. B: Single ion monitoring for pyruvate and its corresponding internal standard. Each organic acid peak in the chromatogram (A) contains the target analyte and a heavy stable isotope as an internal standard, which are resolved and quantified by mass spectrometry (B) as shown for pyruvate, for example.
(MTP) are associated with increases in 3-hydroxy-palmitoyl and 3-hydroxy stearoyl-carnitine metabolites (22). In more recent years, many of the MS-based targeted metabolic profiling techniques developed for diagnosing inborn errors of metabolism have been adopted, refined, and supplemented for studies of mechanisms of disease pathogenesis. The approach taken in our laboratory has been to assemble multiple targeted MS-based assay modules that in aggregate report on several critical metabolic pathways (17–20). Using a combination of GC-MS and MS-MS, we are currently able to perform quantitative analysis of ⬃180 metabolites in seven groups, as summarized in Table 1. Although the total number of analytes measured with these tools is small relative to estimates of 6,500 total metabolites in the metabolome, they are nevertheless highly useful for understanding changes in metabolic function under different physiological and pathophysiological circumstances. Moreover, expansion of the platform to include a broader range of analytes of interest in disease pathogenesis is possible in the near term. A particular recent focus of the metabolomics community has been in the area of “lipidomics,” and methodologic advances are diabetes.diabetesjournals.org
beginning to emerge for profiling of phospholipids, prostaglandins, and their metabolites (eicosanoids) and sphingolipids (9 –13). “Shotgun lipidomics,” or the broad survey of neutral lipids such as triacylglyerols and diacylglyerols, including the profiling of the acyl side chains of these TABLE 1 Analyte modules in the Stedman Center laboratory and methods of analysis 1) Free fatty acids of varying chain length and degrees of saturation (GC-MS) 2) Total fatty acids (free ⫹ esterified) (GC-MS) 3) Acylcarnitines of varying chain length and degrees of saturation (representing precursors and products of mitochondrial fatty acid, amino acid, and carbohydrate oxidation) (MS-MS) 4) Acyl CoAs of varying chain length and degree of saturation (MS-MS) 5) Organic acids (TCA cycle intermediates and related metabolites) (GC-MS) 6) Amino acids, including urea cycle intermediates (MS-MS) 7) Ceramides and sphingolipids (MS-MS) DIABETES, VOL. 58, NOVEMBER 2009
2431
METABOLOMICS APPLIED TO DIABETES RESEARCH
molecules, is another emergent technology. Early methods focused on separation of neutral lipid species by thin-layer chromatography followed by capillary GC and detection of lipid species with a flame-ionization detector (23). More recent studies use a four-step procedure that includes organic phase extraction (Bligh and Dyer method), intrasource separation of lipid species based on propensity for ionization, separation of ionized species by tandem-MS, and processing of data to assign molecular species and determine relative abundances (24). It should be emphasized, however, that development of new targeted modules is not a trivial or inexpensive undertaking, since it requires acquisition or synthesis of stable isotope–labeled internal standards, development of extraction procedures that are efficient for multiple analytes in a class, tailoring of protocols specific to the various biological matrices, and demonstration of quantitative reproducibility of the methods. The advantage gained is that such tools can be applied to the understanding of metabolic regulatory mechanisms in isolated cells, animal models of disease, and human disease states. Nontargeted metabolite profiling. Nontargeted profiling involves use of NMR, MS, or complementary technologies for measurement of as many metabolites as possible in a biological specimen simultaneously, regardless of the chemical class of the metabolites. In contrast to targeted profiling, in which added internal standards allow quantification of specific metabolites in molar units, nontargeted metabolomics generally adopts a strategy of comparison of two biological states and reporting of those analytes that qualitatively differ in the two states based on statistical analysis (Fig. 1B). When applied to nontargeted profiling, both NMR and MS have advantages and limitations, and neither technology can currently be used for surveying all of the metabolites in a sample in a quantitative fashion. NMR spectroscopy is theoretically an excellent tool for nontargeted metabolic profiling of all small molecule metabolites, since the method detects spectral features emanating from any molecules that contain carbon or hydrogen (5,7). Moreover, analyses can be conducted directly in bodily fluids, cells, and even in intact tissues without the need for chemical extraction or derivatization of the analytes. These advantages are offset by significant technical challenges, including poor sensitivity, effects of pH and ionic strength, and the difficulty of deconvolution and normalization of spectra of complex metabolite mixtures in biological matrices like plasma, urine, or tissue extracts. Thus, although NMR spectra are information rich, lack of sensitivity and data complexity limit quantitative profiling to ⱕ100 metabolites in most biological samples by current methods. In some applications, NMR datasets are analyzed by statistical tools such as principal components analysis to identify spectral features (often not identified as specific metabolites) that characterize different biological or disease states (7,25). MS has the immediate advantage of much higher sensitivity compared with NMR, and the most advanced MS platforms such as Fourier transform ion cyclotron (FTICR)-MS have the ability to detect metabolites in the femtomole range (11). Moreover, modern MS platforms such as those that incorporate time of flight (TOF), orbitrap, and FT-ICR mass analyzers offer very high mass resolution and mass accuracy. FT-ICR-MS, for example, is capable of achieving a mass resolution of ⬎100,000 while providing mass accurate measurements of ⬍1 ppm. By coupling such MS instrumentation with high-resolution 2432
DIABETES, VOL. 58, NOVEMBER 2009
chromatographic technologies (e.g., ultra high–pressure liquid chromatography [UHPLC] and sub-2 m particle stationary phases), it has become possible to resolve literally thousands of individual small molecules. Seemingly, these platforms could circumvent problems encountered when using NMR methods for nontargeted metabolic profiling of complex biological matrices. In practical reality, the variable lability, solubility, recovery, ionization, and detection of the different analyte species, coupled with the lack of comprehensive spectral and stable isotope–standard libraries, make these nontargeted MS methods semi-informed (with regard to analyte identities) and semiquantitative at best. Concerns about the semiquantitative nature of the methods can be overcome to some extent by focusing on tightly controlled biological conditions (e.g., cell lines in tissue culture studied in response to individual drug, nutrient, or gene manipulations) and performance of multiple replicate experiments. Under these conditions, statistical filtering can be applied to peak areas for well-resolved spectral features, thereby identifying analytes that change in a consistent fashion. However, ultimate proof of a significant change in an analyte still requires targeted analysis against an internal standard. The next challenge is identification of the chemical entities represented by the individual peaks. Help comes from high-accuracy mass measurements afforded by current high-end MS instruments. These mass measurements can be used to query databases such as METLIN, HMDB, KEGG, Madison Metabolomics Consortium Database (MMCD), and ChemSpider for chemical formulae whose theoretical masses match the experimentally determined mass, thereby usually providing a strong starting point for identifying the analyte. In most laboratories, current capabilities allow provisional or outright identification of ⱕ30% of analytes in complex spectra obtained through nontargeted MS methods. Overall, it seems clear that further development of technologies for nontargeted metabolic profiling will be required before these tools can be maximally informative in the whole animal or human settings. In contrast, several examples of application of targeted profiling for gaining new insights into diabetes, obesity, and other chronic metabolic diseases have emerged recently, as will be discussed. Use of targeted profiling and NMR-based metabolic flux analysis for studies of insulin secretion. NMRand MS-based tools have been used to investigate the process of glucose-stimulated insulin secretion (GSIS) in pancreatic islet -cells (26 –35). Stimulation of islet -cells with glucose causes increases in insulin secretion within seconds to minutes, and this response is mediated by signals that are generated by -cell glucose metabolism. A commonly accepted idea is that increases in the rate of glucose metabolism in -cells leads to increases in ATPto-ADP ratio, which causes inhibition of ATP-sensitive K⫹ channels (KATP channels), membrane depolarization, activation of voltage-gated calcium channels, and Ca2⫹-mediated activation of insulin granule exocytosis (36,37). However, this model clearly does not provide a complete description of signals that regulate GSIS, since pharmacologic or molecular inhibition of KATP channel activity still allows robust regulation of insulin secretion by glucose (38,39). This has led to recent investigation of alternate metabolic pathways and their byproducts in control of GSIS (rev. in 35). Application of 13C NMR-based isotopomer analysis and diabetes.diabetesjournals.org
J.R. BAIN AND ASSOCIATES
Insulin Secretion
Mitochondrial Matrix
Cytosol
Pyruvate PDH
PC
?
Acetyl - CoA
NADPH
α-ketoglutarate
Oxaloacetate Citrate Malate
Citrate CIC
? Isocitrate
Isocitrate
Fumarate ICDc α-ketoglutarate
Succinate
NADPH α-ketoglutarate
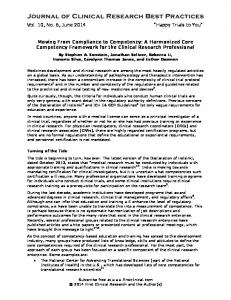
SuccinylCoA FIG. 3. Schematic diagram of a pyruvate/isocitrate cycle implicated in control of GSIS. The cycle is initiated by anaplerotic conversion of pyruvate to oxaloacetate by PC. This leads to accumulation of the TCA cycle intermediates citrate and isocitrate and their export from the mitochondria to the cytosol by the CIC. Citrate is then converted to isocitrate by cytosolic aconitase, and isocitrate is converted to ␣-ketoglutarate by the cytosolic NADP-dependent ICDc. ␣-Ketoglutarate can then serve either as a direct signal for insulin secretion, for example, by serving as a substrate for ␣-ketoglutarate hydroxylases, or be recycled to pyruvate by one of several mitochondrial or cytosolic pathways that remain to be defined (dashed lines). Another byproduct of the pyruvate/isocitrate cycle with potential as an insulin secretagogue is cytosolic NAPDH, possibly acting through Kv channels or the glutathione/glutaredoxin system. This pathway was elucidated by integration of flux analysis by 13C NMR, targeted metabolic profiling by GC-MS and MS-MS, and evaluation of the effects of knockdown of key genes in the pathway, including CIC and ICDc.
MS-based profiling of intermediary metabolites led to the discovery of a critical link between pyruvate carboxylase (PC)-mediated pyruvate exchange with tricarboxylic acid (TCA) cycle intermediates (“pyruvate cycling”) and GSIS and demonstration that these pathways are dysregulated in lipid-cultured and dysfunctional -cells (26 –35). More recent studies have focused on identification of the specific pyruvate cycling pathways that may be involved in generation of signals for insulin secretion. One important pathway appears to involve export of citrate and/or isocitrate from the mitochondria via the citrate/isocitrate carrier (CIC) and subsequent conversion of isocitrate to ␣-ketoglutarate (␣-KG) by the cytosolic NAPD-dependent isoform of isocitrate dehydrogenase (ICDc) (30,31) (Fig. 3). In the foregoing studies, measurement of pyruvate cycling flux was accomplished by incubation of -cells in low (3 mmol/l) or high (12 mmol/l) concentrations of U-13C glucose for several hours, followed by extraction of cells and analysis of glutamate spectra by NMR. Specific resonances for each of the carbons of glutamate are affected by the population of mass isotopomers (glutamate with varying mixtures of 13C and 12C at each of the five carbons of the molecule), and this information can be used to calcudiabetes.diabetesjournals.org
late flux through the oxidative (PDH) and anaplerotic (PC) entry points of the TCA cycle (26,27,40). These methods reveal that the capacity for GSIS in variously glucoseresponsive INS-1– derived cell lines is tightly correlated with PC-catalyzed pyruvate cycling activity but not PDHcatalyzed glucose oxidation (26 –28). Metabolic flux analysis by NMR can be integrated with static metabolite profiling by MS to gain a more complete picture of fuel-sensing pathways in the -cell. For example, GC-MS was used to demonstrate a fall in cytosolic citrate levels in response to siRNA-mediated suppression of CIC, as would be expected if a major pathway for export of citrate from the mitochondria to the cytosol is blocked (31). Other recent experiments show that glucose stimulation of -cells results in increases in several TCA cycle intermediates in whole-cell extracts (30,41), but a selective release of only the early TCA cycle intermediates citrate and ␣-KG into the medium, with no change in medium levels of the later TCA cycle intermediates malate, fumarate, or succinate (M. Jensen, H.E. Hohmeier, O.I., and C.B.N., unpublished observations). These results serve to confirm that glucose causes a significant release of citrate from the mitochondria and is consistent with the converDIABETES, VOL. 58, NOVEMBER 2009
2433
METABOLOMICS APPLIED TO DIABETES RESEARCH
A SYSTEMIC LIPIDS IR
NEFA VLDL-TAG
Glut4
Insulin Action
pSer
Alternative Model Prevailing Theory
serine kinases Incomplete fat oxidation Mitochondrial Stress
TAG
• lipid signaling • glycerolipids • depletion of TCAI • metabolic inflexibility
LC Acyl-CoA
X CPT1
β-oxd
X
TCA
CO2
ETS
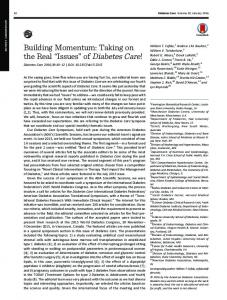
exercise combats mitochondrial stress mitochondria sarcolemma FIG. 4. Mechanistic models of lipid-induced impairment of muscle insulin action and supporting metabolomics data. Feeding of diets high in fat results in muscle insulin resistance, and recent studies suggest the operation of two possible mechanisms for this effect (A). A prevailing theory is that increased delivery of fat to muscle saturates the capacity for mitochondrial -oxidation, leading to accumulation of bioactive lipid-derived metabolites such as diacylglycerols and ceramides in the extramitochondrial space and activation of stress/serine kinases that interfere with insulin action. More recent studies have shown that fatty acid oxidation is actually increased in muscle in response to high-fat feeding but with no coordinate increase in TCA cycle activity. This results in accumulation of incompletely oxidized lipids in the mitochondria and depletion of TCA cycle intermediates, possibly resulting in mitochondrial stress and interference with insulin actions. The metabolic changes that underpin this new mechanism were identified by targeted GC-MS of organic acids and MS-MS analysis of acylcarnitines in muscle extracts from lean and obese animals, as summarized in B (data reprinted from ref. 51 with permission). Note that these mechanisms are not mutually exclusive and could work in concert to impair muscle insulin action. CPT1, carnitine palmitoyltransferase 1; ETS, electron transport system; NEFA, nonesterified fatty acid; TCAI, TCA cycle intermediates.
sion of this pool to ␣-KG via ICDc. These examples illustrate two important applications of MS-based metabolic profiling in cellular research: 1) use in validation of the expected metabolic impact of a specific genetic engineering or pharmacologic manipulation of cellular systems and 2) integration with flux analysis to provide a complete picture of changes in metabolic pathways under varying experimental conditions. Overall, these studies show that metabolic byproducts of pyruvate/isocitrate cycling may be an important amplifying signal for control of GSIS. Possible mediators now under investigation include NADPH (35,42), ␣-KG or its metabolites (43,44), or GTP generated by the succinyl CoA dehydrogenase reaction (45), all of which are direct or downstream products of the ICDc reaction. Targeted MS-based metabolic profiling applied to mechanisms of insulin resistance. Lipid infusion or the ingestion of a high-fat diet results in insulin resistance and eventual development of diabetes. A prevailing model for development of diet-induced insulin resistance holds that mitochondrial fatty acid oxidation is inadequate to deal with the large load of dietary fat, thus leading to accumulation of lipid-derived metabolites such as diacylglycerols (DAGs) and ceramides that can activate stress kinases to 2434
DIABETES, VOL. 58, NOVEMBER 2009
interfere with insulin action (46,47) (Fig. 4A). The evidence in support of such a mechanism in induction of hepatic insulin resistance is considerable and may translate to humans. For example, a short period of caloric restriction in obese humans improves hepatic insulin sensitivity in concert with a reduction in liver fat (48). A possible link between fatty liver and metabolic changes in peripheral tissues has been uncovered by liquid chromatography-MS analysis of lipids in nondiabetic women with and without increased liver fat; women with increased liver fat had elevated levels of esterifed long-chain fatty acids and ceramides in adipose tissue (49). Also supporting an important role of hepatic steatosis in development of insulin-resistant states, whole-animal, muscle, and liver insulin resistance in rats fed a high-fat diet are all ameliorated in response to hepatic overexpression of malonyl CoA decarboxylase (MCD), a gene that reduces hepatic steatosis by partitioning lipids toward -oxidation (18). Interestingly, the improvement in muscle insulin resistance was not correlated with changes in muscle triglyceride or fatty acyl CoA levels. Instead, metabolic profiling of 37 acylcarnitine species by MS-MS revealed a decrease in the concentration of lipid-derived metabolite -OH-butyrylcarnitine (HB) in muscle of diabetes.diabetesjournals.org
J.R. BAIN AND ASSOCIATES
B
400
300 100
75
50
120 110 100
ZDF
90 80 70 60
C18:1-OH C18-OH
0
Percent of Lean Controls C4-OH C6 C5-OH C4-DC lactate C8:1 C8 pyruvate C5-DC C6-DC C10:3 succinate C10:2 C10:1 fumarate C10 C8-DC malate C12 C14:2 C14:1 α-kg C14 C16 citrate C16-OH C18:2 C18:1 C18
25
C3 C4 C5:1 C5
Acylcarnitines (nmol/g protein)
Lean ZDF
‡
‡
50
‡
FIG. 4. Continued.
MCD-overexpressing animals that was likely due to a change in intramuscular ketone metabolism. The association of improved insulin action with a decline in a mitochondrial lipid-derived metabolite (HB) encouraged further investigation of the mechanism of lipid-induced muscle insulin resistance with targeted MSbased metabolic profiling tools (2,50,51). These studies found that chronic exposure of muscle to elevated lipids in vitro, or in vivo as a consequence of overnutrition, resulted in an increase rather than a decrease in expression of genes of fatty acid -oxidation (50,51). Importantly, this lipid-induced upregulation of the enzymatic machinery for -oxidation of fatty acids in muscle was not coordinated with upregulation of downstream metabolic pathways such as the TCA cycle and electron transport chain. This resulted in incomplete metabolism of fatty acids in the -oxidation pathway, as reflected by broad-scale accumulation of mitochondrial lipid metabolites (acylcarnitines) and a simultaneous decrease in the levels of TCA cycle intermediates, as revealed by quantitative MS-MS and GC-MS analysis (50,51) (Fig. 4B). That these abnormalities may contribute to mitochondrial stress and development of insulin resistance is supported by the finding that exercising of obese mice normalizes the elevated acylcarnitines in muscle and restores insulin sensitivity and glucose tolerance (50). Also diabetes.diabetesjournals.org
supporting the model, mice with global MCD knockout fed a high-fat diet have suppressed fatty acid oxidation and reduced acylcarnitine levels, coupled with improvement of glucose tolerance and insulin resistance (51). Similar improvements in insulin sensitivity and glucose uptake have been reported in human myocytes in response to siRNA-mediated suppression of MCD (52). Also consistent with these findings, transgenic mice with muscle-specific overexpression of peroxisome proliferator–activated receptor (PPAR)-␣, a nuclear receptor that activates -oxidative genes, developed both local and systemic glucose intolerance (53). In contrast, one recent study reported improved rather than impaired insulin sensitivity in response to overexpression of CPT1 (carnitine palmitoyltransferase 1) in muscle (54). Nevertheless, the weight of recent evidence is consistent with a model in which lipid-induced insulin resistance in muscle is explained at least in part by “overload” of mitochondrial lipid oxidation, accumulation of incompletely oxidized fats, and depletion of TCA intermediates, leading to a condition of mitochondrial stress that activates signaling pathways (still to be defined) that interfere with insulin action. These findings do not preclude an important role for accumulation of DAGs, ceramides, or other lipid-derived metabolites in muscle of animals with diet-induced obeDIABETES, VOL. 58, NOVEMBER 2009
2435
METABOLOMICS APPLIED TO DIABETES RESEARCH
sity, and the two mechanisms could in fact work together to cause harmful effects. Other metabolic profiling studies have led to the identification of a specific lipid metabolite that might serve to enhance insulin action (55). Thus, liquid and GC-based methods were used for quantitative profiling of ⬃400 lipid species in mice lacking expression of fatty acid binding proteins (FABPs) in adipose tissue (aP2-mal1⫺/⫺). FABPdeficient mice fed a high-fat diet fail to accumulate lipids in adipose tissue and remain insulin sensitive. Adipose tissue from these animals was enriched in C16:1n7-palmitoleate, both as the free fatty acid and in multiple esterified species. Infusion of triglycerides containing exclusively palmitoleate (C16:1) or palmitate (C16:0) into mice for 6 h resulted in suppression of the entire insulin-signaling pathway in the case of triglyceride-palmitate, versus a clear enhancement in insulin action in the case of triglyceride-palmitoleate. Although interesting, this experiment would have been more convincing if it had included an additional control of another monounsaturated fatty acid such as oleate (C18:1). Also, the role of palmitoleate in control of insulin action in physiological or pathophysiological states remains to be defined, given that palmitoleate levels rise in concert with levels of other fatty acids in obesity (17) and fasting, even though these are states of clear insulin resistance. Another study used LC-MS-MS to profile lipids secreted from the small intestine in response to ingestion of fat (56). This approach showed an increase in N-acylphosphatidylethanolamines (NAPEs) in the circulation. Systemic infusion of the most abundant NAPE decreased food intake in rats, an effect that could not be ascribed to taste aversion. The authors also demonstrated that systemically administered NAPE enters the brain and accumulates in the hypothalamus. Chronic administration of NAPEs reduces food intake and decreases body weight, suggesting a possible medicinal application in treatment of obesity. The studies summarized above are examples of use of targeted metabolic profiling technologies for development of new and testable models of disease pathogenesis and novel therapeutic strategies. We chose to highlight these examples because, in each case, the investigators were not satisfied with simple reporting of a metabolic signature of nutritional manipulation (information) and moved beyond this point to explore the significance of their findings in regulation of metabolic fuel homeostasis. Unfortunately, taking such extra steps to investigate mechanism has been the exception rather than the rule in application of metabolomics to diabetes research to this point, and this must change if the full potential of the technology is to be realized. Nuclear receptors, including the family of PPAR-␣, -␦, and -␥, have emerged as important mediators of insulin sensitivity. 1H-NMR–, LC-MS–, and GC-MS– based methods were used to compare PPAR-␣ null and wild-type mice. The authors reported decreases in glucose, glutamine, and alanine levels and an increase in lactate, suggesting an increase in utilization of glucose and amino acids, as might be predicted from the known effects of PPAR-␣ to promote the opposing pathways of -oxidation, ketogenesis, and gluconeogenesis (57). More recently, targeted GC-MS and LC-MS-MS analysis has provided deeper insights by showing that PPAR-␣ knockout results in fasting hypoglycemia accompanied by depletion of TCA cycle intermediates and free carnitine and short-chain acylcarnitines, as well as accumulation of long-chain acyl CoAs in skeletal muscle 2436
DIABETES, VOL. 58, NOVEMBER 2009
(58). Several of these metabolic abnormalities could be partially ameliorated by carnitine supplementation. Another study surveyed changes in lipid metabolites in obese and diabetic mice in response to treatment with rosiglitazone. These experiments revealed that rosiglitazone induced circulating hypolipidemia, caused substantial alterations in multiple lipid species in the heart, and caused accumulation of polyunsaturated lipid species in adipose tissue (23). These findings are of particular interest given the propensity of thiazolidinedione drugs to cause weight gain and accumulation of adipose tissue and the recent report of a link between these drugs and increased risk of cardiovascular disease (59), although the exact relationship between the changes in lipid metabolism and these drug side effects, if any, remain to be defined. Finally, a very recent study has investigated the effects of rosiglitazone in normal and diabetic mice with targeted quantitative measurement of a remarkable 800 metabolites by tandem MS. The authors report that methylglutarylcarnitine levels are oppositely affected in healthy and diabetic mice by rosiglitazone and that an enrichment in phosphatidylcholine relative to lysophosphatidylcholine levels occurs in diabetic versus normal animals (60). However, no mechanistic follow-up studies were attempted, and the functional significance of either of these changes therefore remains to be elucidated. Integration of metabolomics with other “omics” technologies for studies of metabolic disease mechanisms. Recent studies in plants (61), animal models of disease (20), and human families with early-onset cardiovascular disease (62) have demonstrated that metabolite profiles are heritable and can be integrated with wholegenome association and microarray profiling datasets to define gene/metabolite networks. In one such study, diabetes-resistant C57BL/6-ob/ob mice were bred with diabetes-susceptible BTBR-ob/ob mice to create an F2 cohort in which blood glucose and insulin levels were distributed across a wide range. Liver samples from F2 mice were subjected to targeted metabolomics and microarray analyses, and integration of these datasets with whole-genome single nucleotide polymorphism (SNP) analysis showed clusters of liver metabolites (e.g., a group of amino acids) mapped to distinct chromosomal regions, suggesting the presence of genes at those loci that exert metabolic control on a whole class of metabolites (20) (Fig. 5). Using refined statistical techniques (63), correlations between genetic loci, transcripts, and metabolites were used to develop a model that predicts that the amino acid glutamine acts through alanine:glyoxylate aminotransferase (Agxt) and arginase 1 (Arg1) to affect phosphoenolpyruvate carboxykinase (Pck1) expression (Fig. 6). Consistent with this predicted network, glutamine addition to primary hepatocytes causes strong upregulation of Agxt, Arg1, and PEPCK (20). Moreover, glutamine and PEPCK mRNA levels are reduced with obesity in diabetes-resistant B6ob/ob mice but increased in liver of diabetes-susceptible BTBR-ob/ob animals (C. Ferrara, C.B.N., A.D. Attie, unpublished observations). In another study with some similarities in design, F2 rats from a cross of diabetic Goto-Kakizaki (GK) and normoglycemic Brown Norway (BN) rats were surveyed by nontargeted NMR-based metabolic profiling, and this information was integrated with information about physiologic quantitative trait loci (QTL) in the same cross (64). As with the MS-based study described above, the authors were able to map spectral features to specific chromodiabetes.diabetesjournals.org
J.R. BAIN AND ASSOCIATES
FIG. 5. Metabolite levels are heritable and can be mapped to specific chromosomes in mice. In this particular study, diabetes-resistant B6-ob/ob mice were bred with diabetes-susceptible BTBR-ob/ob mice to create a cohort of F2 mice in which individual mice had a wide variation in blood glucose levels. Whole-genome SNP analysis was integrated with microarray and targeted GC-MS– and MS-MS– based analysis of metabolites of liver extracts from the F2 animals. This analysis revealed that metabolites can be mapped to specific chromosomes. Each row represents a SNP marker, and each column represents a metabolite. The LOD color scale is indicated, showing blue when the B6 allele at that marker results in an elevated level of the metabolite and red/yellow when the BTBR allele is dominant. Note the clusters of amino acids that map in common to regions on chromosomes 8 and 9, suggesting the presence of a gene that controls their levels. Figure reproduced with permission from ref. 20. LOD, logarithm of odds.
somal regions. Candidate metabolites for some of the most significant QTLs were identified, including glucose and benzoate. Subsequent transcriptomic analysis of the parent strains revealed the absence of transcripts for uridine diphosphate (UDP)-glucuronosyl-transerase-2b (Ugt2b), an enzyme that metabolizes benzoate and other xenobiotics in mammals. The absence of Ugt2b expression was subsequently found to be the result of a chromosomal deletion in the GK strain, demonstrating the ability of metabolomics to uncover otherwise undetected chromosomal abnormalities. Targeted metabolomics has also recently been integrated with genotyping for understanding the biochemical impact of common genetic polymorphisms (65). These authors performed ESI-MS-MS to measure 363 metabolites in serum of 284 male participants in the KORA study (a general population study from Germany). Significant associations were observed between frequent SNPs and changes in specific metabolites. Moreover, polymorphisms in four specific genes (FADS1, LIPC, SCAD, MCAD) encoding metabolic enzymes were linked to perturbations in the metabolic pathways in which the enzymes are known to reside. The authors suggest that the combination of genotyping and metabolic phenotyping may provide new roadmaps for application of personalized medicine. These studies represent very early efforts to integrate metabolomics with other forms of “omics” sciences but diabetes.diabetesjournals.org
nevertheless serve to illustrate the potential power of integrated approaches for identification of novel metabolic regulatory networks that contribute to chronic disease such as type 2 diabetes. As targeted metabolic profiling methods evolve to encompass a larger set of metabolites, computational methods for integrating this information with other broad-scale profiling datasets must continue to evolve. Targeted MS-based metabolic profiling for understanding of human metabolic disease pathogenesis Human diabetes and insulin resistance. Targeted MS-based metabolic profiling has been increasingly applied to studies of human diseases and conditions (17,19,62,66 –73). For example, profiling of obese (median BMI 37 kg/m2) versus lean (median BMI 23 kg/m2) humans revealed a branched-chain amino acid (BCAA)-related metabolite signature that differentiates the two groups, is suggestive of increased catabolism of BCAA, and correlates with insulin resistance (17) (Fig. 7). The signature includes several metabolites that are byproducts of BCAA catabolism, such as glutamate, ␣-ketoglutarate, C3 acylcarnitine (propionylcarnitine), and C5 acylcarnitines (␣methylbutyryl and isovalerylcarnitines). A subsequent cross-sectional study in sedentary hyperlipidemic subjects of varying BMI (range 25–35 kg/m2) identified several metabolite clusters (principal components) that explained most of the data variance and found that the principal DIABETES, VOL. 58, NOVEMBER 2009
2437
METABOLOMICS APPLIED TO DIABETES RESEARCH
D8Mit45 D2Mit106 D13Mit91 (86.6) (132.4) (46.2)
D18Mit177 D2Mit395 (41.2) (122.3)
D5Mit240 D8Mit249 D15Mit252 D2Mit263 (108.2) (80.2) (22.6) (161.8)
D4Mit190 (149.2)
Ass1
D13Mit76 D2Mit51 Slc1a2 (106.8) (162.2)
D7Mit294 D14Mit126 (22.7) (20.2)
Agxt Node1 Glx Slc1a2 Glx Ivd Agxt Ivd Slc1a2 Arg1
Node 2 Agxt Glx Slc1a2 Agxt Arg1 Slc1a2 Ivd Pck1
LOD Score 1.67 0.72 0.35 0.55 3.87 2.52 0.10 3.86
D9Mit20 (110.6)
p-value 0.05 0.25 0.41 0.30