Chromium and iron are two heavy elements in the solar wind with similar masses. The MTOF ( ... the abundance ratio measured for the shorter periods was not unusual or .... 6 0. 6 2. 5 8. FIGURE 2. A portion of a TOF spectrum from MTOF. The.
The Relative Abundance of Chromium and Iron in the Solar Wind J.A. Paquette∗ , F.M. Ipavich∗ , S.E. Lasley∗ , P. Bochsler† and P. Wurz† ∗
Department of Physics, University of Maryland, College Park, MD, USA 20742 † Physikalisches Institut der Universität Bern, Switzerland, CH3012
Abstract. Chromium and iron are two heavy elements in the solar wind with similar masses. The MTOF (Mass Time Of Flight) sensor of the CELIAS investigation on the SOHO spacecraft easily allows these two elements to be resolved from one another. Taking the ratio of the densities of these two elements - as opposed to considering their absolute abundances - minimizes the effects of uncertainties in instrument efficiency. Measurements of the abundance ratio are presented here. The First Ionization Potential (FIP) of chromium is 6.76 eV, while the FIP of iron is 7.87 eV. Since Cr and Fe have similar FIPs the ratio of their abundances should not be biased by the FIP effect which is well known in different solar wind flows. Therefore the Cr/Fe ratio from the MTOF data should give a good measure of the photospheric abundance ratio. We also compare the ratio measured in this work to the meteoritic value.
INTRODUCTION
INSTRUMENTATION
Chromium and iron are two heavy elements in the solar wind with similar properties. In this paper we present a preliminary study of the chromium to iron abundance ratio in the solar wind using data from the MTOF (Mass Time of Flight) sensor on SOHO. This is the first measurement of chromium in the solar wind. The abundance ratio for three short time periods (corresponding to three different solar wind flow types) and three long (≈ 1 year duration) time periods are derived from the data. The abundance ratio of these two elements can be measured with sufficient precision using MTOF to allow comparison to photospheric and meteoritic values. The three short periods were chosen for their relatively stable bulk speeds, which makes measurment simpler, as the instrument efficiency is a function of speed. No variation with solar wind flow type in the chromium to iron abundance ratio was expected a priori, but the choice of three different flow types allowed the possibility to be investigated. The three longer time periods were not explicitly differentiated by flow type. They consisted of all data during approximately year-long periods in which the bulk speed was in a narrow range. The study of these longer periods was intended to test the supposition that the abundance ratio measured for the shorter periods was not unusual or atypical.
The MTOF sensor, which is a part of the CELIAS (Charge Element and Isotope Analysis System) Investigation on SOHO, is shown in Figure 1. It consists of an energy per charge filter (the WAVE) and a high massresolution (M/∆M > 100) spectrometer (the VMass). A solar wind ion with the requisite E/q to negotiate the WAVE encounters the carbon foil. After passing through the foil, a large fraction (the exact value is a function of both energy and species, but typically from 70% to more than 99%) of ions will either have been neutralized, or left with charge state +1. Neutrals will travel in a straight line to the neutral microchannel plate (MCP) detector. Positive ions will be bent towards the ion MCP by the electric field inside the VMass. In the harmonic electric potential inside the VMass, the time of flight (TOF) of the ions is proportional to the square root of M/q∗ where q∗ is the charge state after the foil. So√in the case in which q∗ = 1, the TOF is proportional to M. MTOF and CELIAS are discussed in greater detail in [1]. In addition, the PM (Proton Monitor) - which is a subsensor of MTOF - provides solar wind parameters on a near real time basis. It was used to aid in the analysis of the MTOF data. The proton monitor consists of a three-box electrostatic deflection system followed by a position sensing Microchannel Plate. The proton monitor is described in detail in [2]. Instrumental fractionation in MTOF can result from several sources. Ions whose E/q values are close the up-
WAVE E/Q selection
SOLAR WIND ION E, Q, M
UV Trap
Carbon Foil
n Io
CP M
e
ns Io
TOF α M/Q *
a St
rt
M
CP
Neutrals
MTOF
Neutral MCP
F.I. / UMD
TOF α E*/M
FIGURE 1. Schematic of the MTOF (Mass Time of Flight) Instrument. Solar wind ions enter through an energy/charge filter (the WAVE) and pass through a carbon foil, leaving them with a charge state q∗ . They then enter a harmonic potential region in which those with q∗ > 0 are electrostatically deflected down to a microchannel plate detector. p For an ion of mass M, the time of flight in this region is ∝ M/q∗ .
per or lower limits of the WAVE’s passband are less efficiently transmitted than other ions, but this effect is wellunderstood and can be corrected for. Another fractionation effect is introduced by the carbon foil. The portion of ions which exit the foil with charge state +1 is a function of both energy and of species. The charge state distribution after exiting a carbon foil has been measured for many species [3], [4], [5]. While the distribution of charge states after a carbon foil has been measured for iron, it has not been done for chromium, and this is therefore a source of uncertainty. Finally, the efficiency of ion transmission through the VMass region is a function of energy, since sufficiently energetic ions cannot be turned back by the electric field and will strike the hyperbola. Ions of different species in the solar wind (all having roughly the same speed) will of course have different energies and hence will be fractionated in the VMass. Calibration of MTOF has provided a good understanding of the details of VMass transmission, although some uncertainty remains.
CHROMIUM AND IRON Chromium and iron are close to each other in mass (the most common isotopes being 52 and 56, respectively).
It may be surmised that these two metals have similar charge state distributions in the solar wind. Hence Cr ions and Fe ions are likely to have similar E/q distributions at any given time, and so fractionation by the WAVE will not be important. The small difference in the masses of the two elements likewise implies similar values for VMass transmission. While the charge state distributions after encountering a carbon foil were measured for iron, they have not been measured for chromium. This is a source of uncertainty, but it is unlikely that their charge states after the carbon foil will be very different from each other. Therefore, it is likely that instrument fractionation will be a small effect. It is also likely that any uncertainty in the ratio of the instrument efficiencies for the two elements will be less than the uncertainty in either element’s absolute efficiency. Another consideration in selecting chromium and iron for study is that the two elements have have similar First Ionization Potentials (FIPs). Chromium’s FIP is 6.76 eV, while the FIP of iron is 7.87 eV. Since both elements have low FIP, the well-known FIP effect ( see, for example, [6]) will not introduce any fractionation, and the abundance ratio measured in the solar wind should be directly comparable to the photospheric abundance ratio. Because both metals have low volatility, the ratio in the solar wind should also be directly comparable to the meteoritic ratio.
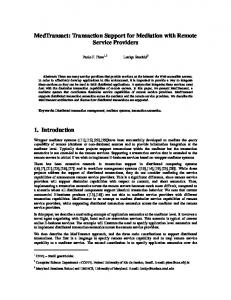
ANALYSIS TECHNIQUE The TOF spectra from MTOF are fit using a maximum likelihood algorithm. The model function has 24 parameters, but fourteen of these are the heights of the peaks of the various species with masses between 48 and 64. Of the remaining 10, two describe a linear background, two are needed to convert from time of flight channel to mass, two are associated with small subsidiary peaks caused by electronic "ringing" in the instrument, and the the remaining 4 describe the shape and width of the peaks. The peak shape (which is identical for all 14 peaks) is a modified asymmetric Lorenztian. Although this work is only concerned with masses in the range 52 to 57, a wide range of time of flight channels was chosen to allow an adequate fit of the background and other parameters not related to the heights of the mass peaks. Figure 2 shows the MTOF data for the relevant range, together with the model function for the same interval. The various peaks are labeled with the corresponding masses. The chromium peak is at mass 52, and the iron creates peaks at 54, and 56, with a shoulder at 57. The peak at 48 is titanium, and the peaks at 58, 60, and 62 are primarily nickel. Two of the parameters provided by the fitting program
MTOF Time of Flight Spectrum April 1996 to April 1997 380 km/s < V < 400 km/s SW
56 10000
54 58
Counts
1000
60
52
62 100 48
Observed Counts Simulated Counts 10 3300
3400
3500
3600
3700
3800
3900
Time of Flight Channel
FIGURE 2. A portion of a TOF spectrum from MTOF. The points connected by a thin line are the observed counts as a function of TOF channel, and the thick line is the model fit to the data. The various peaks are labeled with the masses to which they correspond. The peak at mass 48 is titanium, the 52 peak is chromium, the 54 and 56 peaks are iron, and the 58, 60, and 62 peaks are primarily nickel.
correspond to the peak heights of the Cr52 and the Fe56 peaks. The ratio of the peak values for the 52 peak to the 56 peak provided by the fitting program is corrected to account for the small (typically a few percent) fractionation effect in the instrument, and for the isotopic fractions of each species to give the elemental abundance ratio.
FIGURE 3. An interstream time period. The solar wind parameters plotted here are from the CELIAS/MTOF/PM (Proton Monitor) subsensor on SOHO. The top panel is the bulk speed of the solar wind, the p second panel is the density, the third is the thermal speed ( 2kT /m), and the bottom panel is the outof-ecliptic flow angle. The shaded region is the fraction of the time period shown for which the MTOF data was used to derive the chromium to iron abundance ratio.
and thermal speed. An examination of the soft X-ray data from the Yohkoh spacecraft for the few days preceding this time shows a coronal hole extending to relatively low latitude that could have been the source of this flow [8]. In addition, the coronal hole maps produced by the NSO (National Solar Observatory) at Kitt Peak also show an equatorward extension of the south polar coronal hole during that time. Again, the shaded region was the time period that was analyzed.
THE CR TO FE RATIO IN DIFFERENT FLOW TYPES Three time periods were selected, each corresponding to a different solar wind flow type. For ease of analysis, time periods without large variations in bulk speed were chosen. An interstream time period is shown in Figure 3. The shaded region on the plot is the time period selected for analysis. This period has a nearly constant velocity. A coronal hole time period is shown in Figure 4. The speed of around 450-500 km/s is low for a coronal hole associated wind, but coronal hole flows with speeds in this range have previously been observed (see, e.g. [7]). The time period has the morphology of a coronal hole, with an initial density increase, followed by a subsequent decrease and a simultaneous increase in both bulk speed
FIGURE 4. PM solar wind parameters for a time period with coronal hole associated flow.
A probable CME associated time period is shown in Figure 5. LASCO saw a halo CME on May 12 1997 at about 04:35 UT [9], and the shock driven by the CME arrived at SOHO slightly before 01:00 UT on May
15. The nearly 3-day period beginning just after the shock (shaded in gray) was the time period selected for analysis. While this time period bears some resemblance to fast solar wind, the NSO coronal hole maps show no likely coronal hole within 50◦ of the equator, and magnetometer data from the ACE MFI instrument shows the signature of a magnetic cloud at this time, so the identification of this time period as a CME associated one is reasonable.
0.30 × 10⁻² was found. For the coronal hole time period, the abundance ratio was measured to be 1.74 × 10⁻² ± 0.31 × 10⁻², and for the CME-associated time period, a value of 1.59 × 10⁻² ± 0.29 × 10⁻² was found. The errors estimates are based on uncertainty in instrument response, primarily due to uncertainty in the +1 yields for chromium after the carbon foil. The results for the comparison of the three events of different flow types are shown in Figure 6. As can be seen, the values are all consistent, within errors, with each other and with both meteoritic and photospheric values. The result of the average of the three 1-year periods was 1.73 × 10⁻² ± 0.30 × 10⁻². The error estimate here includes counting statistics, but was still dominated by uncertainty in instrument efficiency. This is also shown in Figure 6. The results from the three time periods and the average of the one year periods are all shown in Table 1, along with values from [10] for comparison. Chromium to Iron Ratio
FIGURE 5. PM solar wind parameters for a time period with CME associated solar wind. LASCO saw a halo CME about 66 hours prior to the arrival of the shock near the beginning of May 12.
ONE YEAR PERIODS For a one year period beginning in April 1996, all data with the bulk speed (as determined by the PM) in a narrow speed range (380-400 km/s) was summed over. This method gives very good statistics, and the efficiency (which is a function of speed) varies very little over the small speed range. The TOF spectrum resulting from this was analyzed as described above. This method does not distinguish between data from different flow types, however. This process was repeated for the time period from April 1997 to April 1998, and for the period from April 1998 to September 1999. Because of the temporary loss of SOHO in the summer of 1998, and the loss of data during December 1998 to early February 1999, the last time period was actually of similar length to the other two.
RESULTS For the the interstream time period, a value of the chromium to iron abundance ratio of 1.65 × 10⁻² ±
Chromium to Iron Abundance Ratio
0.025
0.020
Meteoritic 0.015
Photospheric
0.010 Interstream
Coronal Hole
CME Associated
Average of 1-Year Periods
Flow Type
FIGURE 6. Comparison of the chromium to iron abundance ratio in different solar wind flow types and for the average of three one-year periods to the photospheric and meteoritic values. In this figure, the lighter shaded region represents the 1-σ range of the meteoritic abundance ratio reported by [10]. The darker shaded region is the analogous photospheric abundance ratio also from [10]. Note that the wider error range of the photospheric value completely encompasses the meteoritic value with its error range. The points shown on the plot are for the average of three periods of aproximately year-long periods and for three much briefer events; one an interstream flow, another a coronal hole flow, and the last a CME-associated flow.
TABLE 1.
Chromium to Iron Abundance Ratio Cr/Fe Abundance Ratio
Photospheric (Grevesse and Sauval, 1998) Meteoritic (Grevesse and Sauval, 1998) This Work (Interstream) This Work (Coronal Hole) This Work (CME associated) This Work (1 year beginning Apr 1996) This Work (1 year beginning Apr 1997) This Work (1 year beginning Apr 1998) This Work (Average of three 1-year periods)
CONCLUSIONS As can be seen from Table 1, all of the abundance ratios are consistent (within errors) with the photospheric and meteoritic values. It is also true that all of the values are slightly higher than both the meteoritic and the photospheric values, but without increased accuracy in the measurement of the ratio, little can be concluded from this. It is possible that a small systematic error was introduced in the assumed chromium +1 yields. Since both chromium and iron are low FIP elements, the agreement of the values from various flow types with each other is to be expected. The fact that they also agree with photospheric values is consistent with the "plateau" of constant fractionation that is often shown (e.g in [6]) for low FIP elements. Further study of this question might include consideration of more events of each flow type. Since most of the uncertainty in the measurement of the ratio is due to uncertainty in the chromium efficiency, precision could be improved either by measurements of the post-carbon-foil charge state distributions for chromium, or by calibration of the the MTOF spare instrument to better determine the overall chromium efficiency.
ACKNOWLEDGMENTS This research was supported by NASA grants NAG57678 and NAG5-9282. We would also like to thank the many individuals at the University of Maryland and at other CELIAS institutions who contributed to the success of MTOF. NSO/Kitt Peak data used here are produced cooperatively by NSF/NOAO, NASA/GSFC, and NOAA/SEL.
REFERENCES 1.
Hovestadt, D., Hilchenbach, M., Bürgi, A., Klecker, B., Laeverenz, P., Scholer, M., Grünwaldt, H., Axford,
1.48 × 10⁻² ± 0.19 × 10⁻² 1.55 × 10⁻² ± 0.051 × 10⁻² 1.65 × 10⁻² ± 0.30 × 10⁻² 1.74 × 10⁻² ± 0.31 × 10⁻² 1.59 × 10⁻² ± 0.29 × 10⁻² 1.77 × 10⁻² 1.75 × 10⁻² 1.67 × 10⁻² 1.73 × 10⁻² ± 0.30 × 10⁻²
W. I., Livi, S., Marsch, E., Wilken, B., Winterhoff, H. P., Ipavich, F. M., Bedini, P., Coplan, M. A., Galvin, A. B., Gloeckler, G., Bochsler, P., Balsiger, H., Fischer, J., Geiss, J., Kallenbach, R., Wurz, P., Reiche, K.-U., Gliem, F., Judge, D. L., Ogawa, H. S., Hsieh, K. C., Möbius, E., Lee, M. A., Managadze, G. G., Verigin, M. I., and Neugebauer, M., The SOHO Mission, Kluwer Academic Publishers, Dordrecht, 1995, pp. 441–481. 2. Ipavich, F. M., Galvin, A. B., Lasley, S. E., Paquette, J. A., Hefti, S., Reiche, K.-U., Coplan, M. A., Gloeckler, G., Bochsler, P., Hovestadt, D., Grünwaldt, H., Hilchenbach, M., Gliem, F., Axford, W. I., Balsiger, A., Bürgi, A., Geiss, J., Hsieh, K. C., Kallenbach, R., Klecker, B., Lee, M. A., Managadze, G. G., Marsch, E., Möbius, E., Neugebauer, M., Scholer, M., Verigin, M. I., Wilken, B., and Wurz, P., Journal of Geophysical Reasearch, 103, 17205–17213 (1998). 3. Oetliker, M., Charge state distribution, scattering, and residual energy of ions passing through thin carbon foils; Basic data for the MTOF mass spectrometer on the space mission SOHO, Master’s thesis, University of Bern, Switzerland CH3012 (1989). 4. Gonin, M., Interaction of low energy ions with thin carbon foils; charge exchange, energy loss, and angular scattering, Master’s thesis, University of Bern, Switzerland CH3012 (1991). 5. Gonin, M., Ein semiempirisches Modell des Ladungsaustauches non niederenergetischen Ionen beim Durchang durch dünne Folien, zur Eichung von isochronen Flugzeit-Massenspektrometern, Ph.D. thesis, University of Bern, Switzerland CH3012 (1995). 6. Geiss, J., Space Science reviews, 85, 241–252 (1998). 7. Bohlin, J. D., Coronal Holes and High Speed Streams, Colorado Associated University Press, Boulder, Colorado, 1977, pp. 27–69. 8. Solar geophysical data prompt reports, Tech. Rep. 623Part I, National Geophysical Data Center, Boulder CO 80303 (1996). 9. Plunkett, S. P., Thompson, B. J., Howard, R. A., Michels, D. J., Cyr, O. C. S., Tappin, S. J., Schwenn, R., and Lamy, P. L., Geophysical Research Letters, 25, 2477–2480 (1998). 10. Grevesse, N., and Sauval, A. J., Space Science Reviews, 85, 161–174 (1998).