MULTI-CLASS SUPPORT VECTOR MACHINES FOR TEXTURE CLASSIFICATION USING GRAY-LEVEL HISTOGRAM AND EDGE DETECTION FEATURES 1
MOHAMMED W. ASHOUR, 2FATIMAH KHALID, 3ALFIAN ABDUL HALIN, 4 SAMY H. DARWISH
1 Faculty of Information Technology, Majan University College, Muscat, Sultanate of Oman Faculty of Computer Science and Information Technology, University Putra Malaysia, Serdang, Selangor 4 Faculty of Engineering, Pharos University, Alexandria, Egypt E-mail:
[email protected]
2,3,
Abstract- Identification of the machining process producing a specific engineering surface is very important in manufacturing facilities. Computer vision has become center-stage in automatic identification of these processes, with benefits of man-power reduction as well as the drawbacks of human involvement such as inconsistencies caused by fatigue. In this paper, we propose a computer vision framework that takes into consideration workpiece images’ intensity histogram and edge features to identify the six machining processes of Grinding, Turning, Horizontal Milling, Vertical Milling, Shaping and Lapping. The support vector machine (SVM) classifier is explored with various kernels being investigated. The experimental results show that the SVM with the linear kernel using edge feature statistics provides the best performance for a dataset that consists of seventy-two workpiece images. Keywords- Machined Texture Classification, Support Vector Machines, Gray-Level Histogram, Edge Detection, PCA
histogram information are also useful texture features, where the work in [3] for example performed machined workpiece classification. Note that, all the extracted features are normally put through a supervised machine learning classifiers in order to perform the final analysis. Some of the popular classifier examples are such as the Artificial Neural Network (ANN) [3, 7, 10], Support Vector Machines (SVM) [3, 12, 17] and Decision Trees [11]. In this paper, we propose a framework for the classification of machined workpiece surfaces into the six classes of Turning, Grinding, Horizontal Milling, Vertical Milling, Lapping, and Shaping. The features being considered are the gray-level histogram and edge feature statistics, combined with the supervised SVM. We evaluate the approach via average classification accuracy, such as that done in [13]. Our data consists of 72 machined surface images; each image being from a machining process class. We perform also evaluate the performance of our proposed framework with that of our previous work that utilized an ANN classifier [14].
I. INTRODUCTION Automating the process of identifying specific machining process involved in the production of machined surfaces is very useful for production engineers. Image processing (IP) and computer vision (CV) are technologies that have recently been incorporated into the manufacturing process to facilitate quality inspection tasks such as metal injection inspection, defects identification as well as control process and tool condition monitoring [20]. A particular area in IP and CV is the analysis of texture, specifically that of machined surfaces. Extraction and subsequent analysis of the texture properties from workpiece images can be used to realize the automation of quality inspection. In [20], texture can basically be explained as repeated patterns with a set of local attributes that gradually differs. Texture variability is present in various structures, which defines their roughness, smoothness, orientation and regularity/irregularity [1]. Depending on the domain under consideration, IP/CV-based texture analysis can be used for various purposes such as image classification [2, 3], retrieval [4], and industrial inspection [5]. Provided with the appropriate illumination, image processing algorithms can be used to reliably extract texture features from images. In [19], several machining processes were categorized through edge features extraction and analysis. The Wavelet [6, 21, 22] and Fourier [7] transforms can also be used to express texture. In [21 and 22] for instance, wavelet features were obtained for the analysis of surface roughness. The GLCM (gray-level co-occurrence matrix) was used in [23] to identify wear of drilling components. Edge-features combined with image
II. SUPPORT VECTOR MACHINE Given{X , Y } = {(x , y ), (x , y ), … , (x , y )}, which are a set of labeled training data x and their respective class labels y (for i = 1, … , n), a supervised learning algorithm will discover a function f: X → Y that is able to effectively predict, with minimal error, future input-output mappings [16]. The Support Vector Machine (SVM) is one such algorithm, where it is a discriminative learning algorithm rooted in statistical learning theory [15, 24]. The pattern x is represented in a n-dimensional space with features f . The SVM then discovers a
Proceedings of 57th The IIER International Conference, Miami, USA, 18th January 2016, ISBN: 978-93-85973-10-9 1
Multi-Class Support Vector Machines For Texture Classification Using Gray-Level Histogram And Edge Detection Features
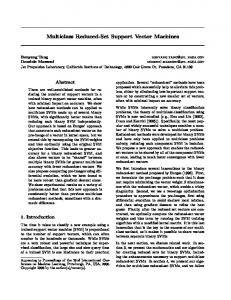
separating hyperplane in this space, separating the features into two distinct classes (ω and ω ). The iterative process (during training) to discover the hyperplane stops when the maximum margin is obtained to nearest training examples (i.e. support vectors). In the linear case, this can be illustrated in Fig. 1 [25].
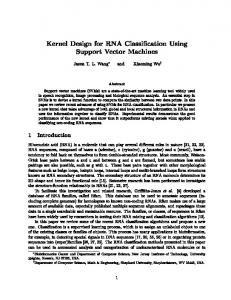
filter. The result of these convolutions are then combined into a single Sobel edge-intensity map S . A threshold is then empirically determined and applied to this map to produce a final edge map [18]. The result of applying the Sobel edge detector is shown in Fig. 3.
(a) (b) Fig. 1. (a) An illustration of the iterative process of finding the hyperplane, and (b) the separating hyperplane is discovered based on the support vectors. Referring to [17], the SVM’s mathematical representation can be written as:
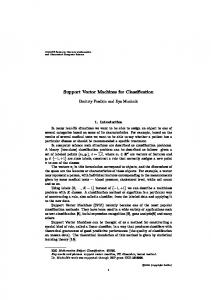
Fig. 2. (a) A grayscale image and (b) the resultant 256-bin histogram. The quantized gray level is represented on the axis with the intensity occurrence frequency on the -axis.
where w is a weight vector and b is a threshold. SVMs were initially used for binary classification problems. However, linearly non-separable multiclass tasks can also utilize SVMs through transforming the data into a higher-dimensional features space and applying the kernel trick.
Fig. 3. (a) The image , (b) detected edges of image using the Sobel edge detector.
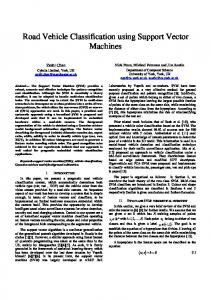
IV. DATASET AND IMAGE ACQUISITION The images considered in this work are produced by the six machining processes of Turning, Grinding, Horizontal Milling, Vertical Milling, Lapping, and Shaping (Fig. 4). Each process is considered to be separate classes. From each of the classes, 12samples are obtained. Note that although from the same class, each sample has different textural variations since different machining parameters are used [10]. In all, the dataset being used has 72-sample images (i.e. 6-classes x 12-samples per class). Digital image acquisition requires each workpiece image to be viewed under an powerful optical micros. In this work, the Olympus BX51M metallurgical microscope was used. A CCD camera then captures the image of each workpiece, where it is finally stored in the computer as a 1024 × 1280 resolution grayscale image. The acquisition process is illustrated explained in Fig. 5.
III. GRAY-LEVEL HISTOGRAM AND EDGE FEATURE STATISTICS EXTRACTION In this work, two features are investigated for the classification of machined workpiece images into the six classes of Turning, Grinding, Horizontal Milling, Vertical Milling, Lapping, and Shaping. They are the (i) gray-level histogram, and (ii) edge features statistics. The gray-level histogram of a 2-dimensional grayscale image represents the distribution of gray (intensity) values within that image, ranging from 0 to 255 (or 0 to 1, in case of normalization). A specific number of bins is used to indicate the occurrence frequency of a particular value. Fig. 2 is an example of a histogram that has 256-bins. Note that, the more bins being used might be able to represent an image better, however, at the cost of increased computational time. In this work, we use 256-bins as all necessary gray-level data can be reliably captured. Edges exist when rapid intensity changes occur in an image. These edges can hence be used to determine (and analyze) the texture of a particular surface. In this work, the Sobel edge detection algorithm is used due to its good performance. Basically, an image I is convolved with a vertical (h ) and horizontal (h )
Fig. 4. The six different machining processes. Proceedings of 57th The IIER International Conference, Miami, USA, 18th January 2016, ISBN: 978-93-85973-10-9 2
Multi-Class Support Vector Machines For Texture Classification Using Gray-Level Histogram And Edge Detection Features
having equal numbers of samples). Specifically, six random samples from each class were used for training.
Fig. 5. The image acquisition process. Fig. 6. The overall framework.
V. FEATURE EXTRACTION AND SELECTION
We used Platt’s Sequential Minimal Optimization (SMO) to train the SVM. For the multi-class classification task, the one-versus-one approach is chosen. As the SVM is originally meant for two-class classification tasks, and the classification task at hand is a multi-class problem, for k-classes, k (k − 1) / 2 binary SVMs are trained. During the testing phase, if the i-th decision function indicates that a sample is classified into the i-th class, then the vote for the i-th class increased by one. Otherwise, the i-th vote is decreased by one. Ultimately, the class label is determined by majority voting.
As previously mentioned, the features considered in this work are the intensity histogram and edge features statistics. Note that, all the captured images are contrast adjustment in order to facilitate feature extraction. Firstly, the 256-bin histogram is generated. This results in a 256-dimensional feature vector for each image, which can be represented by h , for i = 1, 2, 3, … , 12 (number of samples from each class), with n = 1, 2, 3, … , 6 (the number of classes/machining process). The Sobel edge detection algorithm is then applied on each image, producing a 1024 x 1280 edge matrix, where the mean and variance are calculated, columnwise. The mean vector for edge image i of class n (for similar values of i and n as per the histogram) can hence be represented as x, whereas the variance vector is represented as s . Both these vectors are then concatenated into one (i.e e ), resulting in a final vector with a dimension of 2,560 (1280 x 2). 5.1 Principal Component Analysis Principal component analysis (PCA) is technique used for dimensionality reduction. PCA is renowned for its ability to reduce high-dimensional data while retaining the inherent variability of the original data. PCA works by transforming the uncorrelated principal components into a new set of variables. These variables are then ordered so that a majority of the original data’s variation is maintained in the first few variables. For more detailed explanations of PCA, readers can be directed to the works in [7 and 10]. In this work, applying PCA resulted in significant data reduction with each vector brought down to a dimension of merely 30 (30 for intensity histogram, and 30 for the edge feature statistics).
6.1 Results and Discussion We investigated the use of three SVM kernels: (i) Linear, (ii) Polynomial and (iii) Radial Basis Function (RBF). From the results in Table 1, the linear kernel seemed to show the best classification accuracy when used with the PCA-reduced histogram features. A similar trend is seen in Table 2, where the linear kernel performed better than the others when coupled with the PCA-reduced edge statistics. Between the two features, the edge features seem to give superior performance, however not that significant (2.8% superior). The graph in in Fig. 7 is provided for a better view of the results. In our previous work [14], we attempted to solve the very same problem using an ANN classifier. Trained on the same features, we compared the performance of the SVM (all kernels) with this work. The ANN was trained and tested using the same dataset presented in this paper. The parameters for the ANN are shown in Table 3. From Fig. 8, it is clear that the SVM (linear kernel) outperforms the ANN for both features. The ANN moreover, reported lower accuracy results when compared to the SVM-polynomial kernel using PCAreduced histogram features. The difference between the SVM-polynomial kernel with PCA-reduced edge features with the ANN. The SVM with the RBF kernel reports the least accuracy compared to the other classifiers for both feature types.
VI. EXPERIMENTS Fig. 5 shows the flow of the overall framework. The samples are divided into two sets: set-1 for training the SVM classifier, and set-2 for testing (both sets
Proceedings of 57th The IIER International Conference, Miami, USA, 18th January 2016, ISBN: 978-93-85973-10-9 3
Multi-Class Support Vector Machines For Texture Classification Using Gray-Level Histogram And Edge Detection Features Table 1. SVM Classification Accuracy (%) using histogram features
Fig. 7. SVM linear, polynomial and RBF kernel accuracy results.
Table 2. SVM Classification Accuracy (%) using edge statistics features
Table 3. The Artificial Neural Network configuration from our previous work in [14] Fig. 8. Comparison between the SVM with the ANN implementation as in [14].
Two interesting observations were made from the experiments. Firstly, the SVM -linear kernel reported the highest accuracy results for both feature types. Secondly, the edge features used with SVM showed the best results for all kernels. We hence can conclude that, at this point in time, it appears that the SVM-linear kernel using edge statistics features is superior compared to the other configurations. Besides looking at accuracy, we subjectively compared overall time. All of the SVMs approximately took half the time for training compared to the ANN. This might an important factor to favor the SVM. However, due to the small number of data of 72-images, a concrete conclusion cannot be made. In all, even though overall accuracy favors the SVMliner kernel, we believe more experimentation needs to be done. Moreover, we also believe that more data should b collected in order to cater for unexpected variations that might exist between samples (even of the similar class). Proceedings of 57th The IIER International Conference, Miami, USA, 18th January 2016, ISBN: 978-93-85973-10-9 4
Multi-Class Support Vector Machines For Texture Classification Using Gray-Level Histogram And Edge Detection Features Retrieval with Hybrid Descriptors, International Review on Computers and Software, Vol. 4, no. 6, 2009, pp. 633-639. [10]. Mohammed W. Ashour, Fatimah Khalid, Lili N. Abdullah, Alfian A. Halin “Artificial Neural Network-Based Texture Classification Using Reduced Multidirectional Gabor Features”, International Review on Computers and Software (IRECOS), Vol. 9, Issue 6, 2014. [11]. M.A. Friedl, C.E. Brodley, Decision Tree Classification of Land Cover From Remotely Sensed Data, Journal of Remote Sensing of Environment, Vol. 61, no. 3, 1997, pp. 399–409. [12]. Elhariri Esraa, El-Bendary Nashwa, Fouad Mohamed Mostafa M., Platoš Jan, Aboul Ella Hassanie, Hussein Ahmed M. M, Multi-class SVM Based Classification Approach for Tomato Ripeness, Innovations in Bio-inspired Computing and Applications Advances in Intelligent Systems and Computing, Vol. 237, pp 175-186, 2014. [13]. A. Kassner, R.E. Thornhill, Texture Analysis: A Review of Neurologic MR Imaging Applications, The American Journal of Neuroradiology, Vol. 31, no. 5, pp. 809–816, 2010. [14]. Mohammed W. Ashour, Fatimah Khalid, Mohammed AlObaydee, Supervised ANN Classification for Engineering Machined Textures Based on Enhanced Features Extraction and Reduction Scheme, Journal of Artificial Intelligence & Computer Science, Vol. 1, pp. 71-80, 2013. [15]. V. Vapnik, The Nature of Statistical Learning Theory, ISBN 978-1-4757-3264-1 1995. [16]. Camastra, F. and Vinciarelli, A. “Machine Learning for Audio, Image and Video Analysis: Theory and Applications (Advanced Information and Knowledge Processing)”, 1st ed. 2008. [17]. Snoek C. G. M. and Worring. M, Time Inter, In Proc. of the 9th annual conference of the advanced school for computing and imaging (ASCI), Heijen, Netherlands, 2003. [18]. Desai, U.Y., Mizuki, M.M., Masaki, I., Horn, B.K.P.: Edge and mean based image compression. Technical Report 1584 (A.I. Memo), Artificial Intelligence Laboratory, Massachusetts Institute of Technology, Cambridge, MA, USA, Nov. 1996. [19]. Patwari M. A. U., Muammer D. A. Chowdhury M. S. I. and Chowdhury N. A., Identifications of Machined Surfaces using Digital Image Processing, International Journal of Engineering, Vol. 1, No. X, pp. 213-218, 2012. [20]. Dutta, S, Surjya K. P, and Ranjan S. "Digital Image Processing in Machining." Modern Mechanical Engineering. Springer Berlin Heidelberg, pp. 367-410, 2014. [21]. Zawada-Tomkiewicz A, Estimation of surface roughness parameter based on machined surface image. Metrol Meas Syst XVII, pp. 493–504, 2010. [22]. Niola V.N., and Quaremba G, A problem of emphasizing features of a surface roughness by means the Discrete Wavelet Transform. Journal of Materials Processing Technology, Vol. 164–165, pp. 1410–1415, 2005. [23]. Omid S., Jamal R., Mohammad A., and Seyed R. T., Use of digital image processing techniques for evaluating wear of cemented carbide bits in rotary drilling, Automation in Construction, Vol. 44, pp. 140-151, 2014. [24]. Abbasnejad, M. E., Halin, A. A., Manshor, N. and Rajeswari, M. Automatic Image Annotation using Mixtures of the Exponential Family, Journal of Convergence Information Technology, Vol. 6, No. 11, pp. 114-122, 2011. [25]. http://docs.opencv.org/doc/tutorials/ml/introduction_to_svm/i ntroduction_to_svm.html
CONCLUSION We have performed classification of (grayscale) machined workpiece images into the six classes of Turning, Grinding, Horizontal Milling, Vertical Milling, Lapping, and Shaping. The main objective was to investigate the accuracy of the Support Vector Machine classifier (with various kernels) based on two features, (i) graylevel histogram, and (ii) edge feature statistic. Due to the high dimensionality of the feature vector, Principal Component Analysis was used for feature reduction. The use of the SVM classifier is also justified compared to the Artificial Neural Network, as it required less time to train for our purpose. Based on a dataset of 72 captured images, the SVM-linear kernel using edge-features provided superior performance. REFERENCESS [1]. C H Chen, L F Pau, and P S P Wang, Texture Analysis, In [2]. [3].
[4].
[5].
[6]. [7].
[8].
[9].
Tuceryan and Jain (Ed.), Handbook of Pattern Recognition And Computer Vision, (World Scientific, 2nd edition, 1998). Robert m. Haralick, K. Shanmugam, and Its'hak Dinstein, Texture Feature For Image Classification, IEEE Transaction Systems, Vol. SMC-B, No. 6, 1973, pp. 610-621. Mohammed W. Ashour, M. F. Hussin and K. M. Mahar, Supervised Texture Classification Using Several Features Extraction Techniques Based on ANN and SVM, Proceedings of the IEEE/ACS International Conference on Computer Systems and Applications, (Page: 567-574 Year of Publication: 2008 ISBN: 978-1-4244-1968-5). S.Selvarajah, S.R. Kodituwakku, Analysis and Comparison of Texture Features for Content Based Image Retrieval, International Journal of Latest Trends in Computing, Vol. 2, no. 1, 2011, pp. 108-113. M. A. Younes, S. Darwish, M. El-Sayed, Online Quality Monitoring of Perforated Steel Strips Using An Automated Visual Inspection (AVI) System, Proceedings of IEEE International Conference on Quality and Reliability (ICQR), (Page: 575 - 579 Year of Publication: 2011 ISBN: 978-14577-0626-4). Unser M, Texture Classification and Segmentation Using Wavelet Frames, IEEE Transactions on Image Processing, Vol.4, no. 11, 2002, pp. 1549-1560. Harun Uğuz, A Biomedical System Based on Artificial Neural Network and Principal Component Analysis for Diagnosis of the Heart Valve Diseases, Journal of Medical Systems, Vol. 36, no. 1, 2012, pp. 61-72. A. Gebejes, R. Huertas, Texture Characterization Based on Grey-Level Co-occurrence Matrix, Proceedings of ICTIC for Conference of Informatics And Management Sciences, (Page: 375-378 Year of Publication: 2013 ISBN: 978-80-5540648-0). K. Houari, Y.Chahir, M. Kholladi, Spectral Clustering and Dimensionality Reduction Applied to Content Based Image
Proceedings of 57th The IIER International Conference, Miami, USA, 18th January 2016, ISBN: 978-93-85973-10-9 5