in an efficient manner; the messages are delivered over each link of the network .... as community networking, intra- and inter-building enterprise networking ..... networks.com/. [9] GloMoSim Simulator, http://pcl.cs.ucla.edu/projects/glomosim/.
1
Multicast Routing in Wireless Mesh Networks: Minimum Cost Trees or Shortest Path Trees? Uyen Trang Nguyen, Jin Xu Department of Computer Science and Engineering York University, Toronto, Ontario M3J 1P3, Canada Email: {utn, jinxu}@cs.yorku.ca
Abstract— There exist two fundamental approaches to multicast routing: shortest path trees (SPTs) and minimum cost trees (MCTs). The SPT algorithms minimize the distance (or cost) from the sender to each receiver, while the MCT algorithms minimize the overall cost of the multicast tree. Due to the very large scale and unknown topology of the Internet, computing MCTs for multicast routing in the Internet is a very complex problem. As a result, the SPT approach is the more commonly used method for multicast routing in the Internet, because they are easy to implement and give minimum delay from the sender to each receiver, a property favored by many real-life applications. Unlike the Internet, a wireless mesh network (WMN) has a much smaller size, and its topology can be made known to all nodes in the network. This makes the MCT approach an equally viable candidate for multicast routing in WMNs. However it is not clear how the two types of trees compare when used in WMNs. In this article we present a simulation-based performance comparison of SPTs and MCTs in WMNs using the performance metrics such as packet delivery ratio, end-to-end delay, and traffic impacts on unicast flows in the same network.
I. I NTRODUCTION Wireless Mesh Networks (WMNs) form a new class of networks that has emerged recently [1]. Major components of a WMN include wireless mesh routers, wireless mesh hosts (e.g., PCs, laptops, PDAs, and cell phones), and access points (or gateways) that act both as Internet routers and wireless mesh routers. The mesh routers in a WMN provides multi-hop connectivity from one mesh host to another, or to the Internet via the access points. A WMN is dynamically self-organized and self-configured, with nodes in the network automatically establishing and maintaining mesh connectivity among themselves. This feature brings many benefits to WMNs such as low installation cost, large-scale deployment, reliability, and self-management. Multicast [2] is a form of communication that delivers information from a source to a set of destinations simultaneously in an efficient manner; the messages are delivered over each link of the network only once and only duplicated at branch points, where the links to the destinations split. Important applications of multicast include distribution of financial data, billing records, software, and newspapers; audio/video conferencing; distance education; and distributed interactive games. Although multicast is required to support many important applications, research on multicasting in WMNs is still in its infancy. In this article we address one of the most essential issues of multicast in WMNs − routing.
There are two fundamental multicast routing approaches: shortest path trees (SPTs) and minimum cost trees (MCTs). The goal of SPT algorithms is to construct a tree rooted at the sender and spanning all the receivers such that the distance between the sender and each receiver along the tree is minimum. As a result, the SPT algorithms normally minimize the end-to-end delay as well. The two most commonly used algorithms for computing SPTs are due to Bellman-Ford and Dijkstra [3]. To compute a SPT, we apply the point-to-point shortest path algorithm repeatedly, once for each senderreceiver pair. SPTs by definition are per sender. Therefore for many-to-many multicast, separate trees need to be computed, one for each sender. Unlike the SPT algorithms, which aim at minimizing the distance (or cost) from the sender to each receiver, the goal of MCT algorithms is to minimize the overall cost of the multicast tree. MCT algorithms for multicast routing are based on the minimum Steiner tree problem, which is NP-complete. (NP-complete problems [4] are a class of problems for which the best known algorithms are essentially brute-force solutions that take exponential time in the worst case, and it is widely believed that it is impossible to solve them efficiently.) Thus several heuristics have been proposed to compute approximate Steiner trees [2], e.g., the 2-approximation heuristic proposed by Kou et al. [5], and the 11/6-approximation algorithm by Zelikovsky [6]. The total cost of a Steiner tree is less than the total cost of a corresponding SPT, by definition of Steiner trees. However the maximum distance between the sender and any receiver in a Steiner tree is typically longer than that in a SPT. This means that the average path length in a Steiner tree is more than that in a SPT. Due to the complexity of computing Steiner trees in a distributed manner, the majority of the multicast routing protocols used in the Internet today are based on SPTs, such as DVMRP and MOSPF [2]. The reason is that SPTs are easy to implement and offer minimum end-to-end delay, a desirable quality of service parameter for most real-life multicast applications. Recently, Ruiz and Gomez-Skarmeta explored the problem of multicast routing in wireless multi-hop networks in which nodes are static, e.g., WMNs [7]. The authors re-define the cost of a MCT by reasoning that in a broadcast medium, the transmission of a multicast data packet from a given node to any number of its neighbors can be done with a single data transmission. Thus, in a wireless multi-hop network the
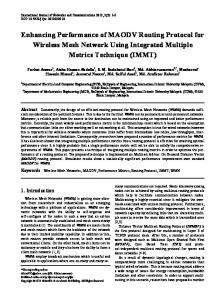
(a) Shortest path tree
(b) Minimum Steiner tree
(c) Minimum number of trx tree
S: sender − R: receiver − Double-lined circles denote multicast forwarding nodes. Type of tree Shortest path tree Minimum Steiner tree Minimum number of trx tree
Avg path length 2.25 2.75 2.50 Fig. 1.
Tree cost 6 5 6
Number of forwarding nodes 3 3 2
Number of trx per packet 4 4 3
Different routing trees over the same network (adapted from [7])
minimum cost tree is one which connects sources and receivers by issuing a minimum number of transmissions, rather than having a minimal edge cost as defined for traditional Minimum Steiner Trees (MSTs). In other words, the tree contains a minimum number of multicast forwarding nodes. The authors show that a Steiner tree typically needs a higher number of transmissions than their proposed Minimum Number of transmissions Trees (MNTs). Figure 1 shows an example of a multicast group having four receivers and the three different routing trees constructed using the shortest path tree, the minimum Steiner tree, and the minimum number of transmissions tree algorithms. The example illustrates the typical characteristic of each kind of tree. Assuming that the cost of every edge is one unit, the SPT provides the shortest average path length (2.25 hops); the MST has the lowest cost (5 units); the MNT contains the least number of forwarding nodes (2 nodes), and requires the least number of transmissions per packet (3 transmissions/packet, including the transmission by the source S). Ruiz and Gomez-Skarmeta demonstrated that the problem of computing MNTs is NP-complete and proposed enhanced heuristics to approximate such trees [7]. They presented experimental results that show that the MNT algorithm offers the least number of transmissions compared with the MST and the SPT algorithms. On the other hand, the mean path lengths given by the MST and the MNT algorithms are longer than that by the SPT algorithm, as expected. However, the presented experimental results do not indicate how the multicast groups perform in terms of packet loss rate (or packet delivery ratio) − the true performance measure of a multicast session − or end-to-end delay − an important performance metric for realtime multicast applications such as distribution of stock quotes,
distributed interactive games and tele-conferencing. One could argue that SPTs are best in an environment where the network topology is unknown and the multicast members may be geographically distributed over a very large area, such as the Internet. In a WMN where the topology is known and the network size is much smaller (e.g., less than 500 nodes), MCTs such as Steiner trees or MNTs are no longer difficult to implement, and could potentially offer better performance because they typically consume less bandwidth than SPTs. On the other hand, MCT algorithms produce longer paths than SPT algorithms. In a wireless multi-hop network, the longer the path, the higher the probability that a packet will be lost due to packet collision or congestion, resulting in a throughput reduction. One could thus infer that SPTs could achieve higher throughput than MCTs. In short, it is not clear how the performance of SPTs and MCTs in a wireless multihop network compares. In this article, we present a simulation-based performance comparison of minimum cost trees and shortest path trees. Specifically we examine the following two minimum cost tree algorithms: the minimum Steiner tree (MST) heuristic proposed by Kou et al. [5], and the MNT heuristic by Ruiz and Gomez-Skarmeta [7]. Since both the Bellman-Ford and the Dijkstra’s algorithms converge to the same solution under static conditions of topology and non-negative link costs, we use only one of them − in this case, the Dijkstra’s algorithm − for computing SPTs. We measure the packet delivery ratio and end-to-end delay of multicast trees built by the MST, MNT and Dijkstra’s algorithms. We also study the effects of data traffic generated by the multicast nodes in MSTs, MNTs and SPTs on the packet loss rates of unicast flows in the same network. It is common knowledge that wireless 2
multi-hop networks suffer from scalability issues; that is, when the network size increases, the network performance degrades considerably. Therefore, our simulations assume WMNs of small to medium sizes (compared with the Internet) such as community networking, intra- and inter-building enterprise networking, emergency ad-hoc networks, and metropolitan area networks [1]. In the remainder of this article, we first describe our simulation setting and define the performance metrics. We then present experimental results that compare the performance and traffic impacts of multicast trees constructed the MST, MNT and SPT algorithms. Finally, we outline our future work and conclude the article.
12 SPT, 100 nodes SPT, 300 nodes MST, 100 nodes MST, 300 nodes MNT, 100 nodes MNT, 300 nodes
11
Average path length
10 9 8 7 6 5 4
II. E XPERIMENT S ETTING
3 20
Our experiments were carried out using QualNet [8], a software that provides scalable simulations of wireless networks and a commercial version of GloMoSim [9].
30
40
50
60
70
80
Number of receivers
Fig. 2.
A. Simulation Parameters
Average path lengths in the networks of 100 nodes and 300 nodes
Each experiment executed for 600 seconds of simulated time. Each data point in the graphs was obtained from 10 runs using different randomly generated seed numbers, and the collected data were averaged over the 10 runs.
Our simulation models a medium-size network of 100 wireless routers uniformly distributed over a 2000m x 2000m area, and a large network of 300 wireless routers, over a 3000m x 3000m area. We will use the term “wireless router” and “node” interchangeably in this article. There are no network partitions throughout the simulation. The edge cost or the cost of each wireless link is assumed to be one. A two-ray propagation model is used in our experiments, with free space path loss (2.0, 0.0) for near sight and plane earth path loss (4.0, 0.0) for far sight. The transmission power is set constant at 20dBm; the corresponding transmission range of the wireless routers is 315m; and the data transmission rate at the physical layer is 11Mbps, according to the specifications of wireless routers manufactured by TROPOS [10]. We use PHY802.11b at the physical layer. We implement only one channel on each wireless link. The MAC802.11 with DCF (Distributed Coordination Function) is chosen as the medium access control protocol. Multicast and broadcast transmissions use CSMA/CA (Carrier Sense Multiple Access with Collision Avoidance). Unicast transmissions also use RTS/CTS (Request To Send/Clear To Send) in addition to CSMA/CA. We assume that each sender or receiver is connected to a different wireless router. (In practice, there can be many hosts communicating with a wireless router, e.g., to form a wireless local area network). The sender and the receivers of a multicast group were selected randomly, and the same sender and receivers and the same network configuration were used for all three algorithms (MST, MNT and SPT) in order to obtain a fair comparison. All receivers joined a multicast group at the beginning and stayed until the whole group terminated. The sender of a multicast group transmits at a constant bit rate specified for each experiment. The data packet size excluding the header size is 512 bytes. The size of the queue at every node is 50 Kbytes. The packets in a queue are scheduled on a first-in-first-out basis. We did not implement flow or congestion control in order to test the network performance under very high loads.
B. Performance Metrics We use the following metrics to measure the performance of a multicast routing protocol: • Average packet delivery ratio (PDR). The PDR of a receiver is the number of data packets actually delivered to the receiver versus the number of data packets supposed to be received. The average PDR of a multicast group is the average of the PDRs of all the receivers in the group. • Average end-to-end delay. The end-to-end delay of every packet received at every receiver is recorded; the average over all the packets received is then computed. • Average path length: The path length is an indirect indicator of performance, as will be shown in the next section. The average path length is the average of the lengths of all source-to-destination paths in a multicast tree. III. E XPERIMENTAL R ESULTS We compare the performance of multicast sessions created by the SPT, MST and MNT algorithms using the above metrics. We also examine the impacts of the traffic created by the multicast nodes on unicast flows. A. Average Path Lengths In this set of experiments, we simulated different multicast groups by varying the number of receivers from 20 to 80. Each multicast group has one source. The graph in Figure 2 shows the average path lengths of the trees constructed by the three algorithms to be compared. The results confirm that the MST and MNT algorithms produce longer paths than the SPT algorithm in all cases. Furthermore, the larger the network, 3
1 0.95
Average packet delivery ratio
Average packet delivery ratio
1 0.95 0.9 0.85 0.8 0.75 0.7 0.65
SPT 0.6 MST MNT 0.55 10
20
30
40
50
60
70
80
0.9 0.85 0.8 0.75 0.7 0.65
SPT 0.6 MST MNT 0.55 10
20
30
Traffic load (packets/s)
(a)
50
60
70
80
(a) 50 Average end-to-end delay (ms)
50 Average end-to-end delay (ms)
40
Traffic load (packets/s)
45 40 35 30 25 20 15 10
SPT MST MNT
5 0
45 40 35 30 25 20 15 10
SPT MST MNT
5 0
10
20
30
40 50 Traffic load (packets/s)
60
70
80
10
20
30
40 50 Traffic load (packets/s)
60
70
80
(b)
(b)
Fig. 3. Performance of multicast sessions in the network of 100 nodes: a) average packet delivery ratio; b) average end-to-end delay.
Fig. 4. Performance of multicast sessions in the network of 300 nodes: a) average packet delivery ratio; b) average end-to-end delay.
the wider the difference gap. For instance, in the case of 40 receivers, the MST/MNT average path length is about 20% longer than the SPT average path length in the network of 100 nodes, but about 40% longer in the network of 300 nodes.
pronounced, as illustrated by the graphs in Figure 4. For instance, under a traffic load of 60 packets/s, the PDRs of the SPT, the MST and the MNT in the network of 100 nodes are 97%, 85% and 92%, respectively, while the PDRs in the network of 300 nodes are are 90%, 70%, and 66%, respectively, a difference of 24% between the SPT and the MNT. In the same scenario, the average end-to-end delay given by the SPT is about 36% lower than that of the MNT in the smaller network, and about 120% lower in the larger network. In other words, given the same multicast group size, as the network size increases, the performance gain of SPTs over MSTs and MNTs also increases. The reason is that the larger the network, the bigger the difference in path length between the SPT and the MST/MNT as mentioned earlier. We also examined multicast groups of other sizes − from 10 to 80 receivers [11]. In general, given the same network size and the same set of other parameters, as the number of receivers in a multicast group increases, the performance gap between the SPT and the MST/MNT becomes narrower; but the SPTs still perform better than (or, in a small number of cases, similarly to) the MSTs/MNTs in terms of packet delivery ratio and end-to-end delay.
B. Multicast Performance We examined a multicast group with one source and 20 receivers in the networks of 100 nodes and 300 nodes, respectively. The results for the 100-node network are illustrated in Figure 3. When the traffic load is light (under 30 packets/sec), the performance of the SPT, the MST and the MNT is comparable with respect to packet delivery ratio. When the traffic load is moderate or high, the SPT outperforms the MST and the MNT in all cases, and the difference can be significant. For example, when the traffic load is 60 packets/s, the PDRs of the SPT, the MST and the MNT are 97%, 85%, and 92%, respectively. The reason is due to longer path lengths of the MST and the MNT. The longer the path a packet has to travel, the higher its chance of getting damaged or lost due to collision and/or congestion, especially under high traffic load. The average end-to-end delays incurred by the SPTs are also the lowest thanks to shorter source-to-destination paths. For example, when the traffic load is 50 packets/s, the average endto-end delays given by the SPT and the MNT are 11ms and 15ms, respectively; in other words, the SPT average end-toend delay is about 36% lower. The MST provides the highest average end-to-end delay in this case. In the larger network of 300 nodes, the performance differences between the SPT and the MST/MNT are even more
C. Impacts of Multicast Traffic on Unicast Flows This set of experiments evaluates the impacts of data traffic generated by the SPT, the MST and the MNT. We considered two scenarios: the network has three and five multicast groups (or senders), respectively. Each sender/group has 10 receivers. We measured the impacts of multicast data traffic on the packet 4
IV. D ISCUSSIONS
Average unicast packet delivery ratio
3 senders, 10 receivers/sender
F UTURE W ORK
Our simulations are based on IEEE 802.11 CSMA/CA medium access control because this is a widely accepted radio technique for WMNs. Other types of WMNs that are being considered or standardized include 802.15 and 802.16 [1]. Since 802.16 uses TDMA (Time Division Multiple Access), and 802.15, a combination of TDMA and CSMA/CA, our future work is to extend this study to these types of networks. We assume that all transmissions of a multicast group take place on one channel. Although multi-channel mesh networks have been studied extensively in order to enhance the overall network throughput, currently there are no effective multichannel protocols for multicast communications, and designing such a protocol is not a trivial task either [12]. (Different multicast groups can use different channels though, as long as no channel switching is required for multicast transmissions. Our results are still valid when the multicast groups and unicast flows to be studied are on the same channel.) Finally, one of the current consensuses regarding WMNs is that they should be small to medium in size (compared with the Internet). The reason is that in 802.11-based networks the throughput of a flow decreases rapidly as its path length increases. (An 802.16 mesh is even less scalable, able to support only around 100 subscribers due to centralized scheduling message structures [1].) Our work thus assumes WMNs of small to medium sizes, and as such, would need to be re-examined for WMNs of very large scales should they be realized in the future as communication technology and protocols advance.
0.99 0.98 0.97 0.96 0.95 0.94 SPT 0.93 MST MNT 0.92 0 5
10
15
20
25
30
35
40
45
50
Sending rate per sender (packets/s)
Fig. 5. Impacts of multicast traffic on unicast flows: the number of multicast nodes is small or moderate. 5 senders, 10 receivers/sender Average unicast packet delivery ratio
AND
1
1 0.99 0.98 0.97 0.96 0.95 0.94 SPT 0.93 MST MNT 0.92 0 5
10
15
20
25
30
35
40
45
50
Sending rate per sender (packets/s)
Fig. 6. Impacts of multicast traffic on unicast flows: the number of multicast nodes is large.
V. C ONCLUSIONS loss rate, or the packet delivery ratio (PDR), of 20 unicast flows. Each unicast source transmits at a constant bit rate of 1 packet/s, and the packet size is 512 bytes excluding the header size. We varied the traffic load generated by each multicast sender and measured the average PDR of the unicast flows. Figures 5 and 6 display the results of this set of experiments in the network of 300 nodes. When the number of multicast nodes in the networks is small or moderate (30 receivers or less) or the multicast traffic load is light, the SPT, the MST and the MNT have similar effects on the average PDR of the unicast flows (Figure 5). When the multicast group is large (e.g., 5 senders and 50 receivers) and the total multicast traffic load is high (150 packets/s or more), the SPT causes more packet losses to the unicast flows than the MST and the MNT, from 1% to 3.5% more (Figure 6). This is due to the fact that the SPT involves more nodes in the data forwarding task than the MST and the MNT, and thus causes more packet collisions and more congestion to the unicast flows when the multicast sending rate is high. We obtained similar results from experiments in which the sender to receiver ratios of the multicast groups are different [11]. In general, the PDRs of the unicast flows depend on the aggregate multicast traffic load and the total number of multicast forwarding nodes in the network, as illustrated above.
We quantify the performance differences of minimum cost trees and shortest path trees in WMNs. Our simulation results show that SPTs offer significantly better performance to multicast flows than MCTs such as MSTs and MNTs. The average packet delivery ratio given by SPTs is higher by up to 24%, and the SPT average end-to-end delay is up to 120% lower in our experiments. The only drawback of SPTs is that when the multicast sending rate is high SPTs cause more packet losses to other flows than MCTs. The reason is that in a SPT typically more nodes are involved in the data forwarding task compared with a MCT. However, SPTs cause only 1% to 3.5% more packet loss to unicast flows than MCTs in our experiments, and only when the multicast traffic load is high. Under light or moderate traffic, SPTs and MCTs have similar effects on other flows in the network. In our opinion, the high multicast performance gain of SPTs outweights the above drawback. It is much easier to design a reliable transport protocol for unicast communications than for multicast communications in wireless multi-hop networks. Several TCP-based protocols have been proposed for reliable data delivery for unicast flows in wireless ad-hoc networks [13], which could be applied to WMNs. However the problem of reliable multicast in wireless ad-hoc networks still remains unsolved. Although several reliable multicast protocols have been proposed for the Internet (e.g., SRM, RMP, RMTP [2], NORM and ALC [14]), their applicability to and efficiency in WMNs have not been 5
studied. Until a reliable multicast protocol is proved effective and efficient for use in WMNs, SPTs provide the best tradeoff in terms of multicast and unicast packet delivery ratios. The unicast packets lost can be retransmitted and delivered using the existing TCP-based protocols [13]. Even if an efficient reliable multicast protocol is implemented in WMNs, SPTs would still be considered the better choice for many real-time applications such as video/audio conferencing, video streaming, distance learning, multiparty interactive games, and distribution of time-sensitive data (e.g., stock quotes, news), because SPTs offer lower end-to-end delay than MCTs. It is also worth mentioning another advantage of SPTs over MCTs. Although the wireless mesh routers are static, mesh hosts attached to the wireless end-routers such as cell phones, PDAs, and laptops may move from one wireless end-router to another, and may join and leave a multicast session freely at will. It is much easier to support dynamic joins and leaves using SPTs than MCTs, because in a SPT each source-todestination path is established independently of the other paths in the tree. In a MCT, a node joining or leaving the multicast session may require the whole tree to be re-computed in order to maintain the cost optimality (or the new tree would no longer be optimal). This implementation difficulty of MCTs makes SPTs the more practical multicast routing approach in WMNs. R EFERENCES [1] I. Akyildiz, X. Wang, and W. Wang, ”Wireless Mesh Networks: A Survey,” Elsevier Computer Networks, vol. 47, no. 4, March 2005, pp. 445-487. [2] S. Paul, Multicast on the Internet and Its Applications, Kluwer Academic Publishers, 1998. [3] D. Bertsekas and R. Gallagher, Data Networks, Prentice Hall, 1991. [4] M. Sipser, Introduction to the Theory of Computation, 2nd edition, Thomson Course Technology, 2005. [5] L. Kou, G. Markowsky, and L. Berman, “A Fast Algorithm for Steiner Trees,” Acta Informatica, vol. 2, no. 15, June 1981, pp. 141-145. [6] A. Zelikovsky, “An 11/6-approximation Algorithm for the Network Steiner Problem,” Algorithmica, vol. 9, no. 5, May 1993, pp. 463-470. [7] P. M. Ruiz, A. F. Gomez-Skarmeta, “Approximating Optimal Multicast Trees in Wireless Multihop Networks,” 10th IEEE Symposium on Computers and Communications, June 2005, pp. 686-691. [8] QualNet Network Simulator version 3.9.1, http://www.scalablenetworks.com/. [9] GloMoSim Simulator, http://pcl.cs.ucla.edu/projects/glomosim/. [10] TROPOS Networks, http://www.tropos.com/. [11] J. Xu, Multicast in Wireless Mesh Networks, Master’s Thesis, Department of Computer Science and Engineering, York University, Toronto, Canada, October 2006. [12] P. Kyasanur, J. So, C. Chereddi, and N. H. Vaidya. “Multi-Channel Mesh Networks: Challenges and Protocols,” IEEE Wireless Communications, vol. 13, no. 2, April 2006. [13] C. Siva Ram Murthy and B.S. Manoj, Ad Hoc Wireless Networks: Architectures and Protocols, Prentice Hall, 2004. [14] Reliable Multicast Transport, Internet Engineering Task Force, http://www.ietf.org/html.charters/rmt-charter.html.
6