Genet. Sel. Evol. 34 (2002) 61–81 © INRA, EDP Sciences, 2002 DOI: 10.1051/gse:2001004
61
Original article
Multiple trait model combining random regressions for daily feed intake with single measured performance traits of growing pigs Urs SCHNYDER a,∗ , Andreas HOFER a , Florence LABROUEb , Niklaus KÜNZIa a b
Abstract – A random regression model for daily feed intake and a conventional multiple trait animal model for the four traits average daily gain on test (ADG), feed conversion ratio (FCR), carcass lean content and meat quality index were combined to analyse data from 1 449 castrated male Large White pigs performance tested in two French central testing stations in 1997. Group housed pigs fed ad libitum with electronic feed dispensers were tested from 35 to 100 kg live body weight. A quadratic polynomial in days on test was used as a regression function for weekly means of daily feed intake and to describe its residual variance. The same fixed (batch) and random (additive genetic, pen and individual permanent environmental) effects were used for regression coefficients of feed intake and single measured traits. Variance components were estimated by means of a Bayesian analysis using Gibbs sampling. Four Gibbs chains were run for 550 000 rounds each, from which 50 000 rounds were discarded from the burn-in period. Estimates of posterior means of covariance matrices were calculated from the remaining two million samples. Low heritabilities of linear and quadratic regression coefficients and their unfavourable genetic correlations with other performance traits reveal that altering the shape of the feed intake curve by direct or indirect selection is difficult. random regression / variance component / Gibbs sampling / feed intake / pig
∗
Correspondence and reprints E-mail:
[email protected] Present address: Swiss Brown Cattle Breeders’ Federation, Chamerstrasse 56, 6300 Zug, Switzerland
U. Schnyder et al.
66
Table II. Lower diagonal elements of the symmetric scale matrix S G for the inverse Wishart prior distribution of the additive genetic covariance matrix (G 0 ) between the intercept, linear and quadratic regression coefficients for daily feed intake and single measured performance traits: average daily gain (ADG), feed conversion ratio (FCR), carcass lean content (CLC) and meat quality index (MQI). Trait
Intercept
Intercept Linear Quadratic ADG FCR CLC MQI
2.23 e 2 3.60 e 4 2.90 e 6 4.90 1.90 e 3 1.562 e 1 1.486 e 2
Linear
Quadratic
ADG
1.40 e-5 7.00 e 8 1.90 e 9 0.0 0.0 3386.0 0.0 0.0 2.186 0.0 0.0 0.0 0.0 0.0 0.0
FCR
CLC MQI
symmetric
0.0080 0.0990 0.0141
7.620 0.1451 1.105
Table III. Lower diagonal elements of the symmetric scale matrix S PE for the inverse Wishart prior distribution of the total permanent environmental covariance matrix (sum of P0 and E0 ) between the intercept, linear and quadratic regression coefficients for daily feed intake and single measured performance traits: average daily gain (ADG), feed conversion ratio (FCR), carcass lean content (CLC) and meat quality index (MQI). Trait Intercept Linear Quadratic ADG FCR CLC MQI
Intercept 3.06 e 2 1.14 e 3 1.11 e 5 0.0 0.0 0.0 0.0
Linear 1.96 e 4 2.62 e 6 0.0 0.0 0.0 0.0
Quadratic
ADG
FCR
CLC
MQI
symmetric 3.97 e 8 0.0 5 079.0 0.0 0.0 0.032 0.0 0.0 0.0 3.267 0.0 0.0 0.0 0.0 4.418
into its components pen (P0 ) and individual (E0 ) permanent environmental (co)variance with a ratio of 1 to 9. Priors for parameters γ0 , γ1 and γ2 , that describe the course of the residual variance σε2m for weekly means of daily feed intake, were assumed independent of each other and normally distributed with standard deviations of 1.5(γ0 ), 0.1(γ1 ) and 0.01(γ2 ). These standard deviations represent a relatively wide range of values, that parameters γ 0 , γ1 and γ2 might reasonably take. The same values were used in an earlier study [11], where they were chosen to express the low level of knowledge about distributions of these parameters. As the Metropolis-Hastings algorithm performed well with these values, they were not changed for the present study. Unlike residuals for daily feed intake in a random regression model, uncorrelated residuals for single measured traits cannot be distinguished from indi-
U. Schnyder et al.
72
Table VI. Averages (μ) and standard deviations (s.d.) over all tested animals for intercept, linear and quadratic regression coefficients of daily feed intake (coefficients fitted to records o f each animal separately) and for single measured performance traits, average daily gain (ADG), feed conversion ratio (FCR), carcass lean content (CLC) and meat quality index (MQI), together with estimates of posterior mean of phenotypic standard deviations from the two models with (σ ph 1) and without (σph 2) covariable “weight at the end of the test” for ADG and FCR. Trait Unit
Intercept kg
μ s.d. σph 1 σph 2
1.344 0.364 0.250 0.256
Linear kg/day 3.60 e 2.32 e 1.48 e 1.49 e
02 02 02 02
Quadratic kg/day2 1.47 e 3.33 e 1.94 e 1.96 e
04 04 04 04
ADG g
FCR kg/kg
CLC %
MQI –
851.74 87.85 67.82 83.56
2.918 0.234 0.274 0.217
56.67 3.37 2.64 2.64
10.734 2.565 2.449 2.447
allow for residual correlations between random regression coefficients and single measured performance traits, as explicitly fitting individual permanent environmental effects for regression coefficients is necessary for a proper definition of heritability for these artificial traits [11]. Fixing residual variances to higher values than the ones used in this study would improve mixing of the Gibbs sampler. One needs to make sure though that estimates of individual permanent environmental covariances are not affected by the choice of fixed residual variances (see equation (8)). The following strategy is recommended for the analysis of a random regression model combined with single measured traits: 1) run a short Gibbs chain with the residual variance of single measured traits fixed to a small value (s2 ∼ 1–10% of phenotypic variance) to get an indication of the distribution of variance among effects; 2) if necessary, adjust s2 based on individual permanent environmental correlations (equation (8), new s2 higher if correlation close to zero and lower if close to (−1) or 1); 3) then run the Gibbs sampler for as many rounds as needed for the desired accuracy of estimates. Table VI compares model estimates of phenotypic standard deviations (Gibbs posterior means) with a simple estimate of standard deviation from the raw data (not corrected for fixed effects). For regression coefficients of daily feed intake raw data estimates were obtained by first fitting a quadratic polynomial to feed intake records of each animal separately and then treating the resulting regression coefficients like single measured traits. Mean values (Tab. VI) of intercept and linear regression coefficients for daily feed intake are positive, while it is negative for the quadratic regression coefficient. Values for
U. Schnyder et al.
74
Table VII. Estimates of posterior means of heritabilities (bold), genetic (above diagonal) and phenotypic (below diagonal) correlations of the intercept, linear and quadratic regression coefficients for daily feed intake, and for single measured performance traits the average daily gain (ADG), feed conversion ratio (FCR), carcass lean content (CLC) and meat quality index (MQI). Trait Intercept Linear Quadratic ADG FCR CLC MQI
Intercept Linear 0.32 0.40 0.28 0.30 0.25 0.13 0.01
0.02 0.06 0.91 0.29 0.11 0.24 0.03
Quadratic
ADG
FCR
CLC
MQI
0.83 0.35 0.03 0.08 0.10 0.13 0.01
0.82 0.38 0.63 0.45 0.34 0.09 0.02
0.50 0.48 0.16 0.33 0.21 0.44 0.08
0.33 0.55 0.13 0.28 0.65 0.79 0.11
0.04 0.57 0.24 0.29 0.04 0.27 0.25
(Tab. VII). The genetic correlation between the intercept and the quadratic regression coefficient is higher than that reported earlier for another set of Large White data [11], while the genetic correlation between linear and quadratic regression coefficients is lower. Genetic correlations among regression coefficients (Tab. VII) indicate that selection for a higher intercept might lead to flatter feed intake curves. But as heritabilities of linear and quadratic regression coefficients are low, indirect selection responses are expected to be small. This confirms that it is easier to change the overall level than the shape of feed intake curves.
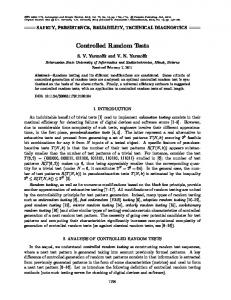
3.2.2. Weekly means of daily feed intake Figure 1 shows the course of heritability, additive genetic, permanent environmental and residual variances for weekly means of daily feed intake. Week 14 is not shown, as only three animals had records in this last week of the test (Tab. I). Course of variances is similar to what we found earlier for Large White and French Landrace pigs [11], but with increased additive genetic and reduced permanent environmental variance. Consequently, heritability estimates are also higher (Fig. 1) than in our previous study [11]. Heritability for weekly means of daily feed intake increased from 0.20 in the first week of the testing period to 0.38 in week 10 (Fig. 1), which is in the range of the values reported by other authors [4–6,14]. Because of the relatively high variation around feed intake curves, the heritability for weekly means of daily feed intake is lower in the first seven weeks of the testing period (Fig. 1) than the heritability of the intercept regression coefficient (Tab. VII), which should represent very similar information. Selection for higher feed intake in the beginning of the testing period should thus rather be based on the intercept regression coefficient than on weekly means of daily feed intake of early test weeks.