which may be an arithmetic, geometric or harmonic mean depending on d(·, ·). On manifolds, the Karcher mean with distance d(yi,yj) = Logyi yj satisfies â. N.
Multivariate General Linear Models (MGLM) on Riemannian Manifolds with Applications to Statistical Analysis of Diffusion Weighted Images Hyunwoo J. Kim Barbara B. Bendlin
Nagesh Adluru Maxwell D. Collins Moo K. Chung Sterling C. Johnson Richard J. Davidson Vikas Singh University of Wisconsin-Madison
http://pages.cs.wisc.edu/~hwkim/projects/riem-mglm
Abstract
ing the notion of distance between points a and b by the ex�P �1 j j 2 2 pression, (a − b ) , which holds whenever j=1...n the data are real vectors. In the Euclidean setting, a simple parametric model, yi = α + βxi + �i , suffices to identify the linear relationship between scalar-valued xi ∈ X and the dependent (i.e., response) variable yi ∈ Y with error �i . The least squares estimate is,
Linear regression is a parametric model which is ubiquitous in scientific analysis. The classical setup where the observations and responses, i.e., (xi , yi ) pairs, are Euclidean is well studied. The setting where yi is manifold valued is a topic of much interest, motivated by applications in shape analysis, topic modeling, and medical imaging. Recent work gives strategies for max-margin classifiers, principal components analysis, and dictionary learning on certain types of manifolds. For parametric regression specifically, results within the last year provide mechanisms to regress one real-valued parameter, xi ∈ R, against a manifold-valued variable, yi ∈ M. We seek to substantially extend the operating range of such methods by deriving schemes for multivariate multiple linear regression — a manifold-valued dependent variable against multiple independent variables, i.e., f : Rn → M. Our variational algorithm efficiently solves for multiple geodesic bases on the manifold concurrently via gradient updates. This allows us to answer questions such as: what is the relationship of the measurement at voxel y to disease when conditioned on age and gender. We show applications to statistical analysis of diffusion weighted images, which give rise to regression tasks on the manifold GL(n)/O(n) for diffusion tensor images (DTI) and the Hilbert unit sphere for orientation distribution functions (ODF) from high angular resolution acquisition. The companion open-source code is available on nitrc.org/projects/riem mglm.
ˆ = arg min (α, ˆ β) (α,β)
N X
kyi − α − xi βk2 ,
(1)
i=1
and the closed form solution to (1) is obtained as, E [(x − x ¯)(y − y¯)] Cov[x, y] = βˆ = , Var[x] E [(x − x ¯)2 ]
α ˆ = y¯ − βˆx ¯.
(2)
If x and y are multivariates, one can easily replace the multiplication and division with an outer product of vectors and matrix inversion respectively, and obtain an analytical solution. Despite the simplicity of the above solution, it is not universally applicable. Occasionally, the variables that constitute the data are not in Rn and imposing the Euclidean topology forcibly can lead to poor estimation. For example, parametric families such as Dirichlet or multinomial cannot be treated as Euclidean spaces [18]. Similarly, in shape analysis, arbitrary linear combinations of shapes do not constitute a ‘valid’ shape — instead, feasible solutions are only those that correspond to points on a shape manifold. Covariance matrices in machine learning and diffusion tensors in neuroimaging are positive definite matrices. Operations that are simple in the Euclidean space such as taking the arithmetic mean cannot be applied directly to such data because of the absence of an additive structure. Manifold valued variables arise frequently in data analysis. While the relationship between statistics and Riemannian geometry is well known, in the last two decades, one can see a concerted effort to move beyond rigorous asymptotic results, and use these ideas to perform inference on real-world derived datasets in a more principled way. This has led to a
1. Introduction Regression is ubiquitous in scientific analysis to identify how a dependent variable, y ∈ Y relates to an independent variable, x ∈ X . Here, we are provided training data in the form, (xi , yi )N i=1 ⊂ X × Y, and seek to find the best model that explains these observations, given an appropriate loss function. The classical setting typically makes an assumption on the geometric structure of the data by captur1
developing body of practical methods to operate on differentiable manifolds which are smooth and locally Euclidean and endowed with a metric given as a local inner product between tangent vectors. Related work. There is a mature body of work in statistics dating back to the seminal work of Rao [21] and Efron [7] showing how the asympotic properties of a statistical model relate to the curvature of a corresponding manifold. But since the 1990s, such concepts have been leveraged towards characterizing problems in statistical learning and vision. On the machine learning front, Amari [1] showed how to use differential geometry and Fisher information principles for neural networks, whereas Jaakkola [12] derived hybrid schemes combining properties of generative and discriminative methods based on geometric principles. There are numerous learning theoretic results [17] examining geometric insights into the behavior of AdaBoost and large margin classifiers [18]. Independently, research in vision/medical imaging has studied manifold regression for shape analysis. These results include regression on a group of diffeomorphisms for brain atrophy models [20], semi-parametric regression [23], computing equivalence classes of curves [16], comparing images [27], and models for spherical regression [22]. Just within the last few years, this effort has provided new solutions for various vision problems: online covariance matrix updates for video tracking [2], spatial clustering for high angular resolution diffusion data [11], Principal Geodesic Analysis [9], dimensionality reduction [10], Nadaraya-Watson kernel regression [4] and dictionary learning for diffusion magnetic resonance images [24]. While these advances are notable, efficient methods that extend standard linear regression to the Riemannian manifold setting have appeared in the vision literature only recently. Last year, Fletcher [8] proposed an elegant parametric formulation called geodesic regression that regresses a manifold valued variable, y ∈ Y against a real valued variable, x ∈ X . Soon thereafter, [6] adapted the ideas for regressing a dependent variable y which lies on a unit Hilbert sphere against reals, x ∈ X . These solutions provide a rigorous framework for approaching important problems including those studied in [4]. For instance, [4] calculated anatomical shape change as a function of a random variable x in a population, i.e., y lies on a shape manifold and x corresponds to age (or disease). With [8], one may derive linear relationships for rotations, shapes, and other manifolds — a substantial step forward. Unfortunately, the models in their current form do not directly address various other interesting questions that come up routinely in practice. Consider the following motivating example: the shape of an anatomical region may not only be affected by disease but also by age and gender. These may be “nuisance” parameters [26]. In such cases, the desired statistical model must explicitly control for such confounding variables, otherwise will lead
to false positives and false negatives (Type 1, Type 2 errors). In other words, the relationship between shape (or some manifold valued y) and disease, must be conditioned on age. This necessitates extending general linear models (GLM) to the manifold setting, which is precisely the goal of this paper. Our contributions are: (i) a novel framework for MGLM for manifold valued y (for certain manifolds) and multiple independent random variables, x; (ii) a gradient descent scheme for multiple linear regression on manifolds such as P (n) and (iii) an approximate Log-Euclidean scheme with accompanying analysis. Jointly, these ideas expand the operating range of existing methods enabling various hypotheses testing studies with multiple confounding variables. We show applications to statistical analysis of diffusion weighted magnetic resonance images, which give rise to the manifold of positive definite matrices, P (n), and the unit Hilbert sphere, S ∞ , depending on the acquisition type. Our experiments are accompanied by an open source library, where few alternatives exist today.
2. Preliminaries We briefly summarize certain basic concepts and notations [5] that the remainder of the presentation will utilize. Riemannian manifolds. A differentiable manifold [5] of dimension n is a set M and a maximal family of injective mappings ϕi : Ui ⊂ Rn → M of open sets Ui of Rn into M such that: (1) ∪i (Ui ) = M; (2) for any pair i, j with −1 ϕi (Ui ) ∩ ϕj (Uj ) = W 6= φ, the sets ϕ−1 i (W ) and ϕj (W ) −1 n are open sets in R and the mappings ϕj ◦ ϕi are differentiable, where ◦ denotes function composition. In other words, a differentiable manifold M is a topological space that is locally similar to Euclidean space and has a globally defined differential structure. The tangent space at a point p on the manifold, Tp M, is a vector space that consists of the tangent vectors of all possible curves passing through p. The Tangent bundle of M, i.e., T M, is the disjoint union ` of tangent spaces at all points of M, T M = p∈M Tp M. The tangent bundle is equipped with a natural projection map π : T M → M [19]. A Riemannian manifold is equipped with a smoothly varying inner product. The family of inner products on all tangent spaces is known as the Riemannian metric of the manifold. We can define various geometric measures on the manifold such as the angle between two curves or the length of a curve. The geodesic distance between two points on M is the length of the shortest geodesic curve connecting the two points, analogous to straight lines in Rn [13]. The geodesic curve from yi to yj can be parameterized by a tangent vector in the tangent space at yi with an exponential map Exp(yi , ·) : Tyi M → M. The inverse of the exponential map is the logarithm map, Log(yi , ·) : M → Tyi M. For completeness, Table 1 shows corresponding operations in the Euclidean space and Riemannian manifolds. Separate
from the above notation, matrix exponential (and logarithm) are simply given as exp(·) (and log(·)). Intrinsic mean. Let d(·, ·) define the distance between two points. The intrinsic (or Karcher) mean is the minimizer to y¯ = arg min
y∈M
N X
wi d(y, yi )2 ,
The basic geodesic regression model in [8] for extending linear regression to the Riemannian manifold setting is, y = Exp(Exp(p, xv), �)
(4)
where � is the error (a tangent vector), x ∈ R and y ∈ M are the independent and dependent variables resp., p ∈ M is a ‘base’ point on the manifold, and v ∈ Tp M is a tangent vector at p. For consistency with Euclidean space, we use m for the dimensionality of Tp M. Comparing (4) and Table 1, observe that p and v correspond to the intercept α and the slope β in (1). Given N pairs of the form (xi , yi ), [8] solves for (p, v) ∈ T M to fit one geodesic curve to the data,
Subtraction Addition Distance Mean Covariance
N 1X d(Exp(p, xi v), yi )2 , 2 i=1
(5)
Euclidean − → x− i xj = xj − xi − −− x +x x→
Riemannian − → x− i xj = Log(xi , xj ) − −− Exp(x , x x→)
→ k− x− i xj k Pn −→ ¯xi = 0 i=1 x � � E (xi − x ¯)(xi − x ¯)T
kLog(xi , xj )kxi Pn x, xi ) = 0 i=1 Log(¯ � � E Log(¯ x, x)Log(¯ x, x)T
i
x11 x12
v1
yˆ1
yˆ2
v2
(3)
2.1. Geodesic regression: The basic formulation
Operation
x21
i=1
which may be an arithmetic, geometric or harmonic mean depending on d(·, ·). On manifolds, the Karcher mean with PN distance d(yi , yj ) = kLogyi yj k satisfies i=1 Logy¯yi = 0. This identity means that y¯ is a local minimum which has a zero norm gradient [15], i.e., the sum of all tangent vectors corresponding to geodesic curves from mean y¯ to all points yi is zero in the tangent space Ty¯M. On manifolds, the existence and uniqueness of the Karcher mean is not guaranteed unless we assume, for uniqueness, that the data is in a small neighborhood (see pseudocode in the extended version). Parallel transport. Let M be a differentiable manifold with an affine connection ∇ and I be an open interval. Let c : I → M be a differentiable curve in M and let V0 be a tangent vector in Tc(t0 ) M, where t0 ∈ I. Then, there exists a unique parallel vector field V along c, such that V (t0 ) = V0 . Here, V (t) is called the parallel transport of V (t0 ) along c.
E(p, v) :=
p x22
j k
i
O
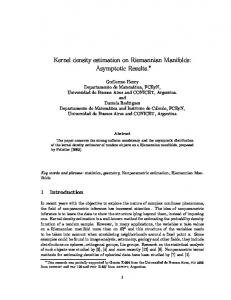
Figure 1: MGLM on manifolds. v1 , v2 are tangent vectors. Each entry of independent variables (x1 , x2 ) ∈ R2 , is multiplied by v1 and v2 respectively in Tp M. Here, xji denotes j-th entry of the i-th instance.
providing the estimate yˆi = Exp(p, xi v). Here, d(a, b) = p hLog(a, b), Log(a, b)ia is the geodesic distance between two points on M. Rewriting (5) in the form of a minimization problem using the definition of d(·, ·), we obtain min
(p,v)∈T M
(6)
To minimize E, one first needs to specify ∇p E(p, v) and ∇v E(p, v). This requires computing derivatives of the exponential map with respect to p and v. The gradients are derived in terms of Jacobi fields (which are solutions to a second order equation subject to certain initial conditions [8]) or via introducing small perturbations [6]. To express this in a computable form, we need to find the so-called adjoint derivative. If dp Exp(p, v) is the derivative of the exponential map with respect to p, its adjoint derivative is hdp Exp(p, v)u, wi = hu, dp Exp(p, v)† wi, where w is a tangent vector. Putting these pieces together, the gradient descent scheme [8] can optimize (6) in a numerically stable manner and obtain the estimates of p and v. Can we extend this idea to multiple linear regression? Given the precise form of the scheme above, it is natural to ask if a similar idea will work for the MGLM model. It turns out that there are certain conceptual and technical difficulties in attempting such an extension. Observe that geodesic regression in (5) works on a scalar independent variable in R (and thereby, a single geodesic). For multiple linear regression, one must invariably make use of a subspace instead. Shortly, we will see that this issue can be resolved by identifying multiple geodesic curves which correspond to ‘basis’ vectors in Euclidean space, see Fig. 1. It is similar to the concept of geodesic submanifold in [9]. Let us now look at some of the technical difficulties by writing down the form of the gradients in geodesic regression.
j k
Table 1: Basic operations in Euclidean space and Riemannian manifolds.
1X hLog(yˆi , yi ), Log(yˆi , yi )iyˆi 2 i
−
N X
dp Exp(p, xi v)† $yi , and −
i=1
|
N X
xi dv Exp(p, xi v)† $yi
i=1
{z
∇p E(p,v)
}
|
{z
∇v E(p,v)
}
where $yi = Log(Exp(p, xi v), yi ) and dp Exp(p, xi v)† is the adjoint derivative [8]. The derivative of the exponen-
tial map, dExp(p, v), is obtained by Jacobi fields along a geodesic curve parameterized by a tangent vector v. Here, this idea works because the prediction is a single geodesic curve. In multiple linear regression, predictions do not correspond to one geodesic curve; so, expressing the corresponding tangent vector (essential for Jacobi fields), is problematic. Next, a key property of the adjoint derivative above is that the result of applying the operator, d(p, v)† , on w should lie in a tangent space. But for manifolds like GL(n)/O(n), the tangent space corresponds to symmetric matrices [2]. This requires designing a special adjoint operator which guarantees this property, which is not trivial.
3. General linear model (GLM) on manifolds Let x and y be vectors in Rn and Rm respectively. The multivariate multilinear model in Euclidean space is. y = α + β 1 x1 + β 2 x2 + . . . + β n xn + �
(7)
where α, β i and the error � are in Rm and x = [x1 . . . xn ]T are the independent variables. Just as (7) uses a vector of independent variables, multivariate multilinear geodesic regression uses a geodesic basis which corresponds to multiple tangent vectors, one for each independent random variPn able. Let V xi := j=1 v j xji . Our formulation with multiple geodesic bases is min
p∈M,∀j,v j ∈Tp M
N 1X d(Exp(p, V xi ), yi )2 , 2 i=1
(8)
lowing modification preserves equivalence 1X hLog(yˆi , yi ), Log(yˆi , yi )iyˆi (9) 2 i 1X hΓyˆi →p Log(yˆi , yi ), Γyˆi →p Log(yˆi , yi )ip , (10) = 2 i
E(p, v) =
P where yˆi = Exp(p, j xji v j ). Comparing (9) and (10), we see that in (9), the inner product occurs at each tangent space Tyˆi M, whereas (10) expresses all inner products in a tangent space Tp M, after applying a parallel transport. Of course, when we have a single independent variable — we can either use the adjoint derivative operator as in [8] or the parallel transport strategy; we have verified that empirically, the results match. But the latter option is convenient for handling tangent spaces for multiple independent variables. For an object u on a manifold, let uo denote the corresponding object in tangent space of u at Tp M. To derive our gradient expression, we will use the model in the tangent space as a temporary placeholder, to keep notations simple. Let us first define a few useful terms. Below, E is the error from (5) and E o gives the Log-Euclidean error in Tp M. Let po := Log(p, p) and yio := Log(p, yi ). We are searching for not only tangent vectors but also the tangent space itself. To do so, by introducing a zero-norm tangent vector po which corresponds to the origin of tangent space Tp M, the direction to move the origin is obtained. So, the estimate, yˆi o is Log(p, yˆi ) = Log(p, Exp(p, V xi )) = V xi + po , where V = [v1 . . . vn ] is a m-by-n matrix, v j is the mdimensional tangent vector. The model in tangent space Tp M is given as min E o (po , v) := min po ,v
3.1. Variational method for gradient descent High level summary and idea. To address the technical issues pertaining to the adjoint derivatives, we will attempt to obtain a similar effect to that operator, but via different means. First, observe that in [8], to enable summing up the individual dExp(p, xi v)† Log(Exp(p, xi v), yi )’s which gives the gradient, ∇E, a necessary condition is that these terms should lie in Tp M. Here, Exp(p, xi v) gives the predicted yˆi for yi , and so Log(Exp(p, xi v), yi ) is the error and must lie in TExp(p,xi v) M, i.e., Tyˆi M. By this argument, dExp(p, xi v)† actually plays a role of parallel transport to bring each error Log(Exp(p, xi v), yi ) from Tyˆi M to Tp M. Since we hope to avoid constructing a special adjoint operator, we will instead perform parallel transport explicitly and derive the appropriate gradient terms, as outlined below. Let us consider a slight variation of the objective function in (8). Let Γp→q (w) be a parallel transport of w from Tp M to Tq M. Recall that parallel transport does not change the norm of tangent vectors, so the measurement of an error vector remains accurate. This ensures that the fol-
po ,v
1X X j j k( v xi + po ) − yi o k2 2 i j
(11)
Its gradient is expressed as ∇p o E o =
X i
(yˆi o − yio ),
∇v j E o =
X
xji (yˆi o − yio ),
(12)
i
P where yˆi o = j v j xji + po . Note that this gradient is the ‘approximate’ gradient in the linearized (tangent) space. Of course, we are actually interested in minimizing the parallel transported error on the manifold. So, we will substitute the parallel transported form for the linearized expression, (yˆi o − yio ) in (12) above and obtain, ∇p E ≈ −
X i
Γyˆi →p Log(yˆi , yi ), ∇vj E ≈ −
X
xji Γyˆi →p Log(yˆi , yi )
i
where yˆi = Exp(p, V xi ). Separate from the intuitive reasoning above, one may take derivatives of (10) directly and verify that if a constant (and a constant times xji ) suffices for ∂ a first order approximation of ∂p Γyˆi →p Log(Exp(p, V xi ), yi ) ∂ and ∂vj Γyˆi →p Log(Exp(p, V xi ), yi ) respectively, the form above approximates the gradient well. Otherwise, in a pathological case, we still make progress in a descent direction but the convergence rate will be worse (assuming the approximant is chosen to be small enough).
Remarks. Consider the Euclidean setting where xi and xj are large. The optimal intercept, p∗ , will be far from yi and yj which is not a problem since we can explicitly solve for any value for the intercept. But parametric models for Riemannian manifolds are based on the assumption that data are distributed in a sufficiently small neighborhood where exponential and logarithm maps are well-defined. In addition, x should not have “large” entries (relative to the variance of x) otherwise p∗ might be too far from the data and there is no well-defined exponential map to represent y = Exp(p∗ , V x). Thus, we may explicitly solve for a parameter to translate the x variables, y = Exp(p, V (x − b)) where b ∈ Rn . However, it may lead to many local minima. A simple fix to this problem is to first “center” the x variables which makes the optimization scheme stable (see pseudocode in Algo. 1).
4. Log-Euclidean geodesic regression In this section, we outline an approximate algorithm that is simpler and offers more flexibility in analysis at the cost of a few empirically derived assumptions. To motivate the formulation, let us take a manifold perspective of (2): we see that analytical solutions can be obtained using the difference of each point from its mean both in X and Y space −→ −→ — that is, the quantities x ¯xi and y¯yi calculated in the tangent space, Tp∗ M. Note that in (2), β corresponds to tangent vectors and α corresponds to p∗ . Our scheme in (8) explicitly searches for p∗ , but in experiments, we found that frequently, p∗ turns out to be quite close to y¯. This observation yields a heuristic where rather than solve for p, we operate entirely in Ty¯M. With this assumption, using the Karcher mean as y¯ in (2) and the Log-Euclidean distance as −→ −→ a substitute for x ¯xi and y¯yi , we can derive a faster approximate procedure. This scheme has the additional benefit that it allows analyzing multiple manifold-valued independent variables in a GLM setting too, if desired. The Log-Euclidean MGLM estimates a linear relationo N ship between centered variables {xoi }N i=1 and {yi }i=1 where
xoi = xi − x ¯ and yio = Log(¯ y , yi ), where the number of tangent vectors we estimate is exactly equal to the number of independent variables, x. We do not use an affine model here because that makes drawing an analogy with our full MGLM formulation problematic. For example, an affine model in the Log-Euclidean setting will entail learning (n+1) tangent vectors — for the n different x-variables plus one for the intercept. But even for n = 1, the estimates derived will no longer be valid geodesic curves since they do not pass through po ∈ Tp M (because of the intercept). By taking y¯ as p preserves these geodesic properties. Our basic procedure estimates the set of vectors V = [v1 . . . vn ] in tangent space Ty¯M and p a point on M o ] and using the relation Y o = V X o . Y o ≡ [y1o . . . yN o o o X ≡ [x1 . . . xN ] are respectively the mean centered data. p∗ is given by the Karcher mean y¯. V ∗ is given by the least squares estimation with respect to the Log-Euclidean metric and can be computed using the closed form solution, �−1 Y o X oT X o X oT . The following analysis shows that under some conditions, heuristically substituting y¯ for p∗ is justifiable beyond empirical arguments alone. In particular, if the y observations come from some geodesic curve, then all of the data can be parameterized by one tangent vector in the tangent space at y¯. More specifically, we show that a Karcher mean exists on a geodesic curve. So, if the Karcher mean is unique, then the Karcher mean must lie on the geodesic curve. By the definition of exponential map and since the data are in sufficiently small neighborhood, it becomes possible to parameterize the observations by Exp(¯ y , vx). Prop. 1 shows the existence of the Karcher mean on a geodesic curve when the data lies on the unique geodesic curve, Ω, between two points. Proposition 1. Let Y = {y1 , . . . , yN } be a subset of a manifold M. Suppose that Y is in a sufficiently small open cover B such that the exponential and logarithm maps are bijections. Suppose that all y ∈ Y are on a curve Ω that is the unique geodesic curve between Psome yi and yj in Y . Then there exists y¯ in Ω such that y∈Y Logy¯y = 0 (the first order condition for Karcher mean).
Algorithm 1 MGLM on manifolds Input: x1 , . . . , xN ∈ Rn , y1 , . . . , yN ∈ M Output: p ∈ M, v 1 , . . . , v n ∈ Tp M, Initialize p, v, α, αmax and center x while termination condition do pnew = Exp(p, −α∇p E) Vnew = Γp→pnew (V − α∇V E) if E(pnew , Vnew ) < E(p, V ) then V ← Vnew and P ← Pnew α = min(2α, αmax ) else α = α/2 end if end while
Proof. Let v ∈ Tyi M be the tangent vector v = Logyi yj . Since all points of Y are a subset of a geodesic curve Ω between yi , and yj , for each yk ∈ Y , there exists an xk ∈ PN [0, 1] such that yk = Exp(yi , vxk ). So, let P x ¯ = N1 k=1 xk and y¯ = Exp(yi , v¯ x). Then, y¯ satisfies k Logy¯yk = 0 and it is in Ω since the arithmetic mean x ¯ is in [0, 1]. With this result in hand, we next show that the data is parameterizable in terms of V . Proposition 2. If y¯ is the unique Karcher mean of Y ⊂ Ω, and it is obtained in B, then y¯ ∈ Ω. Further, for some
v ∈ Ty¯M and each y, there exists x ∈ R such that y = Exp(¯ y , vx). Proof. If y¯ is a unique Karcher mean of Y on M and it is obtained inP a sufficiently small neighborhood B ⊂ M N of data, then k=1 Logy¯yk = 0 holds by the first order optimality condition of (3). Uniqueness of y¯ and Prop. 1 implies that y¯ is in Ω. In a small neighborhood, by definition of exponential map, there must exist an appropriate x.
5. Experiments Here, we show the application of our models for statistical analysis of diffusion weighted imaging (DWI) data. On synthetic simulations and real data from two distinct neuroimaging studies, the experiments evaluate whether (and to what extent) general linear model (GLM) analysis on diffusion weighted images in neuroimaging can benefit from (a) the ability to deal with manifold valued data (b) allowing multiple explanatory (including nuisance) variables.
5.1. Diffusion weighted imaging DWI is a magnetic resonance (MR) imaging modality that non-invasively maps and characterizes the microstructural properties and macroscopic organization of the white matter regions in the brain [14]. This is achieved by sensitizing the MR signal to the diffusion of the water molecules (protons). Specifically, the diffusion of the protons causes signal attenuation proportional to the apparent diffusion coefficient (D0 ) and the MR acquisition parameter known as the b-value. The b-value represents properties like the magnitude, duration and shape of the magnetic field gradients. Diffusion tensor imaging (DTI). By measuring the attenuated signal in at least six different directions, one can estimate the diffusion pattern of the protons in the three orthogonal Cartesian directions using a symmetric positive definite covariance matrix, the diffusion tensor. From the diffusion tensor, we can obtain maps of the most commonly used scalar measure of diffusion anisotropy at each voxel called fractional anisotropy (FA) which is the normalized standard deviation of the eigen values of the tensor in [0, 1]. Higher angular resolution diffusion imaging (HARDI). When DWI data is acquired in significantly more (≥ 30) number of diffusion directions and with large enough bvalues, the data can be modeled by a spherical Fourier transform which yields the so-called orientation distribution functions (ODFs) [25]. ODFs provide much higher resolution of diffusion directions compared to DTI. We can extract scalar measures at each voxel such as generalized fractional anisotropy (GFA) [25] from the ODFs which can then be used in analysis.
5.2. Statistical analysis on DWI Most neuroimaging studies acquire DWI data to perform follow-up statistical analysis. Assume that the images are are already registered to a common template. The scientific question may be to identify which regions of the brain vary across two groups of subjects: diseased and healthy. This can be answered by performing a hypothesis test at each voxel over the entire brain, and reporting the statistically significant ones as different across groups. Separately, one may want to identify regions which have a strong relationship with disease status. Independent of the specific setting, the classical analysis makes use a scalar-valued summary measure at each voxel: FA for DTI or GFA for HARDI. But this simplification, which makes the differential signal harder to detect, can be avoided. In DTI, the diffusion tensors lie on a P (3) manifold (i.e., the quotient space GL(3)/O(3)). In HARDI, the square root parameterization of the ODF lies on a unit Hilbert sphere (S ∞ ) [3], which in practice, is expressed as a l-th order spherical harmonics (we use l = 4 implying the S 14 setting). With the appropriate statistical models in hand, we may regress the manifold data directly against one or more independent variables.
5.3. Synthetic setting We first artificially generate ODF and DTI data via a generative multiple linear model. We then estimate using our MGLM framework and the model in [6] (certain adjustments to [6] were needed for the P (3) manifold). The results in Fig. 2 give strong evidence that when the characteristics of the data depends on multiple independent variables (e.g., disease and age), MGLM significantly outperforms linear geodesic regression (SLGR) which regresses y ∈ Y against x ∈ R. In Fig. 2, GR1 and GR2 refer to the estimates from SLGR using variables x1 and x2 individually. MGLM is able to estimate the true signal far more accurately compared to either GR1 and GR2. Fig. 3 shows the quantitative results (error) of regression using four independent variables as a function of sample sizes. As expected, we see that the fit improves significantly with MGLM.
5.4. Neuroimaging data evaluations We now present experiments using DWI data from two real neuroimaging studies. The first study investigates the neuroplasticity effects of meditation practice (e.g., for emotional well-being) on white matter. Meditators were trained in Buddhist meditation techniques, which lead to emotion regulation and attention control. An example scientific question here may be: what is the relationship between the number of years of meditation training on white matter when conditioned on age? Here, diffusion images in 48 non-collinear diffusion encoding directions were acquired, which after a sequence of pre-processing steps, provide the ODF representations for 23 long-term meditators (LTM)
Figure 2: MGLM and SLGR results using synthesized ODF and DTI. First two rows give the values for x1 and x2 of the generative model.
Figure 3: Plots showing the effect of sample size on mean squared error (MSE) and R2 for the MGLM as well as SLGR using the individual variables. GR{1, · · · , 4} refer to the estimates from SLGR using the individual variables x{1,··· ,4} individually. and 26 wait-list control (WLC) subjects. In the second study, we investigate the effect of a genotype risk factor (i.e., APOE4 positive or negative) in Alzheimer’s disease (AD) on white matter integrity in the brain. A scientific question here may be: what is the effect of age on white matter when we control for genotype and gender? Here, 40 encoding directions were acquired and images were obtained after pre-processing. The dataset covers 343 subjects (123 with APOE4+ and 220 with APOE4-). GLM results. We estimate the following model at each voxel for both studies, y = Exp(p, v 1 Group + v 2 Gender + v 3 Age),
(13)
where y ∈ P (3), Group ∈ {APOE4+, APOE4-} for ADrisk study and y ∈ S 14 , Group ∈ {LTM, WLC} for meditation study. Due to limited space, we only summarize results of ODF regression on the meditation data here (see results from AD-risk study in the extended version of the paper). As a baseline, we present regression results using FA as the measure of interest. We note that regressing y against one independent variable as in Fig. 3 is some possible baseline but because it is restricted, it cannot fit the full model in (13). Therefore, FA is a better baseline for comparisons. The null hypothesis, H0 , here is that the linear combination of ‘group’, ‘gender’ and ‘age’ has no effect on the y measurement. Therefore, (13) serves as the “full” model and the intercept alone serves as the nested model. Then, an F -statistic can yield voxel-wise p-value maps when we regress on FA. However, F -statistics are not applicable to ODF regression. So, to obtain p-values, we use 20, 000 per-
mutations to characterize the Null distribution of the R2 fit. Then, the unpermuted R2 is used to calculate the pvalues. Comparing the two p-value maps (FA vs. ODF) shows which procedure is successfully picking up more differential signal in a statistically sound manner. Fig. 4 shows the p-value maps, for FA and ODF based regression. We can observe the improved statistical sensitivity using the MGLM framework. Although neuroscientific interpretation of such results is outside the scope of this paper, the results from MGLM are more plausible since the statistically significant voxels follow white matter curvature more closely. This is expected because ODFs provide much higher resolution orientation information compared to DTI. We must point out that for this dataset, due to small sample size, MGLM or GLM do not pass the false discovery rate (FDR) threshold at q = 0.05. Nonetheless, the histograms of p values in Fig. 5 show that our MGLM is superior to univariate analysis on FA, even when the FA images are smoothed prior to testing (to increase normality). In summary, the experiments provide clear evidence that a full MGLM procedure on the actual manifold data (P (3) or S 14 ), offers significant and consistent improvements in sensitivity for statistical analysis in neuroimaging.
6. Conclusions This paper extends multivariate general linear model (MGLM) to the manifold setting. Such an extension allows regressing a manifold valued dependent variable y ∈ M against multiple independent variables, x ∈ X , a property which extends the applicability of existing meth-
Figure 4: (Left) p-value maps obtained using GLM (top) and MGLM (bottom) frameworks. GLM was performed using smoothed FA images while MGLM used ODF images. Voxels that satisfy p ≤ 0.05 are spatially more contiguous when performing MGLM. (Right) The thresholded p-value maps showing that the spatial extents in the brain stem (axial-left, sagittal-middle) and cerebellar (coronal-right) white matter are reduced when using MGLM.
Figure 5: Distribution of p-values obtained using MGLM using ODFs and GLM using both smoothed and unsmoothed FA images.
ods, and will allow practitioners to easily regress voxel measurements in diffusion weighted imaging against clinical variables, while controlling for nuisance parameters, thereby obtaining results which better reflect hypotheses under study. The experiments give strong evidence of the improvements we may expect over traditional alternatives. The paper is accompanied by an open source codebase, which will enable easy deployment in practice. Acknowledgments: This work was supported in part by NIH R01 AG040396; R01 AG037639; R01 AG027161; R01 AG021155; NSF CAREER award 1252725; NSF RI 1116584; Wisconsin Partnership Fund; UW ADRC P50 AG033514; UW ICTR 1UL1RR025011; a VA Merit Review Grant I01CX000165; NCCAM P01 AT004952-04 and the Waisman Core grant P30 HD003352-45. Collins was supported by a CIBM fellowship (NLM 5T15LM007359). The contents do not represent views of the Dept. of Veterans Affairs or the United States Government.
References [1] S.-I. Amari. Information geometry of the EM and EM algorithms for neural networks. Neural networks, 8(9):1379–1408, 1995. [2] G. Cheng and B. C. Vemuri. A novel dynamic system in the space of SPD matrices with applications to appearance tracking. SIAM J. on Imag. Sci., 6(1):592–615, 2013. [3] J. Cheng, A. Ghosh, T. Jiang, et al. A Riemannian framework for orientation distribution function computing. In MICCAI. 2009. [4] B. C. Davis, P. T. Fletcher, E. Bullitt, and S. Joshi. Population shape regression from random design data. IJCV, 90(2):255–266, 2010. [5] M. P. Do Carmo. Riemannian geometry. Springer, 1992.
[6] J. Du, A. Goh, S. Kushnarev, and A. Qiu. Geodesic regression on ODFs with its application to an aging study. NeuroImage, 13:1053– 8119, 2013. [7] B. Efron. Defining the curvature of a statistical problem (with applications to second order efficiency). Ann. of Stat., 1975. [8] P. T. Fletcher. Geodesic regression and the theory of least squares on Riemannian manifolds. IJCV, pages 1–15, 2012. [9] P. T. Fletcher, C. Lu, et al. Principal geodesic analysis for the study of nonlinear statistics of shape. IEEE TMI, 23(8):995–1005, 2004. [10] A. Goh. Estimation & processing of ODFs for HARDI. PhD thesis, 2010. [11] A. Goh and R. Vidal. Unsupervised Riemannian clustering of PDFs. In MLKDD, pages 377–392. 2008. [12] T. Jaakkola, D. Haussler, et al. Exploiting generative models in discriminative classifiers. NIPS, pages 487–493, 1999. [13] S. Jayasumana et al. Kernel methods on the Riemannian manifold of SPD matrices. In CVPR, pages 1–8, 2013. [14] D. Jones, A. Simmons, et al. Non -invasive assessment of axonal fiber connectivity in the human brain via DT-MRI. MRM, 42:37–41, 1999. [15] H. Karcher. Riemannian center of mass and mollifier smoothing. Comm. pure and applied math., 30(5):509–541, 1977. [16] S. Kurtek, E. Klassen, Z. Ding, et al. A novel Riemannian framework for shape analysis of 3D objects. In CVPR, 2010. [17] J. D. Lafferty. The density manifold and configuration space quantization. Trans. American Math. Soc., 305(2):699–741, 1988. [18] G. Lebanon. Riemannian geometry and statistical machine learning. PhD thesis, 2005. [19] J. M. Lee. Introduction to smooth manifolds. Springer, 2012. [20] M. I. Miller. Computational anatomy: shape, growth, and atrophy comparison via diffeomorphisms. NeuroImage, 23:S19–S33, 2004. [21] C. Rao. Information and accuracy attainable in the estimation of statistical parameters. Bull. Calcutta Math. Soc., 37(3):81–91, 1945. [22] M. Rosenthal, W. Wu, E. Klassen, and A. Srivastava. Spherical regression models using projective linear transformations. Journal of American Statistical Association, 2013. [23] X. Shi, M. Styner, et al. Intrinsic regression models for manifoldvalued data. pages 192–199, 2009. [24] J. Sun, Y. Xie, et al. Dictionary learning on the manifold of square root densities and application to reconstruction of diffusion propagator fields. In IPMI, pages 619–631, 2013. [25] D. Tuch. Q-ball imaging. MRM, 52(6):1358–1372, 2004. [26] L. Wasserman. All of statistics: a concise course in statistical inference. Springer, 2004. [27] Z. Zhang, E. Klassen, A. Srivastava, et al. Blurring-invariant Riemannian metrics for comparing signals and images. In ICCV, 2011.