Human Serum Using the Jaffé Reaction ... tomated kinetic method based on the Jaffé reaction is the ..... it suggests a model with two components for both sam-.
Multiway Calibration for Creatinine Determination in Human Serum Using the Jaffe´ Reaction M ARCOS V. GUTERRES, PEDRO O. L. VOLPE, and M A´ RCIA M . C. FERREIRA* Department of Physical Chemistry, Institute of Chemistry, Universidade Estadual de Campinas, SP,13083-970, Brazil
Second-order calibration and m ultivariate spectroscopic-kinetic measurements in the visible region are proposed to improve the Jaffe´ method for crea tinine assay. Analyses performed on synthetic mixtures containing bilirubin, glucose, and albumin con rm that second-order calibration is useful for creatinine determination in human seru m. Quantitative determinations of creatinine with the parallel factor analysis (PARAFAC) and direct trilinear decomposition (TLD) methods were com pared. It is shown that both methods can be used for creatinine determination in human seru m, with an SEP (squared error of prediction) of 2.22 and coef cient of variability of 6.14% for PARAFAC , and an SEP of 2.38 and coef cient of variability of 6.57% for TLD. Index Headings: Second-order calibration; Parallel factor anaylsis; PARA FAC; Creatinine assay; Jaffe´ reaction.
INT RODUCTIO N In hospital laboratories, creatinine determination is generally performed using the Jaffe´ reaction. This is based on the reaction that takes place in an alkaline medium between creatinine and picric acid to form an orange-red compound, which can be measured spectrophotometrically at 500 nm. Unfortunately, the Jaffe´ reaction exhibits low speci city for creatinine determination due to side-reactions that take place between picric acid and other species present in human serum, such as glucose, proteins, bilirubin, and a-ketoacids. Many procedures have been proposed to improve the speci city of the Jaffe´ reaction, including adsorption with Fuller’s earth,1 extraction, 2 and dialysis.3 There also exist alternative m ethods, such as 3–5 dinitrobenzoate reagent,4 liquid chromatography,5 and enzymic reactions.6,7 However, the automated kinetic m ethod based on the Jaffe´ reaction is the most popular means of improving creatinine assay. In fact, this is the m ethod generally used in clinical routine practice, although it is not free of interference. 8–10 Kinetic methods generally use a xed two-point or xed single-point method for quantitative analyses.10 Nevertheless, with advances in instrumentation for simultaneous multivariate detection, such as diode array spectrophotometers, multivariate kinetic methods can be investigated with the goal of improving the speci city of creatinine assay. Second-order calibration techniques have been demonstrated to be powerful methods for extracting qualitative and quantitative information from three-way data arrays such as m ultivariate spectroscopic-kinetic measurements with diode array spectrophotometers.11–13 The advantage of second-order calibration is that quantitative analysis can be performed in the presence of unknown Received 22 April 2003; accepted 25 August 2003. * Author to whom correspondence should be sent.
54
Volume 58, Number 1, 2004
interferents (second-order advantage), because mathematical m ethods like parallel factor anaylsis (PARAFAC ) or direct trilinear decom postion (TLD), used for secondorder calibration, are capable of resolving the underlying pro les and the relative concentrations of each component in the system. Consequently, only a sm all number of standards of the analyte are required for analysis.14 In this paper, a new modi cation of the Jaffe´ m ethod is proposed for the determination of creatinine in human serum. The methodology explores a multivariate kineticspectroscopic three-way data set and three-way methods for quantitative analysis. The results obtained show that this methodology is effective for creatinine determination in human serum in the presence of other substances that can interfere with conventional methods based on the Jaffe´ reaction. TH EORY Notation. Boldface letters represent matrices (upper case) and column vectors (lower case), such as X and x. Underlined boldface uppercase letters, e.g., X, represent multiway arrays. Scalars are represented by italic lowercase letters, such as x and a. Transposition of a matrix is symbolized by a superscripted ‘‘T’’, X T , and indices for matrix and vector dimensions are indicated by italic lowercase letters, such as i, j, and k. Trilinear M odels. Multivariate kinetic monitoring of the Jaffe´ reactions with diode array spectrophotometers produces two-way data recorded in I wavelengths and J time points for each sample. Since in chemical analysis there are K samples consisting of calibration samples and unknown m ixture samples, an I 3 J 3 K three-way data array X is obtained (Fig. 1). A trilinear model for threeway data array has the form:
Oa b c R
x i jk 5
r51
ir
jr
kr
1 e i jk
(1)
where x ijk is an element of X, with i 5 1, . . . I, j 5 1, . . . J, and k 5 1, . . . K. R de nes the number of components for the three modes of X; a ir, b jr, and c kr are elements of the vectors a r , b r , and c r, respectively; and e ijk is an element of the residual array E. Vector a r is the UV-Vis spectral pro le for the r th component, b r is the temporal concentration pro le for the rth component, and c r is the relative concentration for the r th component in the K samples. In matrix notation, Eq. 1 can be written as: X 5 A (C (
B) T 1 E
(2)
where ( denotes the Khatri–Rao product,15 and X and E are I 3 JK m atrices obtained by m atricizing the three 0003-7028 / 04 / 5801-0054$2.00 / 0 q 2004 Society for Applied Spectroscop y
APPLIED SPECTROSCOPY
F IG . 1.
Three-way array and trilinear models.
way array.16 A 5 (a 1 , a 2, . . . , a R ), B 5 (b 1, b 2 , . . . , b R ), and C 5 (c 1 , c 2 , . . . , c R ) denote the loadings that describe the spectroscopic, kinetic, and sample modes, respectively. In three-way analysis, the X array is decomposed into unique sets of factors that correspond to the pro les of the compounds in spectroscopic, kinetic, and sample modes (Fig. 1). The most comm only used methods for three-way analysis are PARAFAC and TLD. PAR AFAC uses an iterative algorithm called alternating least squares (ALS) to calculate A, B, and C.17 The algorithm starts with an initial guess for B and C, and then A is estimated by a least-squares procedure in which the following function: RSS 5 f (X, A, B, C ) 5 \ X 2 A(C (
B) T \
2 F
(3)
is m inimized. Next, B and C are similarly updated. The algorithm proceeds iteratively in cycling steps in which A, B, and C are alternately updated until convergence is reached. Convergence is achieved when the criterion in Eq. 4 is satis ed:
)
)
RSS m 2 RSS m 2 1 #« RSS m 2 1
(4)
where RSS is the residual sum of squares de ned in Eq. 3 and m is the actual number of iterations. If some properties of the pro les in A, B, and C are known, then this information can be included in PAR AFAC models in the form of param eter constraints. For example, a non-negativity constraint is usually used for spectroscopic data 18 because absorbance measurements should be positive if a proper blank is used. Also, it is possible to x parameters when the pro les are known in advance.19 A constrained PARAFAC model can improve the estimated loadings and help to ensure that they have physical and chemical meaning. There are several kinds of constraints that can be included in PAR AFAC models. A m ore detailed description and algorithms to calculate constrained m odels can be found elsewhere in the literature.17,20 Direct trilinear decomposition (TLD) estimates the param eters of the trilinear m odel using a non-iterative procedure based on the QZ algorithm by solving a generalized eigenvalue and eigenvector problem. 21 TLD is faster than PARAFAC , but the latter is usually preferable in practice for its favorable statistic properties, such as estimation of parameters in the least-squares sense and the possibility of including m odel constraints. Other methods for tting trilinear m odels can be found elsewhere in the literature. 22,23 Second-O rder Calibration. Second-order calibration as used in this work is composed of the following steps: rst, decomposition of the three-way data array X, con-
taining standard and unknown samples, is perform ed by the PARAFAC or TLD method. Next, the vector column c *r in m atrix C related to the analyte of interest (creatinine) is identi ed. The vector c*r containing the relative concentrations of creatinine in the standard samples is regressed against a vector c r (for creatinine) containing the known concentration of standards. The equation developed by tting c *r versus c r is used to predict the concentration of creatinine in the unknown sample. To obtain a correct trilinear model, it is necessary to determine the number of components in the model. The method adopted in this paper is the core consistency diagnostic, as described by Bro and Kier. 24 Visual inspection of the residuals and the calculation of the residual sum of squares (RSS), de ned in Eq. 3, was also used for determining the number of components. EXPERIMENTAL Apparatus. Spectra were recorded using a diode array spectrophotometer (m odel 8453A, Hewelett Packard, Palo Alto, CA) equipped with a cell holder for temperature control (set at 30 8C). Reagents and samples were mixed manually in plastic cuvettes with a 10-mm path length. The solution temperature was controlled by water circulating from a constant-temperature water bath. Data were recorded by an on-board computer and transferred to a m icrocom puter equipped with an AM D 850 MHZ processor. All calculations were performed using the software M ATLAB, version 6 (M athworks, Natick, MA). 25 The PARAFAC programs were written inhouse. TLD and non-negativity constraint programs were obtained from the N-Way Toolbox software, version 2.0. 26 Reagents. All chemicals were of analytical-reagent grade. Creatinine and albumin (Fraction V) were obtained from Sigm a. Bilirubin was from Acros Organics, and hydrochloridic acid, sodium hydroxide, and glucose were from Merck. All aqueous solutions were prepared with distilled and deionized water that was further puri ed by a M illi-Q high pure water device (Millipore, Bedford, MA). A creatinine 1 g L 2 1 stock solution was prepared by dissolving 0.1 g in 100 m L of 0.1 m ol L 2 1 of HCl solution, and working standard solutions were made by suitable dilution of the stock solution. Working alkaline picrate reagents were prepared by dissolving 0.75 m mol of picric acid in 25 m L of water and 5 mL of 5 M NaOH solution, and then diluting to 50 m L with puri ed water. Fresh solutions were prepared daily. A 200 m g L 2 1 stock standard solution of bilirubin was prepared by dissolving 20 mg of bilirubin in 1 mL of dimethyl sulfoxide and 3 m L of a solution of 0.1 mol L 2 1 sodium carbonate, and then diluting to 100 mL. Synthetic mixtures (see Table I) were prepared by dissolving the reagents glucose and albumin in 5 m L of puri ed water from Milli-Q, adding bilirubin and creatinine in suitable volumes from its stock solution, and then diluting to 10 mL with puri ed water. Determination of Creatinine in Synthetic M ixtures and Human Serum. We added 0.5 mL of the synthetic mixture or hum an serum or standard solution of creatiAPPLIED SPECTROSCOPY
55
TABLE I. Concentrations of the synthetic mixtures. A total of 40 mixture samples were prepared. For each mixture set, creatinine was prepared at 5 concentration levels (5, 15, 25, 35, 45 mg L 2 1 ). Set
Creatinine (mg L 2 1 )
Albumin (m g L 2 1 )
Bilirubin (mg L 2 1 )
Glucose (m g L 2 1 )
1 2 3 4 5 6 7 8
5–50 5–50 5–50 5–50 5–50 5–50 5–50 5–50
50 000 80 000 50 000 20 000 50 000 80 000 50 000 50 000
··· ··· 50 10 10 10 50 10
··· ··· ··· 1000 1000 1000 1000 2000
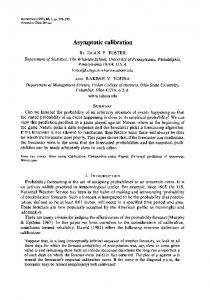
nine to plastic cuvettes containing 1 mL of deionized water. To this solution, 1 mL of alkaline picrate reagent was added, so the nal volume in the cuvette was always 2.5 mL. The start of the reaction was taken as the time when the last drop of the alkaline picrate reagent was added to the cuvette. Acquisition of data started 20 s after the initiation of the reaction by recording the spectra from 450 to 600 nm at regular intervals of 1 nm and every 2 s up to 300 s. Absorbances were measured against the reaction mixture blank. All solutions and reagents used in the experiments were incubated for 30 min at 30 8C. Reference M ethod for Creatinine Determination. Six samples of human serum were analyzed in an automatic analyzer Roche/Hitachi 917 in the clinical laboratory hospital that supplied the serum samples. Creatinine concentration was determined by a kinetic two-point method using rate-blanking and compensation. 27 The concentration of picric acid used was 25 mmol L 2 1 and sodium hydroxide was 200 mm ol L 2 1. RESULTS AND DISCUSSION The Jaffe´ reaction is well known, and there are different methodologies based on the kinetic m ethod.10 Usually, these m ethods use a concentration of picric acid between 5 and 30 mm ol L 2 1 and a hydroxide concentration of up to 0.5 mol L 2 1. Under these conditions, picric acid is in excess and the kinetic behavior of creatinine is pseudo- rst order. Figure 2 shows the variation of the absorbance versus time at 500 nm for the set of standard solutions of the creatinine under the conditions used in this work. The concentration of picric acid is 6 m mol L 2 1 and that of sodium hydroxide is 200 mmol L 2 1 . The temperature of reaction and reagents is maintained at 30 8C. The mechanism of the pseudo- rst order for creatinine reaction was con rmed by the initial rates method. 28 The kinetic constant was determined by a nonlinear least-squares t of the absorbance curves using a kinetic rst-order function. The mean value obtained for 5 replicates of the standard solutions at concentration levels of 10, 20, 40, and 60 m g L 2 1 was 6.2 3 10 2 3 s2 1 , except for 60 mg L 2 1 , at which a mean value of 6.4 3 10 2 3 s 2 1 was obtained. The absorbance varies linearly with creatinine concentration in the range investigated. Figure 3 shows the linear t for different wavelengths (490, 500, 520, 540, and 560 nm), where DA is the difference between absorbances measured at xed times (20 s and 180 s). 56
Volume 58, Number 1, 2004
F IG . 2. Variation of absorbance vs. time for standard solutions of creatinine at a wavelength of 500 nm. Concentration levels correspond to 10, 20, 40, and 60 mg L 2 1 .
The results obtained for the experimental conditions chosen for this work are in good agreement with previous works in the literature, 29 con rming that these experimental conditions are appropriate for creatinine determination in human serum. Creatinine Determination in Synthetic M ixtures. Quantitative experiments were carried out using the synthetic mixtures given in Table I. For each set of mixtures in Table I, ve samples containing different levels of concentration for creatinine over the range 5–50 mg L 2 1 were prepared. A total of 40 samples were prepared. Albumin, bilirubin, and glucose are endogenous substances present in human serum and can interfere with creatinine determination based on the Jaffe´ reaction at the concentrations used. 10 It is assumed that these substances interfere only in the spectral measurem ent. Later we will show that high concentrations of albumin can affect the kinetic constant for the creatinine–picric acid reaction, introducing small deviations from the trilinear structure. Nevertheless, the
F IG . 3. Fit of the curve DA ( 180 – 20 s) vs. concentration for creatinine standard solutions at wavelengths of 490, 500, 520, 540, and 560 nm.
F IG . 4.
Experimental data for a representative mixture sample.
prediction errors obtained with trilinear m odels are acceptable for creatinine determination in human serum. The analysis of each sample from Table I was performed using an X array consisting of three standard solutions of pure creatinine with concentrations of 10, 20, and 40 mg L 2 1 and the sample itself. The dimension of the X array was 122 3 139 3 4, where the respective modes are wavelengths with regular intervals of 1 nm over the range 480 –600 nm; time, with regular intervals of 2 s between 20 and 300 s; and samples. Figure 4 shows a three-dimensional plot for one of the samples of set 4 in Table I. Decomposition of X in trilinear models was performed by the TLD or PARAFAC method (constrained and unconstrained m odels). PARAFAC was initiated with random values to check the convergence of the m odel from different starting points. The loadings of the TLD model were also tested for initialization, and the results were similar to the initialization with random values. The convergence criterion used for all experiments was set to 10 2 6 . In the constrained PARAFAC model, the values for the estimated concentrations of the interferents (m atrix C, Eq. 2) in the standard samples were xed to zero because only creatinine is present in standard solutions. Figure 5 shows a typical result from the core consistency diagnostic used to determine the number of components in the PARAFAC models for binary and quaternary m ixtures. For binary mixtures, a model with two components is expected because both creatinine and alTABLE II. RMSEP values calculated with 5 levels (5, 15, 25, 35, 45 mg L 2 1 ) of the creatinine concentration on synthetic m ixtures.
F IG . 5. Core consistency diagnostic for binary (upper two plots) and quaternar y mixtures (lower two plots). (Left) Result for a model with two components. (Right) Result for a model with three components.
bumin react with the alkaline picrate reagent and form compounds that absorb in the visible region of the analysis. Bilirubin does not react with alkaline picrate reagent but does absorb in the wavelength region analyzed, and the probable number of components for ternary and quaternary mixtures is three. For glucose, spectral absorbance was not observed in the visible region analyzed, but this substance can interfere with creatinine determination because the background color of alkaline picrate reagent decreases due to the reduction of the picrate to a stable, colorless intermediate.10 Nevertheless, the core consistency diagnostic shows the same behavior for the binary and quaternary mixtures as shown in Fig. 5 and it suggests a model with two components for both samples. Further analysis of the number of components for TLD and PAR AFAC m odels was performed by residual sum of the squares (RSS, Eq. 3) and by a visual examination of the residuals (E). It was observed that the models with three components have a residual sum of squares smaller than those with two components. However, it was found that two-component models are more suitable than those with three or more components because in the latter the pro les for creatinine are poorly estimated. Moreover, the residuals for both models (two or three components) are randomly distributed, which indicates that two components are indeed appropriate for modeling the data. TABLE III. Predictions from creatinine concentration levels in human serum samples using different three-way methods. Concentrations are in mg L 2 1 .
Set
TLD
PARAFAC
Const. PARAFAC
Sample
Reference
TLD
PARAFAC
Const. PARAFAC
1 2 3 4 5 6 7 8
0.53 0.80 0.52 0.41 0.50 0.53 0.55 0.47
0.53 0.78 0.48 0.40 0.49 0.55 0.50 0.47
0.36 0.44 0.52 0.15 0.26 0.56 0.77 0.38
1a 2a 3a 4a 5b 6a
7.30 74.00 9.80 16.90 97.20 11.90
5.89 76.04 7.47 15.64 100.12 10.86
6.04 77.14 7.60 16.24 99.82 10.82
7.10 79.18 8.02 16.00 97.60 10.96
a b
Two component models. Three component models.
APPLIED SPECTROSCOPY
57
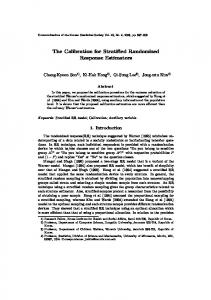
F IG . 7. L2 1.
Spectral pro les: (a) albumin 50 g L 2 1, (b) bilirubin 10 mg
7). Furthermore, it was observed that the kinetic pro les for the second component vary slightly from experiment to experiment due to changes in the mixture composition. The errors of prediction (RMSEP), calculated according Eq. 6 for two-component models, are excellent for both the TLD and PARAFAC models, as shown in Table II: æ ç
RMSEP 5 ç ç
è
F IG . 6. Comparison of the pure spectral and kinetic pro les of creatinine with the estimated loadings for a two-component PARAFAC model.
In fact, models with three or m ore components are dif cult to t by PARAFAC methods because m any iterations (more than 2500) are necessary in the ALS algorithm, and in several cases, convergence is not achieved until 5000 iterations. Also, it was observed that the loadings for three-com ponent PAR AFAC models are highly correlated in the kinetic and spectral m odes and degenerate solutions were obtained. On the other hand, when using two components, the ALS algorithm usually converged after approximately 600 iterations for the unconstrained and before 200 iterations for the constrained PARAFAC model. For all samples, good predictions were obtained with tw o-com po nent m od els and the estim ated loadin gs, which represent the pure spectral and kinetic pro les of the creatinine, are in accordance with the pure pro les. An example for a generic sample (from set 7, Table I) is shown in Fig. 6. The estimated pro le for the second component is probably due to the combined contributions of albumin and bilirubin, between which it was not possible to distinguish. These two compounds exhibit very similar spectra in the wavelength range considered (Fig. 58
Volume 58, Number 1, 2004
O (c 2 cˆ ) i
N
i
2 ö1 / 2 ÷
÷ ø ÷
(6)
where c i is the true concentration of creatinine in sample I, and cˆ i is the estimated concentration value. N is the number of samples ( ve for each set shown in Table I). The errors of prediction are not the same for the different mixtures in Table I, and this is in uenced by composition. The errors increase for higher concentrations of album in because the kinetic constants of creatinine change slightly with a high concentration level of albumin. A PARAFAC m odel was tted with a three-way array form ed by the ve samples of set 1 (Table I). The estimated kinetic constant for creatinine reaction with picric acid in this model was 6.4 3 10 2 3 , which is close to the constant for standard solutions of creatinine. However, for the ve samples of set 2 (Table I), the estimated constant is 7.3 3 10 2 3. In this situation, the kinetic pro les of creatinine are slightly different between the standard samples and m ixtures, indicating that the data deviate from the trilinear structure. However, this error is considered to be sm all and acceptable for creatinine determination in serum. The best prediction results were obtained by the PARAFAC constrained models, except in set 7, for which the prediction error was surprisingly high. Creatinine Determination on H uman Serum. Six samples of human serum were used for creatinine determination using second-order calibration. The analysis was perform ed exactly as for the synthetic m ixtures. The results of the proposed m ethod are compared with those from the clinical laboratory in the hospital that supplied the serum samples. The hospital laboratory used an automated kinetic m ethod based on the Jaffe´ reaction. Except for sample 5, all other samples were t with trilinear m odels with two components. The estimated
TABLE IV . Statistical parameters for predictions in Table III.
SEP CV
TLD
PARAFAC
Const. PARAFAC
2.38 6.57
2.22 6.14
2.51 6.92
The error of prediction (SEP) 30 and the coef cient of variability (CV) 30 indicated in Table IV for both threeway methods are reasonable for creatinine determination in human serum. In clinical analysis, a 10% error is acceptable for creatinine determination by the kinetic Jaffe´ method. The unconstrained PARAFAC model gave a lower error of prediction, contrary to the results obtained for the synthetic m ixtures, but in this case the error was calculated using the concentrations predicted by the kinetic Jaffe´ method and not the true concentrations, as in the synthetic m ixtures. Although the PARAFAC model gave a lower error of prediction, this is not necessarily the best model for creatinine determination because TLD is computationally faster than PAR AFAC and could be m ore appropriate for routine analyses that require a large number of assays to be performed in a short time. CONCLUSION
F IG . 8. Spectral and kinetic pro les estimated with (a) a two-component PARAFAC model and (b) a three-component PARAFAC model for the analysis of sample 5 of the human serum .
loadings were in excellent agreement with both the pure spectral and kinetic pro les for creatinine. Good predictions were obtained for these samples (Table III). For sample 5, models with both two and three components presented highly correlated loadings, but for this sample it was found that models with three components gave better estimates than those with two components. Figure 8 shows a comparison between the loadings from twoand three-component PAR AFAC models with the true spectral and kinetic pro les of creatinine. Table III shows the prediction for concentration of creatinine in sample 5 using models with three components. Sample 5 has a creatinine concentration that is much higher than the usual value in hum an serum, which can indicate a possible renal failure. In this situation, it is likely that others substances are also present in high concentrations and in this case, the third component tries to model some interferent compound that probably reacted with picric acid. However, the identity of the third component is not known.
Second-order calibration is an appropriate method for creatinine assay based on the Jaffe´ reaction because it allows quanti cation even when there are unknown substances present in human serum that interfere with creatinine analysis. Further developments are necessary to the automatic determination of the optimum number of components for the three-way models. Another possibility would be to use the recently developed methods for three-way analysis that are insensitive to the number of factors included in the m odel. These methods are under investigation in our laboratory. Furthermore, it was found that the composition of the samples affects the errors of prediction due to deviations from a trilinear structure in the data. Problems with deviations of the trilinearity are more dif cult to handle with the mathematical methods available, but the proposed experimental methodology could be modi ed to perform a standard addition methodology to minimize the deviations due to the effect of the sample composition. ACK NOW LEDGM ENTS The authors acknowledge Dr. S. P. Gurden for his valuable suggestions and the State of Sa˜ o Paulo Research Foundation (FAPESP) for nancial support through Project No. 14985-9.
1. R. Haeckel, R. H. Gandsden, S. E. Sherwin, P. D. Spare, P. Tarallo, O. Houot, E. J. Vankampem, and W. Burgi, Clin. Chem. 27, 179 (1981). 2. H. H. Taussky, Clin. Chim. Acta 1, 210 (1956). 3. A. K. Chasson, H. J. Grady, and M . A. Stanley, Am. J. Clin. Pathol. 35, 83 (1961). 4. A. C. Parekh and C. Sims, Clin. Chem. 23, 2066 (1977). 5. M . C. Gennaro, C. Abrigo, E. M arengo, and C. Baldin, Analyst (Cambridge, U.K.) 120, 47 (1995). 6. M . E. Collison and M. E. Meyerhoff, Anal. Chim. Acta 200, 61 (1987).
APPLIED SPECTROSCOPY
59
7. M . Jurkiewicz, S. Alegret, J. Almirall, M. Garc‡´a, and E. Fa` bregas, Analyst (Cambridge, U.K.) 123, 1321 (1998). 8. J. A. Weber and A. P. van Zanten, Clin. Chem. 37, 695 (1991). 9. D. L. Fabiny and G. Ertingshausen, Clin. Chem. 17, 696 (1971). 10. L. D. Bowers and E. T. Wong, Clin. Chem. 26, 555 (1980). 11. A. M. Antunes, M . M. C. Ferreira, M . S. Melgo, and P. L. O. Volpe, J. Mol. Struct. 481, 563 (1999). 12. A. Juan, M. Maeder, M. Mart‡´nez, and R. Tauler, Chemom. Intell. Lab. Syst. 54, 123 (2000). 13. A. Quinn, P. J. Gemperline, B. Baker, M. Zhu, and D. S. Walker, Chemom. Intell. Lab. Syst. 45, 199 (1999). 14. E. Sanchez and B. R. Kowalski, J. Chemom. 2, 247 (1988). 15. C. G. Khatri and C. R. Rao, Sankhya˜ 30 A, 167 (1968). 16. H. A. L. Kiers, J. Chemom. 14, 105 (2000). 17. R. Bro, ‘‘Multi-Way Analysis in the Food Industry’’, Ph.D. Thesis, Amsterdam, The Netherlands, 1998, p. 20. 18. R. Bro and N. D. Sidiropoulos, J. Chemom. 12, 223 (1998). 19. S. P. Gurden, J. A. Westerhuis, S. Bijlsma, and A. K. Smilde, J. Chemom. 15, 101 (2001).
60
Volume 58, Number 1, 2004
20. 21. 22. 23. 24. 25. 26. 27. 28. 29. 30.
H. A. L. Kiers and A. K. Smilde, J. Chemom. 12, 125 (1998). E. Sanchez and B. R. Kowalski, J. Chemom. 4, 29 (1990). H.-L. Wu, M. Shibukaw a, and K. Oguma, J. Chemom. 12, 1 (1998). N. K. M . Faber, R. Bro, and P. K. Hopke, Chemom. Intell. Lab. Syst. 65, 119 (2003). R. Bro and H. A. L. Kiers, J. Chemom. 17, 274 (2003). M atlab t for Windows Version 6.1 (The MathWorks, Natick, MA, 2001). C. A Anderson and R. Bro, Chemom. Intell. Lab. Syst. 52, 1 (2000). A. Foster-Swanson, M. Swartzentruber, and P. Roberts, Clin. Chem. 1994, Abstract No. 361. K. A. Connors, Chemical kinetics: the study of reactions rates in solution (VCH Publishers, Inc., New York, 1990), p. 28. H. L. Pardue, B. L. Bacon, M. G. Nevius, and J. W. Skoug, Clin. Chem. 33, 278 (1987). P. C. Williams, Near-Infrared Technology in the Agricultural and Food Industries (American Association of Cereal Chemists, St. Paul, MN, 1987), Chap. 7, p. 143.