Music Instrument Estimation in Polyphonic Sound Based on Short-Term Spectrum Match Wenxin Jiang1 , Alicja Wieczorkowska2 , and Zbigniew W. Ra´s1 ,2 1
2
University of North Carolina, Department of Computer Science, Charlotte, NC 28223, USA Polish-Japanese Institute of Information Technology, Koszykowa 86, 02-008 Warsaw, Poland
[email protected],
[email protected],
[email protected]
Summary. Recognition and separation of sounds played by various instruments is very useful in labeling audio files with semantic information. This is a non-trivial task requiring sound analysis, but the results can aid automatic indexing and browsing music data when searching for melodies played by user specified instruments. In this paper, we describe all stages of this process, including sound parameterization, instrument identification, and also separation of layered sounds. Parameterization in our case represents power amplitude spectrum, but we also perform comparative experiments with parameterization based mainly on spectrum related sound attributes, including MFCC, parameters describing the shape of the power spectrum of the sound waveform, and also time domain related parameters. Various classification algorithms have been applied, including k-nearest neighbor (KNN) yielding good results. The experiments on polyphonic (polytimbral) recordings and results discussed in this paper allow us to draw conclusions regarding the directions of further experiments on this subject, which can be of interest for any user of music audio data sets.
1 Introduction Recently, a number of acoustical features for the construction of a computational model for music timbre estimation have been investigated in Music Information Retrieval (MIR) area. Timbre is a quality of sound that distinguishes one music instrument from another, since there are a wide variety of instrument families and individual categories. It is rather a subjective quality, defined by ANSI as the attribute of auditory sensation, in terms of which a listener can judge that two sounds, similarly presented and having the same loudness and pitch, are different [1], [2]. Such definition is clearly subjective and not of much use for automatic sound timbre classification, although the footnote to the definition gives hints towards physical timbre description, stating that the timbre depends primarily upon the spectrum of the stimulus,
2
Wenxin Jiang, Alicja Wieczorkowska, and Zbigniew W. Ra´s,
but also upon the waveform, the sound pressure, the frequency location of the spectrum, and the temporal characteristics of the stimulus [2], [5]. Still, musical sounds must be very carefully parameterized to allow automatic timbre recognition. So far, there is no standard parameterization used as a classification basis. The sound descriptors applied are based on various methods of analysis in time domain, spectrum domain, time-frequency domain and cepstrum, with Discrete Fourier Transform (DFT) for spectral analysis being most common, e.g. Fast Fourier Transform (FFT), and so on. Also, wavelet analysis gains increasing interest for sound and especially for musical sound analysis and representation. Researchers explored different statistical summations to describe signatures of music instruments based on vectors or matrices in features, such as Tristimulus parameters, brightness, irregularity of the spectrum etc. [6], [14], [21]. Flattening these features for traditional classifiers increases the number of features. In [16] authors used a new set of features jointly with other popular features used in music instrument identification. They built a database of music instrument sounds for training a number of classifiers. These classifiers are used by MIRAI system to identify music instruments in polyphonic sounds. MIRAI is designed as a web-based storage and retrieval system which can automatically index musical input (of polyphonic, polytimbral type), transforming it into a database, and answer queries requesting specific musical pieces, see http://www.mir.uncc.edu/. When MIRAI receives a musical waveform, it divides this waveform into segments of equal size and then the classifiers incorporated into the system identify the most dominating musical instruments and emotions associated with that segment. A database of musical instrument sounds describing about 4,000 sound objects by more than 1,100 features is associated with MIRAI. Each sound object is represented as a temporal sequence of approximately 150-300 tuples which gives a temporal database of more than 1,000,000 tuples, each one represented as a vector of about 1,100 features. This database is mainly used to train classifiers for automatic indexing of musical instrument sounds. It is semantically reach enough (in terms of successful sound separation and recognition) so the constructed classifiers have a high level of accuracy in recognizing the dominating musical instrument and/or its type when music is polyphonic. Unfortunately, the loss of information on non-dominant instruments by the sound separation algorithm, due to the overlap of sound features, may significantly lower the recognition confidence of the remaining instruments in a polyphonic sound. This paper shows that by identifying a weighted set of dominating instruments in a sequence of overlapping frames and using a special voting strategy, we can improve the overall confidence of the indexing strategy for polyphonic music, and the same improve the precision and recall of MIRAI retrieval engine.
Title Suppressed Due to Excessive Length
3
2 Sound Parameterization for Automatic Classification Purposes Sound wave can be described as a function representing amplitude changes in time. For digitally recorded sound, this function is quantized in time and in amplitude. Sampling rate describes how many values are recorded per time unit, and binary resolution in multi-bit recording describes how many bits are used to represent quantized amplitude axis, for each channel. Standard setting for CD for sampling rate is 44,100 samples per second, i.e. 44.1 kHz, with 16bit resolution for amplitude, i.e. with 216 quantization levels. Obviously, such data are not well suited to perform automatic classification, so usually sound parameterization is performed before further experiments on audio databases. There are numerous ways the sound can be parameterized. Audio data can be parameterized in time domain, in frequency domain, and time-frequency features can also be extracted. Parameterization can be based on Fourier analysis, particularly on amplitude spectrum, on cepstral analysis, also on wavelet analysis, and so on; various features can be extracted to describe the results of these analyzes [3], [4], [7], [8], [9], [11], [13], [19], [22]. In our research, we decided to base mainly on direct observation of sound spectrum (see Section 4), but we also performed experiments based on the following sound features [8], [22]: •
• •
•
• •
AudioSpectrumBasis - MPEG-7 descriptor, representing low-dimensional projection of a high-dimensional spectral space, to aid compactness and recognition [8]. AudioSpectrumBasis is a matrix derived from the SVD (singular value decomposition) of a power spectrum in normalized dB scale, i.e. in log scale with maximal value defining 0 dB. In our research, frequency axis for AudioSpectrumBasis was divided into 32 bands, with 1/4-octave resolution for 8 octaves; octave distance means doubling the fundamental frequency, i.e. the pitch of the sound. AudioSpectrumP rojection - projection of AudioSpectrumBasis [8], AudioSpectrumF latness - MPEG-7 parameter, calculated in our research for spectrum divided into 32 frequency bands, i.e. with 1/4-octave resolution for 8 octaves, and the length of this 32-element vector is added as 0th element of this 33-dimensional feature; if there is a high deviation from a flat spectral shape for a given band, it may signal the presence of tonal components [8], M F CC = {mf ccn : 1 ≤ n ≤ 13} - cepstral coefficients in mel scale; feature originating from speech processing, but also used for music analysis [12], [17]. 13 coefficients were used (the 0th one and the next 12), for 24 mel frequency scale hearing filters, using Julius software [10], HamonicP eaks = {HamoP kn : 1 ≤ n ≤ 28} - sequence of the first 28 local peaks of harmonics (in normalized dB scale) for a given frame T emporalCentroid - time instant where the energy of the sound is focused, calculated as energy weighted mean of the sound duration,
4
•
•
• • •
•
•
• •
Wenxin Jiang, Alicja Wieczorkowska, and Zbigniew W. Ra´s,
LogSpecCentroid - AudioSpectrumCentroid from MPEG-7 standard [8]; this parameter represents the gravity center of a log-frequency power spectrum, LogSpecSpread - AudioSpectrumSpread descriptor from MPEG-7 [8]; calculated as RMS (Root Mean Square) value of the deviation of the power spectrum in log frequency scale with respect to the gravity center in a frame, Energy - energy of spectrum, averaged through all frames of the sound, ZeroCrossings - zero-crossing rate, i.e. number of sign changes of the wave form in a frame, averaged through all frames of the sound, SpecCentroid - calculated as HarmonicSpectralCentroid from MPEG7, representing power-weighted average of the frequency of the bins in the linear power spectrum, and averaged over all the frames of the steady state of the sound, SpecSpread - calculated as HarmonicSpectralSpread from MPEG-7, describing the amplitude-weighted standard deviation of the harmonic peaks of the spectrum, normalized by the instantaneous HarmonicSpectralCentroid and averaged over all the frames of the steady state of the sound, RollOf f - averaged (over all frames) frequency below which an experimentally chosen percentage of the accumulated magnitudes of the spectrum is concentrated, F lux - difference between the magnitude of the amplitude spectrum points in a given and successive frame, averaged through the entire sound, LogAttackT ime - decimal logarithm of the sound duration from the time instant when the signal starts, to the time when it reaches its maximum value, or when it reaches its sustained part, whichever comes first.
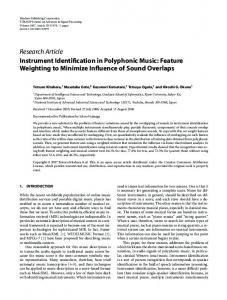
3 Polyphonic Sound Estimation Based on Sound Separation and Feature Extraction The traditional way of pattern recognition in music sound is to extract features from raw signals in digital form, usually recorded as a sequence of integer samples representing quantized values of amplitude of a sound wave in consequent time instants. By feature extraction, the acoustic characteristics such as pitch and timbre are described by smaller and more structured dataset which is further fed to traditional classifiers to perform estimation. In case of polyphonic sounds, sound separation can be applied to extract the signal which is identified as one specific instrument at timbre estimation process. Then timbre estimation can be applied again on the residue of the signal to get other timbre information. Fig. 1 shows the process of music instrument recognition system based on feature extraction and sound separation. However, there are two main problems in this method. First of all, overlapping of the features make it difficult to perform timbre estimation and sound
Title Suppressed Due to Excessive Length
5
Polyphonic Sound Get pitch Feature extraction
FFT
Pitch Estimation
Classifier
Get spectrum
Timbre Estimation Sound separation
Get Instrument
New spectrum
Power Spectrum
Fig. 1. Flow chart of music instrument recognition with sound separation
separation. Secondly, during the classification process, only one instrument is picked up from all candidates, which makes the estimation inaccurate. 3.1 Overlapping of the Features Both in Temporal and Spectral Space Feature based datasets are easier and more efficient to work with classifiers, however, there is usually information loss during the feature extraction process. Feature is the abstract or compressed representation of waveform or spectrum, such as harmonic peaks, MFCC (Mel Frequency Cepstral Coefficients), zero-crossing rate, and so on. In the case of monophonic music sound estimation tasks with only singular non-layered sounds, the features can be easily extracted and identified. However, this is not the case in polyphonic, polytimbral sound. It is difficult or even often impossible to extract distinct clear features representing single instrument from polyphonic sound, because the overlapping of the signals and their spectra, especially when instruments have the similar patterns in their features space. 3.2 Classification with Single Instrument Estimation for Each Frame The traditional classification process usually gives single answer, representing one class; in our case, it would be the name of instrument playing in an analyzed sample. In such a case, when only the best answer, i.e. the name of
6
Wenxin Jiang, Alicja Wieczorkowska, and Zbigniew W. Ra´s,
one (the only one or dominating) instrument playing for each frame of music sound is given, then information about other possibly contributing instruments is lost. In fact, it is common for the polyphonic music sound to have multiple instruments playing simultaneously, which means that in each frame, there are representations of multiple timbres existing in the signal. Providing one only candidate leads to obtaining predominant timbre while ignoring other timbre information. And also, there could be no dominating timbre in each frame, when all instruments play equally loud. This means that classifier has to randomly choose one of the equally possible candidates. In order to find solution to this problem, authors introduce the Top-N winner strategy which gives multiple candidates for each evaluated frame.
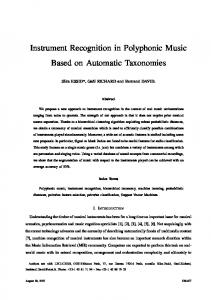
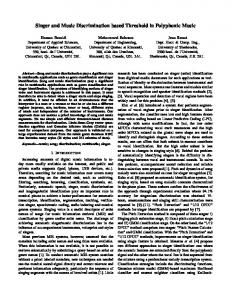
4 Pattern Detection Directly from Power Spectrum The fact that discriminating one instrument from another depends on more details from raw signals leads to another way of pattern recognition: directly detecting distinct patterns of instruments based on lower representation of signal, such as power spectrum. Fig. 2 shows two different ways of pattern recognition.
Fig. 2. Two different methods of pattern recognition
Title Suppressed Due to Excessive Length
7
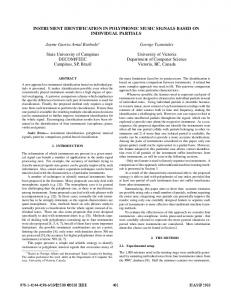
Since spectrum is very useful for timbre representation purposes, we propose the new strategy of instrument estimation based on short term power spectrum match. 4.1 Sub-Pattern of Single Instrument in the Mixture Sound Segment Figure 3 shows the power spectrum of trumpet, piano and the mixture of those two instruments. As we can see, the spectrum of mixture preserves part of the pattern of each single instrument.
Fig. 3. Power spectrum of trumpet, piano and their mixture; frequency axis is in linear scale, whereas amplitude axis is in log [dB] scale
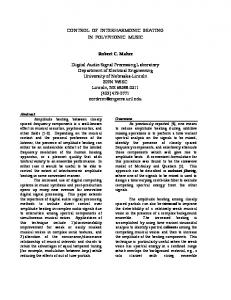
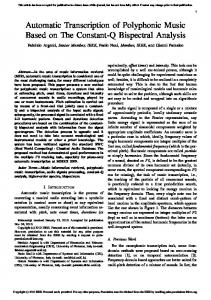
The same similarity of properties of the spectra is also observed e.g. for flute, trombone and their mixture, as Figure 4 shows. In order to index the polyphonic sound, we need to detect the instrument information in each small slice of music sound. Such detection is rather not feasible directly in time domain. Therefore, in our experiments, we have observed the short term spectrum space. This has been calculated via short time
8
Wenxin Jiang, Alicja Wieczorkowska, and Zbigniew W. Ra´s,
Fig. 4. Power spectrum of flute, trombone and their mixture
Fourier transform (STFT). Figure 5 shows another example of the spectrum slice for flute and trombone and their mixture sound. Each slice is 0.04 seconds long. As Figure 5 shows, the power spectrum patterns of single flute and single trombone can still be identified in mixture spectrum without blurring with each other (as marked in the figure). Therefore, we do get the clear picture of distinct pattern of each single instrument when we observe each spectrum slice of the polyphonic sound wave. 4.2 Classification Based on Power Spectrum Pattern Match In order to represent accurately the short term spectrum with high resolution in frequency axis, allowing more precise pattern matching, long analyzing frame with 8192 numeric samples was chosen. Fourier transform performed on these frames describes frequency space for each slice (or frame). Instead of parameterizing the spectrum (or time domain) and extracting a few dozens
Title Suppressed Due to Excessive Length
9
Fig. 5. Sub-patterns of single instruments in the mixture sound slice for flute, trombone, and their mix
of features to represent sound, we decided to work directly on the power amplitude spectrum values (points). When a new sound is analyzed with a goal to find what instrument or instruments contributed to create this sound, even though their spectra overlap, we can still try to find the closest vectors from the training data set of singular sounds and discover which instrument sounds they represent. The traditional classification models such as decision trees, Naive Bayesian classifiers, and neural networks do not perform well in this case. It is because there are too many attributes (8192 numeric attributes) for those classifiers
10
Wenxin Jiang, Alicja Wieczorkowska, and Zbigniew W. Ra´s,
to yield good classification models, and also any classification model itself stands for some sort of abstraction, which is in conflict with any information preserving strategy. However, one of the most fundamental and simple classification methods, K Nearest Neighbor algorithm, needs no prior knowledge about the distribution of the data and it seems to be an appropriate classifier for numeric spectrum vectors.
5 Top-N winners from classification model As opposed to the traditional pattern matching or classification process, which uses classification model to choose the one with the highest confidence as the estimation result, we do not get the ”best answer” for an evaluated frame. Instead, we choose the multiple candidates from classification model according to the confidence measure. As it was already discussed, we know that the classifier during the classification process compares pattern from each frame with standard instrument patterns in a training database. Since there are several different sub-patterns existing in the spectrum, classifier will assign the confidence to each recognized pattern. This way, we may identify which N matches have the highest confidence levels. They are our top N winners. Thus, at each frame we get n instruments Ii with the confidence level Ci and save them to the candidates pool for the voting process. After evaluating all the frames, we get weights for all the candidates from the candidates pool by adding up their confidences, and the final voting proceeds according to the weights Wj of each instrument. The following is the pseudo-code for the Top-N winners procedure: For each frame from the sound Get power spectrum by STFT For each candidate Xi from top-N winners of classifiers If Xi exists in candidates pool then Confidence[x] += Ci Else Add Xi into candidates pool Confidence[x] = Ci End If End For End For Select Top m candidates from candidates pool Some noise coming from errors occurred during the single frame estimation process could be minimized in terms of the whole music context. By keeping the original acoustical information of the music sound, we are getting much higher recognition rate for multiple instruments in polyphonic sound. Here are the steps of pattern matching process: 1. Use STFT and Hamming window to extract power spectrum for each 0.04s frame for all the standard single instrument sounds.
Title Suppressed Due to Excessive Length
11
2. Save these spectra in a training database; since there is overlapping of 2/3 of frame length for Hamming window, the number of items in the dataset actually almost triples for each sound. 3. During the estimation process, use KNN to do the vector distance measure (8192 points) and decide which frame in the training dataset is the most similar to the unknown sound frame; when we give multiple matches, the multiple instrument candidates are saved for the overall weights calculation. Fig. 6 shows the new music instrument recognition system which has been developed with the strategy of Top-N winners based on short-term spectrum matching.
Polyphonic Sound
Training data Get frame
Timbre Estimation FFT
Power Spectrum
Classifier Get Instrument Candidates
Finish all the Frames Get Final winners
Voting process
estimation
Fig. 6. Flow chart of music instrument recognition system with new strategy
6 Experiment of Top-N-winners strategy Based on Short Term Spectrum Matching To simplify the problem, we only performed tests on the middle C instrument sounds, i.e. for pitch equal to C4 in MIDI notation, of frequency 261.6 Hz (for A4 tuned to 440 Hz). The training subset including 3323 objects has been selected from the entire training database. Each object is represented by the frame-wise (0.04 seconds) power spectrum extracted by short time Fourier transform from the following 26 single instrument sounds:
12
Wenxin Jiang, Alicja Wieczorkowska, and Zbigniew W. Ra´s,
Electric Guitar, Bassoon, Oboe, B-flat Clarinet, Marimba, C Trumpet, Eflat Clarinet, Tenor Trombone, French Horn, Flute, Viola, Violin, English Horn, Vibraphone, Accordion, Electric Bass, Cello, Tenor Saxophone, B-Flat Trumpet, Bass Flute, Double Bass, Alto Flute, Piano, Bach Trumpet, Tuba, and Bass Clarinet. To compare the results with the traditional feature based classification strategy, we have also extracted the following 5 groups of both temporal and spectral features (calculated for spectrum divided into 33 frequency bands), mainly originating from the MPEG-7 standard [8], [20], [22], and used decision tree classifier to perform the timbre estimation: Group1: BandsCoef f icient = {bandsCoefn : 1 ≤ n ≤ 33} - coefficients for 33 AudioSpectrumF latness bands. Group2: P rojections = {prjn : 1 ≤ n ≤ 33} - AudioSpectrumP rojection from MPEG-7, Group3: M F CC = {mf ccn : 1 ≤ n ≤ 13} Group4: HamonicP eaks = {HamoP kn : 1 ≤ n ≤ 28} Group5: Other Features: • • • • • • • • • • •
•
T emporalCentroid, LogSpecCentroid, LogSpecSpread, Energy, ZeroCrossings, SpecCentroid, SpecSpread, RollOf f , F lux, bandsCoef Sum - AudioSpectrumF latness bands coefficients sum, prjmin, prjmax, prjsum, prjdis, prjstd - minimum, maximum, sum, distance, and standard deviation of AudioSpectrumP rojection calculated for AudioSpectrumBasis. Distance represents a dissimilarity measure: distance for a matrix is calculated as sum of absolute values of differences between elements of each row and column. Distance for a vector is calculated as the sum of dissimilarity (absolute difference of values) of every pair of coordinates in the vector, LogAttackT ime.
52 polyphonic audio files have been mixed (using Sound Forge sound editor [18]) from 2 of those 26 instruments sound. These mixture audio files have been used as test files. The system uses MS SQLSERVER2005 database to store training dataset and K nearest neighbor algorithm as the classifier. When the polyphonic sound is submitted to system, it provides several estimations as the final candidate answers. In our experiment, we gave 4 estimations for each submitted audio file.
Title Suppressed Due to Excessive Length
13
The performance of our algorithm was measured using recognition rate R, calculated as R = P/A where P is the positive response, i.e. the number of the correct estimations, and A is the actual number of instruments existing in the polyphonic sound. For comparison purpose, five experiments were performed independently. We applied feature-based sound separation strategy and we used a decision tree type classifier in our first two experiments. In experiment 1, only one candidate was chosen by a classifier for each frame. In the first step of experiment 2, top n candidates (with n = 2) were chosen by a classifier for each frame. In its second step, for each candidate, the confidences over all the frames were added to get the overall score used to identify the final n winners. In the remaining three experiments, we applied a new strategy of spectrum match based on KNN classifier. In experiment 3, we used KNN (k = 1) to choose the top 2 candidates as the winners for each frame. In experiment 4, we increased k from 1 to 5. In experiment 5, we ruled out the percussion instrument objects from the testing audio files, since they have less clear patterns in the spectrum envelope. Table 1. Recognition rate of music instrument estimation based on various strategies experiment #
description
Recognition Rate
1
Feature-based and separation + Decision Tree (n=1)
36.49%
2
Feature-based and separation + Decision Tree (n=2)
48.65%
3
Spectrum Match + KNN(k=1;n=2)
79.41%
4
Spectrum Match + KNN(k=5;n=2)_ Spectrum Match + KNN(k=5;n=2) without percussion instrument_
82.43%
5
87.1%
From the results shown in Table 1, we get the following conclusions: 1. Using the multiple candidates for each frame yields better results than using single winner strategy. 2. Spectrum-based KNN classification improves the recognition rate of polyphonic sounds significantly. 3. Some percussion instrument (such as vibraphone, marimba) are not suitable for spectrum-based classification, but most instruments generating harmonic sounds work well with this new strategy.
7 Conclusion We have provided a new solution to an important problem of instrument identification in polyphonic music: The loss of information on non-dominant
14
Wenxin Jiang, Alicja Wieczorkowska, and Zbigniew W. Ra´s,
instruments during the sound separation process due to the overlapping of sound features. The new strategy is to directly detect sub-patterns from short term power spectrum, which is relatively lower-level and at the same time more efficient representation of the raw signals, instead of usually a few dozens (or maximally hundreds) of features, most often used for instrument recognition purposes. Next, we choose the multiple candidates from each frame during the frame-wise classification based on similarity of the spectrum, and weight them based on their possibility over all the sound period to get the more accurate estimation of multiple instruments which are playing simultaneously in the music piece. This approach also avoids extracting more compact feature patterns of multiple instruments from polyphonic sounds, which is difficult and inaccurate because of the information-loss during the abstraction process. Our experiments show that the sub-patterns detected from the power spectrum slices contain sufficient information for the multiple-timbre estimation tasks and improve the robustness of instrument identification as well. Acknowledgments This work was supported by the National Science Foundation under grant IIS0414815, and also by the Research Center of PJIIT, supported by the Polish National Committee for Scientific Research (KBN). We are grateful to Dr. Xin Zhang for many helpful discussions we had with her and for the comments she made which improved the quality and readability of the paper.
References 1. Agostini G, Longari M, Pollastri E. (2001) Content-Based Classification of Musical Instrument Timbres. International Workshop on Content-Based Multimedia Indexing 2. American National Standards Institute (1973) American national standard: Psychoacoustical terminology. ANSI S3.20-1973 3. Aniola P, Lukasik E (2007) JAVA Library for Automatic Musical Instruments Recognition. AES 122 Convention, Vienna, Austria 4. Brown JC (1999) Computer identification of musical instruments using pattern recognition with cepstral coefficients as features. J.Acoust.Soc.Am. 105, 1933– 1941 5. Fitzgerald R, Lindsay A (2004) Tying semantic labels to computational descriptors of similar timbres. Sound and Music Computing’04 6. Fujinaga I, McMillan K (2000) Real Time Recognition of Orchestral Instruments. International Computer Music Conference 7. Herrera P, Amatriain X, Batlle E, Serra X (2000) Towards instrument segmentation for music content description: a critical review of instrument classification techniques. International Symposium on Music Information Retrieval ISMIR 8. ISO/IEC JTC1/SC29/WG11 (2004) MPEG-7 Overview. Available at http: //www.chiariglione.org/mpeg/standards/mpeg-7/mpeg-7.htm
Title Suppressed Due to Excessive Length
15
9. Kaminskyj I (2002) Multi-feature Musical Instrument Sound Classifier w/user determined generalisation performance. Proceedings of the Australasian Computer Music Association Conference ACMC, 53–62 10. Kawahara T, Lee A, Kobayashi T, Takeda K, Minematsu N, Sagayama S, Itou K, Ito A, Yamamoto M, Yamada A, Utsuro T, K. Shikano K (2000) Free software toolkit for Japanese large vocabulary continuous speech recognition. Proc. Int’l Conf. on Spoken Language Processing (ICSLP) , Vol. 4, 476–479 11. Kitahara T, Goto M, Okuno H G (2005) Pitch-Dependent Identification of Musical Instrument Sounds. Applied Intelligence 23, 267-275, Springer 12. Logan B (2000) Mel Frequency Cepstral Coefficients for Music Modeling. Proceedings of the First International Symposium on Music Information Retrieval ISMIR 2000 13. Martin K D, Kim Y E (1998) Musical instrument identification: A patternrecognition approach. 136-th meeting of the Acoustical Society of America, Norfolk, VA 14. Pollard, H.F., Jansson, E.V. (1982) A Tristimulus Method for the Specification of Musical Timbre. Acustica, 51: 162–171 15. Ras Z, Wieczorkowska A, Lewis R, Marasek K, Zhang C, Cohen A, Kolczynska E, Jiang M (2008) Automatic Indexing of Audio With Timbre Information for Musical Instruments of Definite Pitch, http://www.mir.uncc.edu/ 16. Ras Z, Zhang X, Lewis R (2007) MIRAI: Multi-hierarchical, FS-tree based Music Information Retrieval System (Invited Paper). In: Kryszkiewicz M, Peters J, Rybinski H, Skowron A (eds), Rough Sets and Intelligent System Paradigms, International Conference RSEISP 2007, Proceedings. Springer, LNAI 4585, 80– 89 17. Saha G, Yadhunandan U (2004) Modified Mel-Frequency Cepstral Coefficient. Proceedings of the IASTED 2004 18. Sonic Foundry (2003) Sound Forge. Software 19. Wieczorkowska A (2000) Towards Musical Data Classification via Wavelet Analysis. In: Ras, Z.W., Ohsuga, S. (eds.): Foundations of Intelligent Systems. Proc. ISMIS’00, Charlotte, NC, USA, LNCS/LNAI, Vol. 1932, Springer-Verlag 292–300 20. Wieczorkowska A, Ras Z, Zhang X, Lewis R (2007) Multi-way Hierarchic Classification of Musical Instrument Sounds. In: S. Kim S, Park J, Pissinou N, Kim T, Fang W, Slezak D, Arabnia H, Howard D (eds) International Conference on Multimedia and Ubiquitous Engineering MUE 2007, Seoul, Korea. IEEE Computer Society, Los Alamitos Washington Tokyo 21. Wold E, Blum T, Keislar D, Wheaten, J (1996) Content-based classification, search, and retrieval of audio. Multimedia, IEEE 3(3): 27–36 22. Zhang X (2007) Cooperative Music Retrieval Based on Automatic Indexing of Music by Instruments and Their Types. PhD dissertation, The University of North Carolina at Charlotte, Charlotte