RE S EA RC H
AR TI CL E
Mutant Mice With Calcium-Sensing Receptor Activation Have Hyperglycemia That Is Rectified by Calcilytic Therapy Valerie N. Babinsky,1* Fadil M. Hannan,1,2* Reshma D. Ramracheya,1* Quan Zhang,1* M. Andrew Nesbit,1,3 Alison Hugill,4 Liz Bentley,4 Tertius A. Hough,4 Elizabeth Joynson,4 Michelle Stewart,4 Abhishek Aggarwal,5 Maximilian Prinz-Wohlgenannt,5 Caroline M. Gorvin,1 Eniko¨ Kallay,5 Sara Wells,4 Roger D. Cox,4 Duncan Richards,6 Patrik Rorsman,1 and Rajesh V. Thakker1 1
Radcliffe Department of Medicine, Oxford Centre for Diabetes, Endocrinology and Metabolism, University of Oxford, Oxford OX3 7LE, United Kingdom; 2Department of Musculoskeletal Biology, Institute of Ageing and Chronic Disease, University of Liverpool, Liverpool L7 8TX, United Kingdom; 3Biomedical Sciences Research Institute, Ulster University, Coleraine BT52 1SA, United Kingdom; 4Medical Research Council Mammalian Genetics Unit and Mary Lyon Centre, Medical Research Council Harwell Institute, Harwell Science and Innovation Campus, Oxfordshire OX11 0RD, United Kingdom; 5Department of Pathophysiology and Allergy Research, Medical University of Vienna, Vienna A-1090, Austria; and 6GlaxoSmithKline Clinical Unit, Cambridge CB2 0GG, United Kingdom The calcium-sensing receptor (CaSR) is a family C G-protein–coupled receptor that plays a pivotal role in extracellular calcium homeostasis. The CaSR is also highly expressed in pancreatic islet a- and b-cells that secrete glucagon and insulin, respectively. To determine whether the CaSR may influence systemic glucose homeostasis, we characterized a mouse model with a germline gain-offunction CaSR mutation, Leu723Gln, referred to as Nuclear flecks (Nuf). Heterozygous- (CasrNuf/+) and homozygous-affected (CasrNuf/Nuf) mice were shown to have hypocalcemia in association with impaired glucose tolerance and insulin secretion. Oral administration of a CaSR antagonist compound, known as a calcilytic, rectified the glucose intolerance and hypoinsulinemia of CasrNuf/+ mice and ameliorated glucose intolerance in CasrNuf/Nuf mice. Ex vivo studies showed CasrNuf/+ and CasrNuf/Nuf mice to have reduced pancreatic islet mass and b-cell proliferation. Electrophysiological analysis of isolated CasrNuf/Nuf islets showed CaSR activation to increase the basal electrical activity of b-cells independently of effects on the activity of the adenosine triphosphate (ATP)–sensitive K+ (KATP) channel. CasrNuf/Nuf mice also had impaired glucose-mediated suppression of glucagon secretion, which was associated with increased numbers of a-cells and a higher a-cell proliferation rate. Moreover, CasrNuf/Nuf islet electrophysiology demonstrated an impairment of a-cell membrane depolarization in association with attenuated a-cell basal KATP channel activity. These studies indicate that the CaSR activation impairs glucose tolerance by a combination of a- and b-cell defects and also influences pancreatic islet mass. Moreover, our findings highlight a potential application of targeted CaSR compounds for modulating glucose metabolism. (Endocrinology 158: 2486–2502, 2017)
ISSN Print 0013-7227 ISSN Online 1945-7170 Printed in USA This article has been published under the terms of the Creative Commons Attribution License (CC BY; https://creativecommons.org/licenses/by/4.0/), which permits unrestricted use, distribution, and reproduction in any medium, provided the original author and source are credited. Copyright for this article is retained by the author(s). Received 29 January 2017. Accepted 30 May 2017. First Published Online 2 June 2017
2486
https://academic.oup.com/endo
*These authors contributed equally to this study. Abbreviations: ADH, autosomal dominant hypocalcemia; ATP, adenosine triphosphate; Ca2+i, cytosolic calcium; Ca2+o, extracellular calcium; [Ca2+]o, extracellular calcium concentration; CaSR, calcium-sensing receptor; DAPI, 40 ,6-diamidino-2-phenylindole; EC50, half-maximal effective concentration; ELISA, enzyme-linked immunosorbent assay; FHH, familial hypocalciuric hypercalcemia; GFP, green fluorescent protein; GPCR, G-protein–coupled receptor; H&E, hematoxylin and eosin; HEK, human embryonic kidney; IP, intraperitoneal; IPGTT, intraperitoneal glucose tolerance testing; KATP channel, adenosine triphosphate–sensitive K+ channel; Nuf, Nuclear flecks; qRT-PCR, quantitative reverse transcription polymerase chain reaction; RRID, research resource identifier; TRP, transient receptor potential; VDCC, voltage-dependent Ca2+ channel; WT, wild-type.
Endocrinology, August 2017, 158(8):2486–2502
doi: 10.1210/en.2017-00111
doi: 10.1210/en.2017-00111
lucose homeostasis is tightly regulated by the joint actions of insulin and glucagon, which are secreted from the pancreatic islet b- and a-cells, respectively (1, 2). Diabetes mellitus is a bihormonal disorder that affects .330 million people worldwide and is characterized by reduced insulin secretion and aberrant glucagon secretion, which arises from alterations in islet function as well as mass (1, 2). G-protein–coupled receptors (GPCRs), which comprise the largest superfamily within the human proteome and are targeted by 40% of all currently approved drugs (3), facilitate the effects of diverse extracellular stimuli, ranging from fatty acids to neurotransmitters and gut hormones, on a- and b-cells and represent an exploitable target for the modulation of glucose homeostasis (4, 5). The extracellular calcium (Ca2+o)-sensing receptor (CaSR) is a family C GPCR that plays a key role in the parathyroid and renal regulation of Ca2+o homeostasis by coupling to intracellular signal transduction cascades that include the Gq/11-mediated stimulation of phospholipase C, which increases inositol 1,4,5-trisphosphate, thereby leading to a rapid rise in cytosolic calcium (Ca2+i) concentrations, and activating the mitogen-activated protein kinase pathway (6). The CaSR is also highly expressed in pancreatic islet a- and b-cells (7, 8), and studies involving isolated human islets and insulin-secreting cell lines have shown that activation of the CaSR following exposure to elevated Ca2+o concentrations or allosteric activators triggers transient stimulations of insulin and glucagon secretion, which were associated with upregulation of phospholipase C and mitogen-activated protein kinase–mediated signaling responses (8–10). Moreover, a study involving wild-type (WT) mice has demonstrated pancreatic islet CaSR expression to be associated with insulin secretion in vivo (11). However, the role of this GPCR in systemic glucose homeostasis is unclear. For example, one patient-based association study has reported a common coding region CaSR gene variant to be an independent determinant of plasma glucose concentrations (12), whereas another study of patients with familial hypocalciuric hypercalcemia (FHH), which is caused by germline lossof-function CaSR mutations, did not reveal any alterations in glucose tolerance or insulin secretion (13). However, it may be that gain-of-function CaSR mutations, which cause autosomal dominant hypocalcemia (ADH) (14), are associated with abnormalities of glucose homeostasis and not FHH-associated loss-of-function CaSR mutations. To investigate this possibility, we have evaluated glucose tolerance and pancreatic islet function in a mouse model for ADH due to a germline gain-of-function CaSR mutation, Leu723Gln, referred to as Nuclear flecks (Nuf) because the mouse was initially
G
https://academic.oup.com/endo
2487
identified to have cataracts (15, 16). Our analysis of these Nuf mice has demonstrated a role for the CaSR in glucose homeostasis.
Materials and Methods Animals All study animals were littermates aged between 20 and 28 weeks and kept in accordance with Home Office welfare guidance in an environment controlled for light (12 hours light and dark cycle), temperature (21°C 6 2°C), and humidity (55% 6 10%) at the Medical Research Council Harwell Centre. Mice had free access to water (25 ppm chlorine) and were fed ad libitum on a commercial diet (RM3; Special Diet Services, Essex, United Kingdom) that contained 1.24% calcium, 0.83% phosphorus, and 2948 IU/kg vitamin D. Nuf mice were maintained on the inbred 102/H background, which is a substrain bred at the Mary Lyon Centre (Harwell, United Kingdom) (15, 16). Animal studies were carried out in accordance with GlaxoSmithKline policy on the care, welfare, and treatment of animals, approved by the Medical Research Council Harwell Institute Ethical Review Committee, and licensed under the Animal (Scientific Procedures) Act 1986, issued by the UK Government Home Office Department (PPL30/2752).
Compounds Ronacaleret, which is also known as SB-751689, was provided by GlaxoSmithKline (London, United Kingdom) and dissolved in a 20% aqueous solution of 2-hydroxypropylb-cyclodextrin (catalog no. H107; Sigma-Aldrich, St. Louis, MO) prior to use in in vitro and in vivo studies.
Cell culture and transfection Human embryonic kidney (HEK) 293 cells were cultured in high-glucose Dulbecco’s modified Eagle medium (Invitrogen, Carlsbad, CA) supplemented with 10% fetal bovine serum, as described (17). WT (Leu723) and mutant (Gln723) CaSRpEGFP-N1 constructs were generated, as reported (16), and transiently transfected into HEK293 cells using Lipofectamine Plus (Invitrogen), as described (16). Successful transfection of WT and mutant CaSR proteins was confirmed by visualizing green fluorescent protein (GFP) fluorescence using an Eclipse E400 fluorescence microscope with an epifluorescence filter, and images were captured using a DXM1200C digital camera and NIS Elements software (Nikon, Tokyo, Japan), as described (17).
Measurement of Ca2+i responses The effect of ronacaleret on the Ca2+i responses of CaSRexpressing cells was assessed by a flow cytometry-based assay, as reported (17, 18). In brief, 48 hours after transfection, the cells were harvested, washed in calcium- and magnesium-free Hank’s balanced salt solution (Invitrogen), and loaded with 1 mg/mL indo-1-acetoxymethylester (Molecular Probes, Eugene, OR) for 1 hour at 37°C (17, 18). After the removal of free dye, the cells were resuspended in calcium- and magnesium-free Hank’s balanced salt solution and maintained at 37°C. Transfected cells were incubated with either a 20% aqueous solution of 2-hydoxypropyl-b-cyclodextrin (vehicle) or
2488
Babinsky et al
CaSR Activation in Mice Causes Hyperglycemia
ronacaleret at concentrations of 20 and 40 nM for 1 hour, as described (18). Flow cytometry was performed using a Beckman Coulter MoFlo XDP equipped with a JDSUY Xcyte ultraviolet laser and a Coherent Sapphire 488 laser with a 550LP dichroic mirror and 580/30 bandpass filter (17). Single cells were isolated and stimulated by sequentially adding calcium to increase the Ca2+o concentration ([Ca2+]o) in a stepwise manner from 0 to 15 mM. The baseline fluorescence ratio was measured for 2 minutes, the fluorescence ratio compared with the time was recorded, and data were collected for 2 minutes at each [Ca2+]o, as described (17, 18). Cytomation Summit software was used to determine the peak mean fluorescence ratio of the transient response after each individual stimulus, which was expressed as a percentage of normalized response (17, 18). Nonlinear regression of the concentration-response curves was performed with GraphPad Prism to calculate the half-maximal effective concentration (EC 50 ) responses for each separate experiment (17).
Effect of ronacaleret on the glucose tolerance of Nuf mice Ronacaleret (20 mg/mL) or drug vehicle was administered by twice daily oral gavage to mice over a 5-day period. The mice were then tested using the international mouse phenotyping consortium glucose tolerance test protocol (www.mousephenotype. org/impress/protocol/87/7). Briefly, mice were fasted for 16 hours, and a blood sample was obtained before intraperitoneal (IP) administration of a 2-g/kg glucose load. Subsequent blood samples were taken at 30, 60, and 120 minutes for plasma glucose and glucagon measurements or at 10, 20, and 30 minutes for plasma insulin measurements, as described (19).
Body composition analysis Fat and lean body mass of nonanesthetized live mice were measured using the Echo-MRI Analyzer system (Echo Medical Systems, Houston, TX), as described (20).
Islet insulin and glucagon secretion Pancreatic islets were isolated from whole mouse pancreata by collagenase digestion and separated from the suspension, as described (19). Islets were used for secretion experiments within 2 hours of isolation. Batches of 13 size-matched islets were incubated for 1 hour at 37°C in 0.3 mL of modified KrebsRinger buffer containing 2 mg/mL bovine serum albumin, 1.6 mM CaCl2, and 3 mM glucose, followed by a 1-hour incubation in 0.3 mL of the same Krebs-Ringer buffer supplemented with 1, 6, or 20 mM glucose, as described (21). A Krebs-Ringer buffer containing 0.8 mM CaCl2 was used to evaluate the effect of lowering the [Ca2+]o on islet hormone secretion. The supernatant was used for measurement of secreted insulin and glucagon, and islets were lysed in cold acid ethanol for measurement of insulin and glucagon content. Insulin and glucagon were determined by radioimmunoassay (Millipore UK Ltd, Livingstone, United Kingdom) or using a rat/ mouse insulin and glucagon duplex enzyme-linked immunosorbent assay (ELISA; Meso Scale Discovery, Rockville, MD).
Quantitative reverse transcription polymerase chain reaction Total RNA from isolated islets was extracted using an RNeasy Mini Kit (Qiagen, Hilden, Germany), and complementary DNA was generated by the Superscript II enzyme
Endocrinology, August 2017, 158(8):2486–2502
(Invitrogen), as described (19). QuantiTect primer assays were used to amplify selected genes (Arx, Ccnd2, Foxm1, Foxo1, Irx2, Nkx6, Pax4, Pax6, Pdx1, and Tcf7l2), which were analyzed by quantitative reverse transcription polymerase chain reaction (qRT-PCR) using SYBR Green (Qiagen) on the StepOnePlus qRT-PCR system (Life Technologies, Carlsbad, CA), as described (22). The DDCt method was used to calculate fold change alterations in gene expression, relative to a housekeeping panel comprising the Actb, Eef1b2, and Gapdh genes (22).
Biochemical analysis Blood samples were collected from the lateral tail vein of study mice following application of topical local anesthesia, as reported (23), or collected from the retro-orbital vein under isoflurane terminal anesthesia. Plasma was separated by centrifugation at 5000g for 10 minutes at 8°C and analyzed for calcium and albumin on a Beckman Coulter AU680 analyzer, as described (15). Plasma calcium was adjusted for variations in albumin concentrations using the formula: plasma calcium (mmol/L) – ([plasma albumin (g/L) – 30] 3 0.02), as reported (23). Plasma glucose concentrations were measured using an Analox GM9 analyzer, as described (19). Plasma insulin concentrations were measured using a rat/mouse insulin ELISA (Millipore, Billerica, MA), as described (19), and plasma glucagon concentrations were measured using a rat/mouse glucagon ELISA (Mercodia, Uppsala, Sweden).
Islet electrophysiology Electrical activity was measured from a- and b-cells within intact mouse islets using the perforated-patch technique, as described (24), and all measurements were obtained at 34°C. Islets were immobilized using a wide-bore glass suction pipette (24) and perfused with modified Krebs-Ringer solution (140 mM NaCl, 3.6 mM KCl, 1.5 mM CaCl2, 0.5 mM MgSO4, 10 mM HEPES, 0.5 mM NaH2PO4, and NaHCO3 at pH 7.4 with NaOH and glucose as indicated), as reported (25). A Krebs-Ringer solution containing 0.75 mM CaCl2 was used to evaluate the effect of lowering the [Ca2+]o on islet electrical activity. The solution within the pipet contained 76 mM K2SO4, 10 mM KCl, 10 mM NaCl, 1 mM MgCl2, and 5 mM HEPES (pH 7.35 using KOH) (24). To perforate the cell membrane, amphotericin B (6 mg/mL) was added to the intracellular buffer. The conductance of the b-cell adenosine triphosphate (ATP)– sensitive K+ (KATP) channel within intact islets was measured using the perforated patch-clamping technique following exposure to different glucose concentrations or to tolbutamide (24). During the KATP channel conductance studies, b-cells were held at –70 mV, and K+ currents were evoked by exposing the cells to alternating 50 ms pulses of –60 or –80 mV (25). Islet cell types were established by their electrical activity in response to glucose, and cells that were electrically active at 1 mM glucose were identified as a-cells (26). Furthermore, b-cells were distinguished from non-b-cells by the absence of a voltage-gated Na+ current when a transient pulse from –70 to 0 mV was applied (21). Measurements were undertaken in individual islets using an EPC-10 patch-clamp amplifier (HEKA Electronics, Ludwigshafen/Rhein, Germany) and Pulse software (version 8.50), as described previously (24).
Islet area analysis Mouse pancreata were fixed in 10% neutral buffered formalin, mounted longitudinally, and paraffin embedded, as
doi: 10.1210/en.2017-00111
described (19). Serial sections (4.5 mm) were cut, and every 10th section stained with hematoxylin and eosin (H&E), as described (19). Images of $10 H&E-stained sections per mouse were acquired at a 320 magnification using the semiautomated TissueFax slide-scanning microscope (TissueGnostics, Vienna, Austria), as described (27). Islets were identified, and islet area, size, and number were quantified using HistoQuest software (TissueGnostics) (27). Islet area was normalized to the total section area and to body weight, and islet size was calculated by dividing the total islet area per section by the number of islets on the same section.
Islet immunohistochemistry Immunohistochemistry was undertaken using paraffinembedded pancreatic sections that had been subjected to heat-induced epitope retrieval in citrate buffer (pH 6.0), followed by blocking in 10% donkey serum for 1 hour. Primary antibodies used for insulin, glucagon, and Ki-67 staining were guinea pig anti-insulin (1:200; ab7842, Abcam [research resource identifier (RRID): AB_306130]), rabbit anti-glucagon [1:200; ab92517, Abcam (RRID: AB_10561971)], and rabbit anti-Ki67 [1:500; ab15580, Abcam (RRID: AB_443209)], respectively. Secondary antibodies used were donkey anti–guinea pig [706-225-148, Cy2, Jackson (RRID: AB_2340467)] 1:100 and donkey anti-rabbit [711-165-152, Cy3, Jackson (RRID: AB_2307443)] 1:500 in phosphate-buffered saline. Sections were mounted in ProLong Gold Antifade Reagent containing 40 ,6-diamidino-2-phenylindole (DAPI; Life Technologies). Images of whole sections were acquired using the TissueFax slidescanning microscope (TissueGnostics), as described (27). Quantification of immunofluorescence signals was undertaken using the semiautomated intensity detection function of the TissueQuest software (TissueGnostics), as described (27). The numbers of a- and b-cells within individual islets were quantified using the cell-based analysis profile of the TissueQuest software (27), normalized to the total islet area, and reported as percentage of the mean numbers of Casr+/+ a- and b-cells, respectively.
Statistical analysis The in vitro studies involved two separate transfection experiments and eight to nine technical assays. Statistical comparisons of the EC50 responses were undertaken using the F test (17, 18). For the in vivo and ex vivo studies, the Mann-Whitney U test was used to compare differences between two groups, and the Kruskal-Wallis test was used to compare multiple groups. An unpaired Student t test was used to compare groups with small sample sizes (n , 5), as reported (28). All analyses were undertaken using GraphPad Prism (GraphPad), and a value of P , 0.05 was considered significant for all analyses.
Results Nuf mice have impaired glucose tolerance that is ameliorated by a CaSR allosteric modulator To establish whether the gain-of-function CaSR mutation in Nuf mice may be associated with alterations in glucose homeostasis, IP glucose tolerance testing (IPGTT) was performed on WT (Casr+/+), heterozygous- (CasrNuf/+), and homozygous-affected (CasrNuf/Nuf) mice aged 20 to
https://academic.oup.com/endo
2489
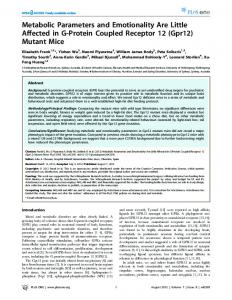
28 weeks that had been fasted for 16 hours. Plasma glucose concentrations were measured at 0, 30, 60, and 120 minutes following an IP 2-g/kg glucose bolus injection. Male and female CasrNuf/+ and CasrCasrNuf/Nuf mice had elevated plasma glucose concentrations at 30 and 60 minutes, which were significantly (P , 0.01) greater than those of respective Casr+/+ mice [Fig. 1(a) and 1(b)]. The impaired glucose tolerance was not associated with any alterations in body weight or in fat or lean mass (Supplemental Fig. 1). To test whether the impaired glucose tolerance of Nuf mice may be associated with abnormalities of insulin secretion in vivo, an IPGTT was conducted with plasma samples collected for insulin measurement at 0, 10, 20, and 30 minutes. Plasma insulin concentrations of male and female Casr+/+ mice increased twofold at 10 minutes after an IP 2 g/kg glucose bolus injection [Fig. 1(c) and 1(d)]. However, male affected CasrNuf/+ and CasrNuf/Nuf mice showed significantly reduced plasma insulin concentrations at 10 and 20 minutes following glucose administration [Fig. 1(c)], whereas only female CasrNuf/Nuf mice showed significantly reduced insulin concentrations at 20 minutes [Fig. 1(d)] compared with respective Casr+/+ mice. Affected male CasrNuf/Nuf mice were also shown to have an inadequate suppression of plasma glucagon concentrations at the 30minute time point during a 120-minute IPGTT [Fig. 1(e)], whereas female CasrNuf/Nuf mice had significantly raised plasma glucagon concentrations at 120 minutes [Fig. 1(f)]. No significant differences in the glucose, insulin, or glucagon responses were noted between male and female mice (Supplemental Fig. 2). To investigate if the impaired glucose tolerance of Nuf mice, which have the Leu723Gln gain-of-function CaSR mutation, could be corrected by a selective CaSR negative allosteric modulator (i.e., calcilytic agent), we assessed the in vitro and in vivo effects of ronacaleret, a calcilytic compound (29). For the in vitro studies, HEK293 cells were transiently transfected with WT (Leu723) or mutant (Gln723) CASR-pEGFP-N1 constructs, which express the CaSR protein fused to the N terminus of enhanced GFP (16), and the effect of ronacaleret on the responses of Ca2+i concentrations to alterations in [Ca2+]o was assessed. HEK293 cells expressing the mutant Gln723 CaSR [Fig. 2(a)] were shown to have a leftward shift of the concentration-response curve [Fig. 2(b)], with a significant reduction in EC50 (2.63 6 0.08 mM) compared with WT (2.92 6 0.06 mM; P , 0.01) [Fig. 2(c)], consistent with a gain-of-function, as reported (16). A dose titration of ronacaleret revealed 20 and 40 nM concentrations of this calcilytic compound to normalize the EC50 values and shift in the concentration-response curve of mutant Gln723-expressing cells [Fig. 2(b) and 2(c)]. Glucose has recently been reported to lead to allosteric
2490
Babinsky et al
CaSR Activation in Mice Causes Hyperglycemia
Endocrinology, August 2017, 158(8):2486–2502
Figure 1. Plasma glucose, insulin, and glucagon concentrations during IPGTT testing. (a) Male and (b) female CasrNuf/+ (blue) and CasrNuf/Nuf mice (red) are significantly hyperglycemic compared with respective Casr+/+ mice (black) during a 2-hour IPGTT. (c) Male and (d) female CasrNuf/Nuf mice and male CasrNuf/+ mice have significantly reduced plasma insulin concentrations compared with respective Casr+/+ mice during a 30-minute IPGTT. (e) Male and (f) female CasrNuf/Nuf mice show significant elevations in plasma glucagon concentrations compared with respective Casr+/+ mice during a 2-hour IPGTT. Results are expressed as mean 6 standard error of the mean. *P , 0.05, **P , 0.01, and ***P , 0.001 compared with Casr+/+ mice at respective time points.
activation of the CaSR (30), and we investigated the effect of alterations in glucose concentrations on the Ca2+i responses of WT and Nuf mutant Gln723 CaSRs, which were stably expressed in HEK293 cells (Supplemental Fig. 3). Our findings showed that altering the glucose concentration from 3 to 25 mM had no effect on the EC50
values of cells stably expressing WT or Nuf mutant Gln723 CaSRs, whereas the addition of 40 nM ronacaleret significantly increased the EC50 values of these cells (Supplemental Fig. 3). To determine whether amelioration of CaSR gain-of-function by ronacaleret may lead to an improvement in glucose tolerance in vivo, we
doi: 10.1210/en.2017-00111
https://academic.oup.com/endo
2491
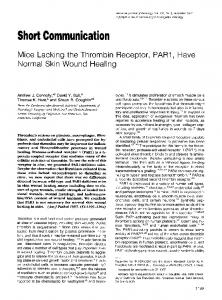
Figure 2. Effect of ronacaleret on the CaSR gain-of-function and hypocalcemia of Nuf mice. (a) Fluorescence microscopy of HEK293 cells transiently transfected with WT Leu723 or mutant (m) Gln723 CASR-pEGFP-N1 constructs. GFP expression in these cells indicates successful transfection and expression by these constructs. Bar indicates 10 mm. (b) Effect of ronacaleret treatment on the intracellular calcium responses of the Gln723 CaSR mutant. The Gln723 CaSR mutant led to a leftward shift in the concentration-response curve (solid red line) compared with the WT (Leu723) CaSR (solid black line). The addition of ronacaleret (Rona) at 20- and 40-nM concentrations rectified the leftward shift of the Gln723 CaSR mutant (blue dashed line and green dashed line, respectively). The zoomed-in image shows the concentration-response curves at the EC50 values of the WT and mutant CaSRs. (c) Effect of 20 and 40 nM ronacaleret on the EC50 values of the Gln723 CaSR mutant. (d) Male and (e) female CasrNuf/+ and CasrNuf/Nuf mice were significantly hypocalcemic compared with respective Casr+/+ mice. Treatment with 90-mg/kg ronacaleret significantly increased plasma calcium concentrations in Casr+/+, CasrNuf/+, and CasrNuf/Nuf mice compared with respective mice treated with the drug vehicle only. Ronacaleret treatment normalized the plasma calcium concentrations of CasrNuf/+ mice. However, the plasma calcium concentrations of treated CasrNuf/Nuf mice remained significantly reduced compared with untreated Casr+/+ mice. Mean 6 standard error of the mean values are indicated by solid bars. *P , 0.05, **P , 0.01, ***P , 0.001. NS, nonsignificant.
administered this calcilytic agent to Nuf mice. Male and female Casr+/+, CasrNuf/+, and CasrNuf/Nuf mice were given ronacaleret or drug vehicle for 5 days by twice-daily oral gavage. Ronacaleret was administered at a dose of 90 mg/kg, as pilot studies had shown this dose to increase plasma calcium concentrations and to be well tolerated in Casr+/+ mice. Untreated CasrNuf/+ and CasrNuf/Nuf mice were shown to be significantly hypocalcemic compared with Casr+/+ mice, and CasrNuf/Nuf mice had significantly lower plasma calcium concentrations than CasrNuf/+ mice [Fig. 2(d) and 2(e)]. Ronacaleret treatment significantly (P , 0.01) increased plasma calcium concentrations in
male and female Casr+/+, CasrNuf/+, and CasrNuf/Nuf mice compared with respective untreated mice [Fig. 2(d) and 2(e)]. Ronacaleret treatment normalized the plasma calcium concentrations of male and female CasrNuf/+ mice [Fig. 2(d) and 2(e)]. However, the plasma calcium concentrations of treated CasrNuf/Nuf mice remained significantly reduced compared with untreated Casr+/+ mice [Fig. 2(d) and 2(e)]. Ronacaleret treatment had no effect on the plasma glucose concentrations of male and female Casr+/+ mice (Figs. 3 and 4) but significantly (P , 0.05) improved glucose tolerance in male and female CasrNuf/+ and CasrNuf/Nuf mice compared with respective mice
2492
Babinsky et al
CaSR Activation in Mice Causes Hyperglycemia
Endocrinology, August 2017, 158(8):2486–2502
Figure 3. Effect of ronacaleret on the plasma glucose, insulin, and glucagon concentrations of male mice during IPGTT. Ronacaleret administration had no effect on the plasma glucose concentrations of (a) Casr+/+ mice (black dashed line) but significantly lowered plasma glucose in (b) CasrNuf/+ (blue dashed line) and (c) CasrNuf/Nuf mice (red dashed line) compared with respective control mice treated with the drug vehicle only (represented by solid lines), so that the glucose concentrations were not significantly different from Casr+/+ mice. Ronacaleret had no effect on the plasma insulin concentrations of (d) Casr+/+ mice but significantly increased plasma insulin in (e) CasrNuf/+ mice compared with controls, so that the insulin concentrations were not significantly different from Casr+/+ mice. Ronacaleret treatment did not alter plasma insulin concentrations in (f) CasrNuf/Nuf mice. Ronacaleret had no significant effect on the plasma glucagon concentrations of (g) Casr+/+ mice, (h) CasrNuf/+ mice, or (i) CasrNuf/Nuf mice compared with respective control mice. Results are expressed as mean 6 standard error of the mean. *P , 0.05, **P , 0.01 compared with control mice.
treated with the drug vehicle alone (Figs. 3 and 4). Moreover, sex differences were noted, as ronacaleret normalized plasma glucose concentrations at 30 minutes in male CasrNuf/+mice but only at 60 minutes in female CasrNuf/+mice (Figs. 3 and 4). Ronacaleret treatment had no effect on the plasma insulin concentrations of male and female Casr+/+ mice (Figs. 3 and 4) but significantly increased the plasma insulin concentrations of male and female CasrNuf/+ mice compared with untreated CasrNuf/+ mice (Figs. 3 and 4). Ronacaleret treatment did not alter
plasma insulin concentrations in male and female CasrNuf/Nuf mice (Figs. 3 and 4) and had no significant effect on the plasma glucagon concentrations of male and female Casr+/+, CasrNuf/+, or CasrNuf/Nuf mice (Figs. 3 and 4). No significant differences were noted between the biochemical responses of ronacaleret-treated male and female mice (Supplemental Fig. 3). To evaluate the mechanisms underlying these alterations of glucose tolerance and plasma insulin and glucagon concentrations in Nuf mice, further ex vivo and electrophysiological
doi: 10.1210/en.2017-00111
https://academic.oup.com/endo
2493
Figure 4. Effect of ronacaleret on the plasma glucose, insulin, and glucagon concentrations of female mice during IPGTT. Ronacaleret administration had no effect on the plasma glucose concentrations of (a) Casr+/+ mice (black dashed line) but significantly lowered plasma glucose in (b) CasrNuf/+ (blue dashed line) and (c) CasrNuf/Nuf mice (red dashed line) compared with respective control mice treated with the drug vehicle only (represented by solid lines), so that the glucose concentrations were not significantly different from Casr+/+ mice. Ronacaleret had no effect on the plasma insulin concentrations of (d) Casr+/+ mice but significantly increased plasma insulin in (e) CasrNuf/+ mice compared with controls, so that the insulin concentrations were not significantly different from Casr+/+ mice. Ronacaleret treatment did not alter plasma insulin concentrations in (f) CasrNuf/Nuf mice. Ronacaleret had no significant effect on the plasma glucagon concentrations of (g) Casr+/+ mice, (h) CasrNuf/+ mice, or (i) CasrNuf/Nuf mice compared with respective control mice. Results are expressed as mean 6 standard error of the mean. *P , 0.05, **P , 0.01, ***P , 0.001 compared with control mice.
studies were undertaken. As no significant differences had been observed for the glucose, insulin, and glucagon responses of male and female mice, the ex vivo data were combined for males and females. Pancreatic islet size and proliferation We assessed for alterations in islet morphology by undertaking histological analysis of whole pancreases from adult Casr+/+, CasrNuf/+, and CasrNuf/Nuf mice. This revealed that the overall architecture of CasrNuf/+ and
CasrNuf/Nuf islets was similar to that in Casr+/+ mice [Fig. 5(a)]. However, islet area, which was normalized to body weight, was reduced by .40% in CasrNuf/+ and CasrNuf/Nuf mice [Fig. 5(b)], and this was associated with significant decreases in islet numbers and mean islet size [Fig. 5(c) and 5(d)]. To assess whether the reduced islet area may also be associated with alterations in the numbers of b-cells or a-cells, whole pancreas sections were immunostained for insulin and glucagon [Fig. 5(e)]. Individual islets from CasrNuf/Nuf mice had 5% to 10%
2494
Babinsky et al
CaSR Activation in Mice Causes Hyperglycemia
Endocrinology, August 2017, 158(8):2486–2502
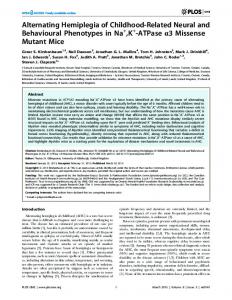
Figure 5. Histological analysis of Nuf mice pancreatic islets. (a) Representative H&E-stained pancreatic sections from Casr+/+, CasrNuf/+, and CasrNuf/Nuf mice. Bars indicate 200 mm. (b) Islet area and (c) number are significantly reduced in CasrNuf/+ and CasrNuf/Nuf mice compared with Casr+/+ mice. (d) Islet size is significantly reduced in CasrNuf/Nuf mice compared with Casr+/+ mice. (e) Representative pancreatic islets from Casr+/+, CasrNuf/+, and CasrNuf/Nuf mice immunostained for glucagon (red), insulin (white), and DAPI (blue). Bars indicate 50 mm. (f) CasrNuf/Nuf mice have significantly reduced b-cell numbers and (g) significantly increased a-cell numbers compared with Casr+/+ mice. (h) b-cell proliferation in representative islets from Casr+/+, CasrNuf/+, and CasrNuf/Nuf mice immunostained for insulin (white), DAPI (blue), and KI-67 (red). KI-67–positive cells are also indicated by yellow arrows. Bars indicate 50 mm. (i) CasrNuf/Nuf mice have significantly reduced proliferation of b-cells and (j) significantly increased proliferation of a-cells compared with respective Casr+/+ mice. Results are expressed as mean 6 standard error of the mean. *P , 0.05, **P , 0.01 compared with Casr+/+ mice.
fewer b-cells (P , 0.05) and approximately 20% more a-cells than Casr+/+ islets (P , 0.05) [Fig. 5(f) and 5(g)]. To investigate whether the reduction in b-cells and increase in a-cells were caused by alterations in cellular proliferation, whole pancreas sections were immunostained with the proliferation marker Ki-67. [Fig. 5(h)]. The percentage of proliferating insulin-positive b-cells in CasrNuf/Nuf mice was found to be significantly decreased (P , 0.05), whereas the percentage of proliferating insulin-negative cells (which are predominantly a-cells) was significantly increased when compared with respective Casr+/+ islets [Fig. 5(i) and 5(j)]. qRT-PCR
analysis utilizing RNA from isolated Casr+/+ and CasrNuf/Nuf islets revealed that these changes in b-cell and a-cell proliferation were not associated with significant alterations in the expression of genes regulating islet mass such as Foxo1, Foxm1, Ngn3, and Tcf7l2 (31–34), which promote b-cell proliferation, or in the expression of genes such as Arx and Irx2 (35), which influence a-cell proliferation (Supplemental Fig. 4). Insulin and glucagon secretion from isolated islets To determine whether Nuf mice have alterations in pancreatic islet insulin secretion, size-matched islets were
doi: 10.1210/en.2017-00111
https://academic.oup.com/endo
2495
isolated from Casr+/+ and CasrNuf/Nuf mice and exposed intact Casr+/+ and CasrNuf/Nuf islets on treatment with to low (1 mM), physiological (6 mM), or high (20 mM) varying (1, 12, or 20 mM) concentrations of glucose, or 2+ glucose concentrations in the presence of 1.6 mM [Ca ]o, tolbutamide, which is a KATP channel blocker (26). The which represents a physiological [Ca2+]o (36). The insulin electrophysiological experiments were undertaken at 1.5 mM [Ca2+]o, as described (25), and the effect of content of isolated CasrNuf/Nuf islets was not significantly +/+ different from isolated Casr islets [Fig. 6(a)]. Measurement of insulin in the supernatant of islets following glucose stimulation did not reveal any impairment in the insulin secretory responses of isolated CasrNuf/Nuf islets compared with Casr+/+ islets [Fig. 6(b)]. We also investigated whether glucagon secretion may be altered in Nuf mouse islets. Compared with Casr+/+ islets, there was a .30% increase in the glucagon content [Fig. 6(c)] of CasrNuf/Nuf islets. Increasing glucose from 1 to 6 mM resulted in a 60% reduction of glucagon secretion from isolated Casr+/+ islets [Fig. 6(d)]. In contrast, islets from CasrNuf/Nuf mice exhibited a lack of glucose-induced suppression of glucagon release [Fig. 6(d)], which is consistent with that observed in islets from type 2 diabetic patients (37). To investigate whether the reduced plasma insulin concentrations of Nuf mice may have been a consequence of their hypocalcemia, insulin secretion from isolated islets was measured following exposure to 0.8 mM [Ca2+]o, which is similar to the plasma calcium concentrations observed in CasrNuf/Nuf mice (15, 16). Altering the [Ca2+]o had no effect on insulin secretion in the presence Figure 6. Insulin and glucagon secretion from isolated Nuf mice pancreatic islets. (a) The content of CasrNuf/Nuf islets was not altered compared with Casr+/+ islets. (b) Casr+/+ of low (1 mM) glucose concentrations total insulin Nuf/Nuf and Casr islets were incubated in 1.6 mM [Ca2+]o and exposed to varying glucose [Fig. 6(e)]. However, exposure to low concentrations (1, 6, or 20 mM). Casr+/+ and CasrNuf/Nuf islets showed significantly increased (0.8 mM) Ca2+o impaired insulin se- insulin secretion following stimulation with 20 mM glucose. No significant differences in the cretion from Casr+/+ and CasrNuf/Nuf maximal insulin secretory responses were observed between Casr+/+ and CasrNuf/Nuf islets. (c) total glucagon content of CasrNuf/Nuf islets was significantly increased compared with islets in the presence of high (20 mM) The +/+ Casr islets. (d) Casr+/+ and CasrNuf/Nuf islets were incubated in 1.6 mM [Ca2+]o and exposed glucose concentrations [Fig. 6(e)]. Ex- to 1 and 6 mM glucose concentrations. Casr+/+ islets showed a significant reduction in posure to low (0.8 mM) Ca2+o increased glucagon secretion following stimulation with 6 mM glucose. In contrast, glucagon secretion Nuf/Nuf islets failed to suppress following glucose stimulation, and CasrNuf/Nuf islets glucagon secretion from Casr+/+ islets at from Casr had significantly increased glucagon secretion compared with Casr+/+ islets at 6 mM glucose. 20 mM glucose but had no effect on (e) The effect of Ca2+ on insulin secretion was assessed by incubating Casr+/+ and CasrNuf/Nuf o glucagon secretion from CasrNuf/Nuf is- islets with varying Ca2+o concentrations (0.8 or 1.6 mM) and exposing them to low (1 mM) or high (20 mM) glucose. Exposure to low (0.8 mM) Ca2+o suppressed insulin secretion from lets [Fig. 6(f)]. +/+ Nuf/Nuf 2+ Electrophysiological studies of isolated islets We investigated alterations in b-cell electrical activity by recording the membrane potential of b-cells within
Casr and Casr islets at 20 mM glucose. (f) Exposure to low (0.8 mM) Ca o increased glucagon secretion from Casr+/+ islets at 20 mM glucose but had no effect on glucagon secretion from CasrNuf/Nuf islets. Islet insulin and glucagon in panels (a–d) were measured by radioimmunoassay and by duplex rat/mouse ELISA (Meso Scale Discovery) in panels (e) and (f). The sample size (N) represents batches of size-matched islets, which were pooled from three to six Casr+/+ mice and six CasrNuf/Nuf mice. Mean 6 standard error of the mean values for the respective groups are indicated by solid bars. *P , 0.05, **P , 0.01, ***P , 0.001. NS, nonsignificant.
2496
Babinsky et al
CaSR Activation in Mice Causes Hyperglycemia
lowering the [Ca2+]o on b-cell electrical activity was evaluated at 0.75 mM [Ca2+]o, which is in keeping with the plasma calcium concentrations of CasrNuf/Nuf mice (15, 16). Analysis of membrane potentials showed b-cells from Casr+/+ mice (i.e., WTs) to be hyperpolarized (–76 6 2 mV) and electrically silent at 1 mM glucose concentrations [Fig. 7(a)]. In contrast, CasrNuf/Nuf b-cells were significantly depolarized (–63 6 5 mV; P , 0.01) at 1 mM glucose, and .40% of cells (four of nine) were electrically active with low-frequency action potential firing [Fig. 7(a)]. The depolarization and hyperactivity of CasrNuf/Nuf b-cells were rectified by lowering [Ca2+]o from 1.5 to 0.75 mM [Fig. 7(b) and 7(c)]. At stimulatory glucose concentrations (12 or 20 mM) or following application of tolbutamide, both Casr+/+ and CasrNuf/Nuf
Endocrinology, August 2017, 158(8):2486–2502
b-cells were depolarized and firing action potentials [Fig. 7(a) and 7(b)], and the level of the depolarization was not altered in CasrNuf/Nuf b-cells [Fig. 7(c)]. However, the peak of action potential evoked by 20 mM glucose in CasrNuf/Nuf b-cells was significantly reduced compared with Casr+/+ b-cells [Fig. 7(d)]. The antipeak potential and firing frequency were not affected by the expression of the Casr mutation or variation in [Ca2+]o [Fig. 7(e) and 7(f)]. Based on the observation that CasrNuf/Nuf b-cells were significantly depolarized at 1 mM glucose, we postulated that the CaSR may influence the KATP channel, which plays a central role in regulating the membrane potential of b-cells (1). We therefore measured resting conductance, which predominantly reflects KATP channel activity, of Casr+/+ and
Figure 7. Effect of glucose stimulation on the electrical activity of Nuf mice b-cells. (a) Representative membrane potential recording of b-cells from intact Casr+/+ and CasrNuf/Nuf islets, which had been incubated in 1.5 mM [Ca2+]o and following stimulation with 1 mM (1G), 12 mM (12G), and 20 mM (20G) glucose concentrations or with tolbutamide (Tolb). (b) Representative membrane potential recording of b-cells from intact Casr+/+ and CasrNuf/Nuf islets in the presence of 0.75 mM Ca2+o concentrations and following stimulation with 1, 12, or 20 mM glucose concentrations or with tolbutamide. (c) Basal membrane potential, (d) action potential peak, (e) antipeak potential, and (f) frequency of action potential firing from b-cells was assessed in intact Casr+/+ (white bars) and CasrNuf/Nuf islets (black bars) in the presence of 1.5 or 0.75 mM Ca2+o concentrations and following stimulation with glucose or tolbutamide. The sample size (N) represents individual b-cell recordings obtained from intact islets of six Casr+/+ mice and four CasrNuf/Nuf mice. Results are expressed as mean 6 standard error of the mean. *P , 0.05, **P , 0.01 compared with Casr+/+ mice at respective glucose and Ca2+o concentrations.
doi: 10.1210/en.2017-00111
CasrNuf/Nuf b-cells in the presence of 1, 12, or 20 mM glucose, or with tolbutamide. These studies showed b-cell resting conductance to be comparable between genotypes [Fig. 8(a) and 8(b)]. However, the holding current measured at –70 mV in CasrNuf/Nuf b-cells when KATP channel activity was suppressed by 20 mM glucose or tolbutamide was significantly greater than in Casr+/+ b-cells [Fig. 8(c) and 8(d)], and its contribution likely accounts for the more depolarized membrane potential and action potential firing in CasrNuf/Nuf b-cells exposed to 1 mM glucose [Fig. 7(a)]. To determine whether Nuf mice may also have alterations in a-cell electrical activity, membrane potentials were recorded in intact islet a-cells, as described (26). In agreement with previous reports (37), Casr+/+ a-cells were shown to be electrically active at 1 mM glucose [Fig. 9(a)]. The addition of 6 mM glucose led to a small but statistically significant (P , 0.01) depolarization and reduction in action potential peak [Fig. 9(a)]. CasrNuf/Nuf a-cells were also electrically active at 1 mM glucose [Fig. 9(b)] but did not depolarize when glucose was increased to 6 mM [Fig. 9(b) and 9(c)], and there was no change in the action potential peak [Fig. 9(b) and 9(d)]. The addition of tolbutamide led to membrane depolarization in both Casr+/+ and CasrNuf/Nuf a-cells [Fig. 9(a) and 9(b)], but the magnitude of the depolarizing effect was reduced in CasrNuf/Nuf a-cells [Fig. 9(c)]. Tolbutamide also decreased the action potential peak of Casr+/+ a-cells but had no significant effect on the action potential peak of CasrNuf/Nuf a-cells [Fig. 9(a), 9(b), and 9(d)]. There were no significant differences in the action potential frequency between Casr+/+ and CasrNuf/Nuf a-cells, and this was not affected by varying glucose or the addition of tolbutamide [Fig. 9(e)].
Discussion Our studies have shown an in vivo role for the CaSR in glucose homeostasis and in the regulation of pancreatic islet mass and islet hormone secretion. Thus, Nuf mice with a gain-of-function CaSR mutation exhibited impaired glucose tolerance, which was associated with reduced pancreatic islet mass and hypoinsulinemia as well as a lack of glucose-mediated suppression of glucagon secretion. Moreover, these findings indicate that ADHcausing mutations of the CaSR, which lead to a gain-offunction (14), may perturb systemic glucose homeostasis, and this contrasts with FHH-causing loss-of-function CaSR mutations, which have been shown to not influence glucose tolerance or insulin secretion (13). Furthermore, these findings suggest that a common coding region CaSR variant (Ala986Ser), which was reported in association with raised plasma glucose concentrations
https://academic.oup.com/endo
2497
in a patient-based study (12), may have altered CaSR function in tissues involved in systemic glucose regulation. However, impaired glucose tolerance or diabetes has not been reported in ADH patients to date, and detailed investigations of glucose homeostasis in humans are warranted. Although our studies showed CaSR activation to influence plasma glucose concentrations, we did not observe any effect of extracellular glucose on the acute signaling responses of WT or mutant Nuf CaSRs in vitro. Our findings are consistent with results obtained by other groups (Arthur Conigrave and Donald Ward, personal communication) but contrast with a recent study, which showed that raising the glucose concentration from 3 to 5 mM increased the Ca2+i responses of stably expressing HEK293-CaSR cells in the presence of Ca2+o (30). This recent study, which showed glucose to act as a CaSR allosteric activator, measured Ca2+i responses in single cells using the fluo-8 calcium binding dye (30), whereas our study measured Ca2+i responses in populations of HEK293-CaSR cells using the fluo-4 calcium binding dye, and these methodological differences may be contributors to the contrasting observations of these two studies. The CaSR is a therapeutic target for calcitropic diseases (14, 38), and our studies involving the administration of ronacaleret, which is a calcilytic compound, to Nuf mice showed that pharmacological modulation of the CaSR may also alter plasma glucose concentrations. Ronacaleret treatment rectified the hypocalcemia of heterozygous-affected (CasrNuf/+) mice, and this was associated with an increase in plasma insulin concentrations. Thus, these findings suggest that ronacaleret rectified the impaired glucose tolerance and hypoinsulinemia of CasrNuf/+ mice by modulating their plasma calcium concentrations, and this is in keeping with our analysis of isolated Nuf mice islets, which demonstrated that Ca2+o is required for insulin release, and is also supported by a study showing that patients with chronic hypocalcemia have reduced glucose-stimulated insulin secretion (39). However, ronacaleret treatment also improved the glucose tolerance of homozygous-affected (CasrNuf/Nuf) mice without fully normalizing their plasma calcium concentrations or altering plasma insulin or glucagon concentrations. Thus, these studies involving CasrNuf/Nuf mice suggest that ronacaleret likely had additional effects on the glucose tolerance of Nuf mice, independently of altering plasma concentrations of calcium, insulin, and glucagon. The CaSR is expressed in peripheral tissues such as skeletal muscle and adipose tissue (40, 41), and it remains to be established whether ronacaleret treatment may potentially have sensitized these tissues to the actions of insulin, thereby improving glucose tolerance.
2498
Babinsky et al
CaSR Activation in Mice Causes Hyperglycemia
Endocrinology, August 2017, 158(8):2486–2502
Figure 8. KATP channel conductance of Nuf mice b-cells. (a) Representative recording of b-cell KATP channel conductance from intact Casr+/+ and CasrNuf/Nuf islets after islets had been incubated in 1.5 mM [Ca2+]o and following stimulation with 1 mM (1G), 12 mM (12G), and 20 mM (20G) glucose concentrations or with tolbutamide (Tolb). (b) Analysis of KATP channel conductance from b-cells within intact Casr+/+ (white bars) and CasrNuf/Nuf islets (black bars) following stimulation with glucose or tolbutamide. (c) Representative traces of b-cell background current measurement following glucose stimulation or treatment with tolbutamide. (d) Analysis of holding current from b-cells within intact Casr+/+ (white bars) and CasrNuf/Nuf islets (black bars) following stimulation with glucose or tolbutamide. The sample size (N) represents individual b-cell recordings obtained from intact islets of five Casr+/+ mice and five CasrNuf/Nuf mice. Results are expressed as mean 6 standard error of the mean. *P , 0.05, **P , 0.01 compared with Casr+/+ mice at respective glucose and tolbutamide concentrations.
doi: 10.1210/en.2017-00111
https://academic.oup.com/endo
2499
Figure 9. Effect of glucose stimulation on the electrical activity of Nuf mice a-cells. Representative membrane potential recording of a-cells from (a) intact Casr+/+ and (b) CasrNuf/Nuf islets, which had been incubated in 1.5 mM [Ca2+]o and following stimulation with 1 mM (1G) and 6 mM (6G) glucose concentrations or with tolbutamide (Tolb). (c) Antipeak potential, (d) action potential peak, and (e) frequency of action potential firing was assessed in a-cells within intact Casr+/+ (white bars) and CasrNuf/Nuf islets (black bars) following stimulation with glucose or tolbutamide. The sample size (N) represents individual a-cell recordings obtained from intact islets of five Casr+/+ mice and seven CasrNuf/Nuf mice. Results are expressed as mean 6 standard error of the mean. *P , 0.05, **P , 0.01 compared with respective a-cells at 1 mM glucose.
Histological analysis revealed Nuf mice to have a significant reduction in mean islet area, and these findings may have contributed to their reduced plasma insulin concentrations and impaired glucose tolerance. Indeed, a decrease in pancreatic b-cell mass is considered to be important in the pathogenesis of type 2 diabetes, as highlighted by a study of a mouse model with restricted b-cell expansion, which showed that a 30% reduction in b-cell mass is sufficient to result in impaired glucose tolerance (42). Our histological analyses also revealed individual CasrNuf/Nuf islets to have a significant reduction in the proportion of b-cells compared with Casr+/+ islets. Thus, these findings indicate that the CaSR may influence pancreatic islet size and the cellular composition of individual islets and suggest a role for this GPCR in the development and/or maintenance of b-cell mass. In support of this, mouse model studies of the a-2A
adrenergic receptor, which is highly expressed in b-cells, have shown GPCR signaling to play a critical role in modulating pancreatic islet mass by inhibiting b-cell proliferation during the perinatal period (42). In keeping with this observation, CaSR activation was also associated with significantly reduced b-cell proliferation in adult CasrNuf/Nuf islets, which may have contributed to the reduced size of Nuf mouse islets. However, b-cell proliferation was measured using the Ki67 marker, which shows proliferation over a limited timeframe, and longterm continuous labeling with the thymidine analog 5-bromo-2-deoxyuridine is required to provide a more accurate assessment of proliferation (43). Moreover, genes reported to be involved in the regulation of islet cell proliferation did not show altered expression in CasrNuf/Nuf islets. Thus, it is possible that the gain-offunction CaSR mutation harbored by Nuf mice may have
2500
Babinsky et al
CaSR Activation in Mice Causes Hyperglycemia
exerted a greater influence on islet size during the perinatal and early postnatal periods, when the b-cell population is undergoing a rapid expansion, and at this key developmental stage, alterations in cellular proliferation can have a substantial impact on adult b-cell mass and insulin secretory capacity (42). Furthermore, the CaSR may have influenced b-cell apoptosis, which has been shown to contribute to the reduced islet mass in humans with type 2 diabetes (44). Isolated Nuf mouse islets were shown to have alterations in b-cell electrical activity, and CasrNuf/Nuf b-cells were significantly depolarized and electrically active at low glucose concentrations. These findings suggest that the CaSR may influence the basal electrical activity of the b-cell, most likely by increasing background conductance (Fig. 8). In support of this, lowering the concentration of Ca2+o, which represents the major physiological ligand of the CaSR (14), rectified the increased basal activity of CasrNuf/Nuf b-cells. Although the KATP channel plays an essential role in regulating the b-cell resting membrane potential (45), KATP channel conductance was not altered in CasrNuf/Nuf b-cells, and the higher background conductance was resistant to the effects of tolbutamide. Thus, the basal hyperactivity of CasrNuf/Nuf b-cells may have been mediated by a KATP channel–independent mechanism. A previous study has demonstrated that the transient receptor potential (TRP) M4 and TRPM5 ion channels regulate b-cell membrane potential, and activation of these channels leads to increased b-cell electrical activity (25). As TRPM4 and TRPM5 channels have been shown to be activated by Gq/11-mediated phosphoinositide signaling (25), it is possible that CaSR activation induced depolarization and hyperactivity of b-cells by enhancing the opening of these channels. However, due to a lack of selective channel blockers, it remains to be established whether CaSR may act via TRPM4 and TRPM5 in b-cells. Interestingly, the increased electrical activity of CasrNuf/Nuf b-cells at 1 mM glucose was not associated with an increase in basal insulin secretion. The release of insulin has been shown to be mediated by a combination of triggering effects (mediated by KATP channel closure and initiation of action potential firing) and late amplifying effects (exerted at the level of insulin granule exocytosis) (1). Thus, although CasrNuf/Nuf b-cells generated action potentials at low glucose, this may not necessarily have stimulated insulin secretion. Moreover, the CaSR did not influence the overall responses of b-cells to stimulatory glucose concentrations; however, a reduced spike height of the glucose-induced action potentials in CasrNuf/Nuf b-cells was observed. The generation of action potentials in b-cells is mediated by Ca2+ influx through the L-type voltage-dependent Ca2+ channel (VDCC) (46), and our observation of altered
Endocrinology, August 2017, 158(8):2486–2502
action potential height provides support for an interaction between the CaSR and L-type VDCC, as has been previously reported (47). A key finding in this study was the presence of dysregulated glucagon secretion and altered a-cell function in CasrNuf/Nuf mice. Glucagon plays a central role in systemic glucose homeostasis by stimulating hepatic glucose production, and oversecretion of glucagon contributes to the hyperglycemia in type 2 diabetes (48). The release of glucagon from a-cells is physiologically inhibited by elevations in glucose concentrations (26, 48). However, high glucose concentrations failed to suppress glucagon secretion from CasrNuf/Nuf islets. We investigated whether alterations in the electrical activity of CasrNuf/Nuf a-cells may have impaired the suppression of glucagon secretion following exposure to high glucose. In WT a-cells, glucose regulates glucagon secretion via closure of the KATP channel, and the resulting membrane depolarization leads to reduced activation of P/Q-type VDCCs that mediate the Ca2+ entry responsible for hypoglycemia-induced glucagon secretion (26, 37, 48). However, in CasrNuf/Nuf a-cells, glucose did not induce membrane depolarization, and tolbutamide only caused a modest depolarization (approximately 2 mV), whereas this KATP channel blocker increased membrane potential by approximately 10 mV in Casr+/+ a-cells (Fig. 9). Together, these data suggest that CaSR activation may have attenuated a-cell basal KATP channel activity, which impaired the membrane depolarizing effect of glucose and tolbutamide. Furthermore, CasrNuf/Nuf mice exhibited an increase in a-cell numbers within individual islets, enhanced a-cell proliferation rates, and significantly elevated islet glucagon content. These findings highlight a potential and unique role for the CaSR in promoting a-cell neogenesis, but it is also possible that the hypoinsulinemia of Nuf mice may have led to an expansion of a-cells, as has previously been reported in mice with streptozotocininduced insulin deficiency (49). In conclusion, we have demonstrated that Nuf mice with a germline gain-of-function CaSR mutation have impaired glucose tolerance, which can be ameliorated by calcilytic treatment. Moreover, our findings reveal a role for the CaSR in the regulation of pancreatic islet mass and a- and b-cell function.
Acknowledgments Address all correspondence and requests for reprints to: Rajesh V. Thakker, FRS, Academic Endocrine Unit, Radcliffe Department of Medicine, Oxford Centre for Diabetes, Endocrinology and Metabolism, Churchill Hospital, Oxford OX3 7LE, United Kingdom. E-mail:
[email protected]. This work was supported by UK Medical Research Council Programme Grants G9825289 and G1000467 (to M.A.N.,
doi: 10.1210/en.2017-00111
Appendix.
https://academic.oup.com/endo
2501
Antibody Table
Peptide/ Protein Target Primary antibodies Insulin Glucagon Ki67 Secondary antibodies Anti-guinea pig IgG (H+L) Anti-rabbit IgG (H+L)
Manufacturer, Catalog No., and/or Name of Individual Providing the Antibody
Species Raised in; Monoclonal or Polyclonal
Dilution Used
RRID
Abcam, ab7842 Abcam, ab92517 Abcam, ab15580
Guinea pig; polyclonal Rabbit; monoclonal Rabbit; polyclonal
0.005 0.005 0.002
AB_306130 AB_10561971 AB_443209
Cy™2 AffiniPure Donkey Anti-Guinea Pig IgG (H+L)
Jackson, 706-225-148
Donkey; polyclonal
0.01
AB_2340467
Cy™3 AffiniPure Donkey Anti-Rabbit IgG (H+L)
Jackson, 711-165-152
Donkey; polyclonal
0.002
AB_2307443
Name of Antibody
Anti-insulin Anti-glucagon Anti-Ki67
Abbreviations: H+L, heavy and light chains; IgG, immunoglobulin G.
F.M.H., and R.V.T.), the UK Medical Research Council (MC_U142661184; to A.H., L.B., T.A.H., E.J., M.S., S.W., and R.D.C.), GlaxoSmithKline (to F.M.H. and R.V.T. for ronacaleret in vivo studies), the National Institute for Health Research Oxford Biomedical Research Centre Programme (to M.A.N. and R.V.T.), EU Marie Curie Innovative Training Network Grant FP7-264663 (to V.N.B., A.A., R.V.T, and E.K), and RD Lawrence Diabetes UK Fellowships (to R.D.R. and Q.Z.). Disclosure Summary: F.M.H. and R.V.T. have received grant funding from GlaxoSmithKline and NPS/Shire Pharmaceuticals for studiesinvolvingtheuseofCaSRallostericinhibitors.R.V.T.hasalso received grants from Novartis Pharma AG and the Marshall Smith Syndrome Foundation for unrelated studies. D.R. is an employee of GlaxoSmithKline. The remaining authors have nothing to disclose.
10.
11.
12.
13.
References 14. 1. Ashcroft FM, Rorsman P. Diabetes mellitus and the b cell: the last ten years. Cell. 2012;148(6):1160–1171. 2. Unger RH, Orci L. Paracrinology of islets and the paracrinopathy of diabetes. Proc Natl Acad Sci USA. 2010;107(37):16009–16012. 3. Stevens RC, Cherezov V, Katritch V, Abagyan R, Kuhn P, Rosen H, Wuthrich ¨ K. The GPCR Network: a large-scale collaboration to determine human GPCR structure and function. Nat Rev Drug Discov. 2013;12(1):25–34. 4. Ahr´en B. Islet G protein-coupled receptors as potential targets for treatment of type 2 diabetes. Nat Rev Drug Discov. 2009;8(5): 369–385. 5. Regard JB, Kataoka H, Cano DA, Camerer E, Yin L, Zheng YW, Scanlan TS, Hebrok M, Coughlin SR. Probing cell type-specific functions of Gi in vivo identifies GPCR regulators of insulin secretion. J Clin Invest. 2007;117(12):4034–4043. 6. Hofer AM, Brown EM. Extracellular calcium sensing and signalling. Nat Rev Mol Cell Biol. 2003;4(7):530–538. 7. Regard JB, Sato IT, Coughlin SR. Anatomical profiling of G protein-coupled receptor expression. Cell. 2008;135(3):561–571. 8. Squires PE, Harris TE, Persaud SJ, Curtis SB, Buchan AM, Jones PM. The extracellular calcium-sensing receptor on human b-cells negatively modulates insulin secretion. Diabetes. 2000;49(3): 409–417. 9. Gray E, Muller D, Squires PE, Asare-Anane H, Huang GC, Amiel S, Persaud SJ, Jones PM. Activation of the extracellular calciumsensing receptor initiates insulin secretion from human islets of
15.
16.
17.
18.
Langerhans: involvement of protein kinases. J Endocrinol. 2006; 190(3):703–710. Straub SG, Kornreich B, Oswald RE, Nemeth EF, Sharp GW. The calcimimetic R-467 potentiates insulin secretion in pancreatic b cells by activation of a nonspecific cation channel. J Biol Chem. 2000;275(25):18777–18784. Oh YS, Seo EH, Lee YS, Cho SC, Jung HS, Park SC, Jun HS. Increase of calcium sensing receptor expression is related to compensatory insulin secretion during aging in mice. PLoS One. 2016;11(7):e0159689. Babinsky VN, Hannan FM, Youhanna SC, Mar´echal C, Jadoul M, Devuyst O, Thakker RV. Association studies of calcium-sensing receptor (CaSR) polymorphisms with serum concentrations of glucose and phosphate, and vascular calcification in renal transplant recipients. PLoS One. 2015;10(3):e0119459. Wolf P, Krˇssˇ ak ´ M, Winhofer Y, Anderwald CH, Zwettler E, Just Kukurova´ I, Gessl A, Trattnig S, Luger A, Baumgartner-Parzer S, Krebs M. Cardiometabolic phenotyping of patients with familial hypocalcuric hypercalcemia. J Clin Endocrinol Metab. 2014;99(9): E1721–E1726. Hannan FM, Babinsky VN, Thakker RV. Disorders of the calciumsensing receptor and partner proteins: insights into the molecular basis of calcium homeostasis. J Mol Endocrinol. 2016;57(3): R127–R142. Hannan FM, Walls GV, Babinsky VN, Nesbit MA, Kallay E, Hough TA, Fraser WD, Cox RD, Hu J, Spiegel AM, Thakker RV. The calcilytic agent NPS 2143 rectifies hypocalcemia in a mouse model with an activating calcium-sensing receptor (CaSR) mutation: relevance to autosomal dominant hypocalcemia type 1 (ADH1). Endocrinology. 2015;156(9):3114–3121. Hough TA, Bogani D, Cheeseman MT, Favor J, Nesbit MA, Thakker RV, Lyon MF. Activating calcium-sensing receptor mutation in the mouse is associated with cataracts and ectopic calcification. Proc Natl Acad Sci USA. 2004;101(37):13566–13571. Hannan FM, Howles SA, Rogers A, Cranston T, Gorvin CM, Babinsky VN, Reed AA, Thakker CE, Bockenhauer D, Brown RS, Connell JM, Cook J, Darzy K, Ehtisham S, Graham U, Hulse T, Hunter SJ, Izatt L, Kumar D, McKenna MJ, McKnight JA, Morrison PJ, Mughal MZ, O’Halloran D, Pearce SH, Porteous ME, Rahman M, Richardson T, Robinson R, Scheers I, Siddique H, Van’t Hoff WG, Wang T, Whyte MP, Nesbit MA, Thakker RV. Adaptor protein-2 s subunit mutations causing familial hypocalciuric hypercalcaemia type 3 (FHH3) demonstrate genotypephenotype correlations, codon bias and dominant-negative effects. Hum Mol Genet. 2015;24(18):5079–5092. Babinsky VN, Hannan FM, Gorvin CM, Howles SA, Nesbit MA, Rust N, Hanyaloglu AC, Hu J, Spiegel AM, Thakker RV. Allosteric
2502
19.
20.
21.
22.
23.
24.
25.
26.
27.
28. 29.
30.
31.
Babinsky et al
CaSR Activation in Mice Causes Hyperglycemia
modulation of the calcium-sensing receptor rectifies signaling abnormalities associated with G-protein a-11 mutations causing hypercalcemic and hypocalcemic disorders. J Biol Chem. 2016; 291(20):10876–10885. Goldsworthy M, Hugill A, Freeman H, Horner E, Shimomura K, Bogani D, Pieles G, Mijat V, Arkell R, Bhattacharya S, Ashcroft FM, Cox RD. Role of the transcription factor sox4 in insulin secretion and impaired glucose tolerance. Diabetes. 2008;57(8):2234–2244. Prior RL, Wu X, Gu L, Hager TJ, Hager A, Howard LR. Whole berries versus berry anthocyanins: interactions with dietary fat levels in the C57BL/6J mouse model of obesity. J Agric Food Chem. 2008;56(3):647–653. Zhang Q, Chibalina MV, Bengtsson M, Groschner LN, Ramracheya R, Rorsman NJ, Leiss V, Nassar MA, Welling A, Gribble FM, Reimann F, Hofmann F, Wood JN, Ashcroft FM, Rorsman P. Na+ current properties in islet a- and b-cells reflect cell-specific Scn3a and Scn9a expression. J Physiol. 2014;592(21):4677–4696. Hobaus ¨ J, Hummel DM, Thiem U, Fetahu IS, Aggarwal A, Mullauer ¨ L, Heller G, Egger G, Mesteri I, Baumgartner-Parzer S, Kallay E. Increased copy-number and not DNA hypomethylation causes overexpression of the candidate proto-oncogene CYP24A1 in colorectal cancer. Int J Cancer. 2013;133(6):1380–1388. Bentley L, Esapa CT, Nesbit MA, Head RA, Evans H, Lath D, Scudamore CL, Hough TA, Podrini C, Hannan FM, Fraser WD, Croucher PI, Brown MA, Brown SD, Cox RD, Thakker RV. An N-ethyl-N-nitrosourea induced corticotropin-releasing hormone promoter mutation provides a mouse model for endogenous glucocorticoid excess. Endocrinology. 2014;155(3):908–922. De Marinis YZ, Salehi A, Ward CE, Zhang Q, Abdulkader F, Bengtsson M, Braha O, Braun M, Ramracheya R, Amisten S, Habib AM, Moritoh Y, Zhang E, Reimann F, Rosengren AH, Shibasaki T, Gribble F, Renstrom ¨ E, Seino S, Eliasson L, Rorsman P. GLP-1 inhibits and adrenaline stimulates glucagon release by differential modulation of N- and L-type Ca2+ channel-dependent exocytosis. Cell Metab. 2010;11(6):543–553. Shigeto M, Ramracheya R, Tarasov AI, Cha CY, Chibalina MV, Hastoy B, Philippaert K, Reinbothe T, Rorsman N, Salehi A, Sones WR, Vergari E, Weston C, Gorelik J, Katsura M, Nikolaev VO, Vennekens R, Zaccolo M, Galione A, Johnson PR, Kaku K, Ladds G, Rorsman P. GLP-1 stimulates insulin secretion by PKCdependent TRPM4 and TRPM5 activation. J Clin Invest. 2015; 125(12):4714–4728. Rorsman P, Ramracheya R, Rorsman NJ, Zhang Q. ATP-regulated potassium channels and voltage-gated calcium channels in pancreatic a and b cells: similar functions but reciprocal effects on secretion. Diabetologia. 2014;57(9):1749–1761. Aggarwal A, Prinz-Wohlgenannt M, Groschel ¨ C, Tennakoon S, Meshcheryakova A, Chang W, Brown EM, Mechtcheriakova D, Kallay ´ E. The calcium-sensing receptor suppresses epithelial-tomesenchymal transition and stem cell- like phenotype in the colon. Mol Cancer. 2015;14:61. de Winter JC. Using the Student’s t-test with extremely small sample sizes. Pract Assess Res Eval. 2013;18(10):1–12. Fitzpatrick LA, Dabrowski CE, Cicconetti G, Gordon DN, Papapoulos S, Bone HG III, Bilezikian JP. The effects of ronacaleret, a calcium-sensing receptor antagonist, on bone mineral density and biochemical markers of bone turnover in postmenopausal women with low bone mineral density. J Clin Endocrinol Metab. 2011;96(8): 2441–2449. Medina J, Nakagawa Y, Nagasawa M, Fernandez A, Sakaguchi K, Kitaguchi T, Kojima I. Positive allosteric modulation of the calcium-sensing receptor by physiological concentrations of glucose. J Biol Chem. 2016;291(44):23126–23135. Golson ML, Dunn JC, Maulis MF, Dadi PK, Osipovich AB, Magnuson MA, Jacobson DA, Gannon M. Activation of FoxM1 revitalizes the replicative potential of aged b-cells in male mice and enhances insulin secretion. Diabetes. 2015;64(11): 3829–3838.
Endocrinology, August 2017, 158(8):2486–2502
32. Kitamura T, Nakae J, Kitamura Y, Kido Y, Biggs WH III, Wright CV, White MF, Arden KC, Accili D. The forkhead transcription factor Foxo1 links insulin signaling to Pdx1 regulation of pancreatic b cell growth. J Clin Invest. 2002;110(12):1839–1847. 33. Takamoto I, Kubota N, Nakaya K, Kumagai K, Hashimoto S, Kubota T, Inoue M, Kajiwara E, Katsuyama H, Obata A, Sakurai Y, Iwamoto M, Kitamura T, Ueki K, Kadowaki T. TCF7L2 in mouse pancreatic b cells plays a crucial role in glucose homeostasis by regulating b cell mass. Diabetologia. 2014;57(3):542–553. 34. Xu X, D’Hoker J, Stang´e G, Bonn´e S, De Leu N, Xiao X, Van de Casteele M, Mellitzer G, Ling Z, Pipeleers D, Bouwens L, Scharfmann R, Gradwohl G, Heimberg H. b cells can be generated from endogenous progenitors in injured adult mouse pancreas. Cell. 2008;132(2):197–207. 35. Gage BK, Asadi A, Baker RK, Webber TD, Wang R, Itoh M, Hayashi M, Miyata R, Akashi T, Kieffer TJ. The role of ARX in human pancreatic endocrine specification. PLoS One. 2015; 10(12):e0144100. 36. MacConaill M. Calcium precipitation from mammalian physiological salines (Ringer solutions) and the preparation of high [Ca] media. J Pharmacol Methods. 1985;14(2):147–155. 37. Zhang Q, Ramracheya R, Lahmann C, Tarasov A, Bengtsson M, Braha O, Braun M, Brereton M, Collins S, Galvanovskis J, Gonzalez A, Groschner LN, Rorsman NJ, Salehi A, Travers ME, Walker JN, Gloyn AL, Gribble F, Johnson PR, Reimann F, Ashcroft FM, Rorsman P. Role of KATP channels in glucose-regulated glucagon secretion and impaired counterregulation in type 2 diabetes. Cell Metab. 2013;18(6):871–882. 38. Nemeth EF, Goodman WG. Calcimimetic and calcilytic drugs: feats, flops, and futures. Calcif Tissue Int. 2016;98(4):341–358. 39. Yasuda K, Hurukawa Y, Okuyama M, Kikuchi M, Yoshinaga K. Glucose tolerance and insulin secretion in patients with parathyroid disorders. Effect of serum calcium on insulin release. N Engl J Med. 1975;292(10):501–504. 40. Bravo-Sagua R, Mattar P, D´ıaz X, Lavandero S, Cifuentes M. Calcium sensing receptor as a novel mediator of adipose tissue dysfunction: mechanisms and potential clinical implications. Front Physiol. 2016;7:395. 41. Xie J, Jiang Y, Kan Y, Zhao J, Kuang H, Ge P. Calcium-sensing receptor is involved in the pathogenesis of fat emulsion-induced insulin resistance in rats. Mol Med Rep. 2015;12(2):2043–2048. 42. Berger M, Scheel DW, Macias H, Miyatsuka T, Kim H, Hoang P, Ku GM, Honig G, Liou A, Tang Y, Regard JB, Sharifnia P, Yu L, Wang J, Coughlin SR, Conklin BR, Deneris ES, Tecott LH, German MS. Gai/o-coupled receptor signaling restricts pancreatic b-cell expansion. Proc Natl Acad Sci USA. 2015;112(9):2888–2893. 43. Walls GV, Reed AA, Jeyabalan J, Javid M, Hill NR, Harding B, Thakker RV. Proliferation rates of multiple endocrine neoplasia type 1 (MEN1)-associated tumors. Endocrinology. 2012;153(11): 5167–5179. 44. Butler AE, Janson J, Bonner-Weir S, Ritzel R, Rizza RA, Butler PC. b-cell deficit and increased b-cell apoptosis in humans with type 2 diabetes. Diabetes. 2003;52(1):102–110. 45. Ashcroft FM, Rorsman P. K(ATP) channels and islet hormone secretion: new insights and controversies. Nat Rev Endocrinol. 2013;9(11):660–669. 46. Braun M, Ramracheya R, Bengtsson M, Zhang Q, Karanauskaite J, Partridge C, Johnson PR, Rorsman P. Voltage-gated ion channels in human pancreatic b-cells: electrophysiological characterization and role in insulin secretion. Diabetes. 2008;57(6):1618–1628. 47. Parkash J. Glucose-mediated spatial interactions of voltage dependent calcium channels and calcium sensing receptor in insulin producing b-cells. Life Sci. 2011;88(5-6):257–264. 48. Briant L, Salehi A, Vergari E, Zhang Q, Rorsman P. Glucagon secretion from pancreatic a-cells. Ups J Med Sci. 2016;121(2):113–119. 49. Li Z, Karlsson FA, Sandler S. Islet loss and a cell expansion in type 1 diabetes induced by multiple low-dose streptozotocin administration in mice. J Endocrinol. 2000;165(1):93–99.