applied sciences Article
Na-Doping Effects on Thermoelectric Properties of Cu2−xSe Nanoplates Yingshi Jin, Mi-Kyung Han * and Sung-Jin Kim * Department of Chemistry and Nano Science, Ewha Womans University, Seoul 120-750, Korea;
[email protected] * Correspondence:
[email protected] (M.-K.H.);
[email protected] (S.-J.K.); Tel.: +82-23-277-4164 (M.-K.H. & S.-J.K.) Received: 23 November 2017; Accepted: 20 December 2017; Published: 22 December 2017
Abstract: For this work, a β-phase Cu2−x Se nanowire and nanoplate, and a Na-doped Cu2−x Se nanoplate were successfully synthesized using solution syntheses. The morphologies of the Cu2−x Se nanowire and nanoplate could be easily controlled by changing the synthetic condition. The Na-doped Cu2−x Se nanoplate was prepared by a simple treatment of the Cu2−x Se nanoplate with a sodium hydroxide-ethylene glycol solution. The nanopowders were then consolidated to bulk materials using spark plasma sintering (SPS). The phase structure and the microstructure of all of the samples were checked using X-ray diffraction (XRD), high-resolution transmission electron microscope (HR-TEM), and scanning electron microscope (SEM) analyses. The thermoelectric transport properties, such as the electrical conductivity, Seebeck coefficient, carrier concentration, carrier mobility, and thermal conductivity, were measured at temperature ranges from 323 to 673 K. The results show that Na played two important roles: one is reducing the carrier concentration, thereby improving the Seebeck coefficient, the other is reducing the thermal conductivity. Overall, the maximum thermoelectric figure of merit (ZT) of 0.24 was achieved at 673 K in the Na-doped Cu2−x Se nanoplate. Keywords: Cu2−x Se; doping; thermoelectric properties
1. Introduction Thermoelectrics (TEs) is one of the most fascinating topics in the field of sustainable energy utilization due to its ability of direct conversion between electricity and heat based on either Seebeck or Peltier effects [1–3]. The efficiency of thermoelectric conversion is mostly dependent on the materials’ dimensionless figure of merit (ZT) that is defined as ZT = (S2 σ/κ tot )T, where S is the Seebeck coefficient (or thermopower), σ is the electrical conductivity, κ tot is the thermal conductivity (κ tot = κ elec. + κ latt . , where κ elec . and κ latt . are the electronic and lattice contributions, respectively), and T is the temperature in Kelvin [4]. High-performance TE materials require a large Seebeck coefficient, low thermal conductivity, and high electrical conductivity. It is difficult, however, to concurrently improve all of the parameters because these three parameters are interrelated by carrier concentration. Recently, several strategies and concepts indicated that higher ZT values could be obtained in nanomaterials by a tailoring of the band structure and the phonon scattering [5–11]. Therefore, the pursuit of different TE materials using low-dimensional systems has recently become an active research field. Recently, the copper chalcogenides Cu2−x Q (Q = S, Se, Te) have attracted great attention as a promising TE material due to not only their exceptional thermal- and electrical-transport properties, but also their unique features of being environmentally benign, earth-abundant composition, and low cost. Therefore, they can be a potential candidate as a medium-temperature thermoelectric material. ZT > 2 has been identified in these binary copper chalcogenides. (ZT values of 1.7–1.9 for Cu2−x S [12–18], 1.3–2.1 for Cu2−x Se [14–17], and 0.3–1.1 for Cu2−x Te [18–20]). Chemical doping Appl. Sci. 2018, 8, 12; doi:10.3390/app8010012
www.mdpi.com/journal/applsci
Appl. Sci. 2018, 8, 12
2 of 10
has been widely adopted to tune the carrier concentration and improve the ZT of thermoelectric materials [21–27]. Following this idea, in the present study, Cu2−x Se nanocrystals were successfully synthesized via an aqueous approach. The morphologies of Cu2−x Se can be tunable from plate to wire by changing synthetic conditions. A sodium doped Cu2−x Se nanoplate was prepared. After consolidating the nanopowders using spark plasma sintering (SPS), an evaluation of the thermoelectric properties was performed. 2. Materials and Methods 2.1. Materials All of the reagents were used as received without further purification. Selenium powder (~100 mesh, 99.5%, Sigma Aldrich, St. Louis, MO, USA), sodium hydroxide (98%, Sam-Chun Pure Chemicals, Pyeongtaek, Korea), copper nitrate 3-hydrate (99~104%, Sigma Aldrich, USA), hydrazine hydrate (50~60%, Sigma Aldrich, USA), ethylene glycol (99.5%, Duksan Pure Chemicals, Ansan, Korea) and distilled water were used for the synthesis. 2.2. Synthesis of Cu2−x Se Nanoplate and Nanowire Cu2−x Se was synthesized with different morphologies according to the method reported by Xu et al. with a slight modification [28]. For the synthesis of the Cu2−x Se nanoplate, 0.02 mol of Se powder, 1.25 mol of NaOH, and 8.00 mL N2 H4 ·H2 O were dissolved in 200 mL of distilled water. The solution was heated to 373 K and held there for 1 h to completely dissolve the selenium powder, thereby forming a clear deep red colored solution. Then, 15.39 mL of a 0.5 M Cu(NO3 )2 aqueous solution was quickly added to the selenium precursor solution and kept for 30 min under this condition. The as-obtained product was washed with distilled water several times, and then dried under a vacuum at room temperature. For the Cu2−x Se nanowire, 0.02 mol of Se powder, 1.25 mol of NaOH, and 8.00 mL of N2 H4 ·H2 O was dissolved in 50 mL of distilled water, and followed the same procedure used in the case of Cu2−x Se nanoplates except heating the solution for 1 h at 373 K after injecting the Cu source. 2.3. Synthesis of Na-Doped Cu2−x Se Nanoplate Sodium was incorporated via the following step: the as-synthesized Cu2−x Se nanoplate (2.6 g) were reacted with sodium hydroxide-ethylene glycol solution (3.1 M) under vigorous stirring at 413 K for 24 h. Finally, the products were collected by centrifugation after a number of washing procedures with acetone and ethanol. 2.4. Characterization of Materials The synthesized samples were characterized using powder X-ray diffraction (PXRD), scanning electron microscope (SEM), high-resolution transmission electron microscope (HR-TEM), and inductively coupled plasma-optical emission spectroscope (ICP-OES) analyses. The PXRD patterns were obtained with a Rigaku powder X-ray Diffractometer (Rigaku Co., Shibuya-Ku, Tokyo, Japan) using Cu-Kα radiation (λ = 1.5418 Å) at 40 kV and 30 mA with the 2θ range from 20◦ to 80◦ . The diffraction data were collected at a scanning rate of 2 ◦ /min. The SEM images were investigated using a JEOL JSM-6700F (JEOL Ltd., Tokyo, Japan) at an accelerating voltage of 10 kV. The TEM images, selected area electron diffraction (SAED) pattern and energy-dispersive X-ray spectroscopy mapping (EDS-mapping) were recorded on a JEOL JEM-2100F instrument (JEOL Ltd., Tokyo, Japan). The chemical compositions were collected by ICP-OES using an OPTIMA 8300 (PerkinElmer, Inc., Waltham, MA, USA). 2.5. Characterization of the Thermoelectric Properties In order to measure thermoelectric properties, pellets with a diameter of ~10 mm and a thickness of ~2 mm were fabricated using the spark plasma sintering (SPS-211lx, Fuji Electronic Industrial Co.,
Appl. Sci. 2018, 8, 12
3 of 10
Ltd.,Appl. Osaka, Japan). Sci. 2018, 8, 12 Typically, ~2 g of the powder was loaded in a graphite die with an inner3diameter of 10 of 10 mm. The powder was heated to the 450 ◦ C at a heating rate of 100 ◦ C/min under the conditions Ltd., Osaka, Typically, ~2 g of the wasand loaded a graphite diewas with5an inner of vacuum andJapan). at a uniaxial pressure of powder ~50 MPa, the in holding time min at diameter the sintering of 10 mm. The powder was heated to the 450 °C at a heating rate of 100 °C/min under the conditions temperature. The electrical conductivity and the Seebeck coefficient were measured under a low-pressure of vacuum and at a uniaxial pressure of ~50 MPa, and the holding time was 5 min at the sintering helium atmosphere using ZEM-3 equipment (Ulvac-Riko, ULVAC Inc., Yokohama, Kanagawa, Japan). temperature. The electrical conductivity and the Seebeck coefficient were measured under a lowThermal conductivity was determined by combining thermal diffusivity (D), specific heat (Cp ) and pressure helium atmosphere using ZEM-3 equipment (Ulvac-Riko, ULVAC Inc., Yokohama, sample densityJapan). (ρ) according κtot = D × Cwas The thermal and specific heat(D), (Cp ) of p × ρ. Kanagawa, Thermaltoconductivity determined by diffusivity combining (D) thermal diffusivity the specific samplesheat were using a NETZSCH LFA MicroFlash™ instrument (NETZSCH, Selb, (Cp)measured and sample density (ρ) according to κ457 tot = D × Cp × ρ. The thermal diffusivity (D) and Germany) under a vacuum atmosphere. The ρ was measured using geometry and mass. specific heat (Cp) of the samples were measured using a NETZSCH LFAthe 457sample’s MicroFlash™ instrument Generally, the uncertainties of the electrical conductivity, Seebeck coefficient, and thermal conductivity (NETZSCH, Selb, Germany) under a vacuum atmosphere. The ρ was measured using the sample’s are geometry estimated and to bemass. approximately 5% and 7%, respectively. Theconductivity, uncertainty of ZT is tocoefficient, be about 20%. Generally, 7%, the uncertainties of the electrical Seebeck conductivity are estimated to be approximately 7%, 5% and 7%, (PPMS respectively. The Theand Hallthermal resistivity was measured using a physical property measurement system Dynacool-14T, uncertainty of ZT to be about 20%. The Hall resistivity was measured using a physical property Quantum Design, Sanis Diego, CA, USA). measurement system (PPMS Dynacool-14T, Quantum Design, San Diego, CA, USA).
3. Results and Discussion 3. Results and Discussion
Intensity (arbitary units)
(022)
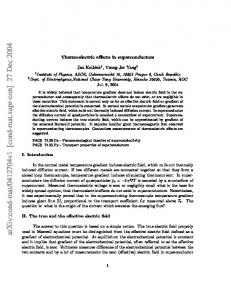
The XRD patterns of the as-synthesized samples of undoped Cu2−x Se nanowire and nanoplate The XRD of the as-synthesized samples of undoped Cu2−xSe nanowire and nanoplate and Na-doped Cupatterns 2−x Se nanoplate are shown in Figure 1. All of the reflection peaks can be indexed to and Na-doped Cu2−xSe nanoplate are shown in Figure 1. All of the reflection peaks can be indexed to the face-centered-cubic Cu1.8 Se (JCPDS 71-0044), and no impurities were detected within the detection the face-centered-cubic Cu1.8Se (JCPDS 71-0044), and no impurities were detected within the detection limit of the X-ray. The peaks for Cu2−x Se nanowire sample are quite broad mainly due to the finite limit of the X-ray. The peaks for Cu2−xSe nanowire sample are quite broad mainly due to the finite sizesize of our products. constantscan can refined a = 5.674 (1), 5.737 and(1)5.738 of our products.The The lattice lattice constants bebe refined as aas = 5.674 (1), 5.737 (1) and(1) 5.738 Å for(1) Å for nanowire, nanowire, nanoplate nanoplateand andNa-doped Na-dopednanoplate nanoplate Cu Se samples, respectively, which match 2−xsamples, respectively, which match the the Cu2−xSe literature value listed on JCPDS Card No. 71-0044 well. concludedthat thatthe thelattice latticeconstant constant of literature value listed on JCPDS Card No. 71-0044 well. It It can can be be concluded + the of as-synthesized nanopowders is unchanged upon NaNa doping. This implies the as-synthesized nanopowders is unchanged upon doping. This impliesthat thatCu Cu+(0.077 (0.077 nm) nm) ions are ions not substituted by much Na+ (0.133 nm) ions in this experimental condition. AA similar are not substituted by larger much larger Na+ (0.133 nm) ions in this experimental condition. similarresult was observed Na wasindoped in a of system Cu9SOn 5 [29]. the hand, other hand, Na-doped wasresult observed when Nawhen was doped a system Cu9 Sof theOn other Na-doped Cu2−x Se 5 [29]. Cu 2−x Se shows a peak shift in comparison with the pattern of as-synthesized Na-doped 2−xSe shows a peak shift in comparison with the pattern of as-synthesized Na-doped Cu2−x Se Cu nanoplates nanoplates after the (refer SPS process thepeaks). inset 002 peaks). The lattice constants for Na-doped after the SPS process to the (refer inset to 002 The lattice constants for Na-doped nanoplate nanoplate Cu 2−xSe samples after SPS is 5.766 (9) Å. This small lattice expansion (~5%) may be the Cu2−x Se samples after SPS is 5.766 (9) Å. This small lattice expansion (~5%) may be the result of Na result of Na incorporation into the structure of Cu2−xSe by electrochemical reactions at the interfaces incorporation into the structure of Cu2−x Se by electrochemical reactions at the interfaces during the during the SPS process. Rather than the shift peak position, the SPS process did not significantly modify SPS process. Rather than the shift peak position, the SPS process did not significantly modify the the crystal structure of nanoplate and Na-doped nanoplate sample. However, the structural changes crystal structure of nanoplate and Na-doped nanoplate sample. However, the structural changes occur occur for nanowire samples from cubic to orthorhombic Cu2−xSe after SPS treatment, although they were for sintered nanowire samples from cubic to(i.e., orthorhombic Cu2and SPS although they were −x Se under the same conditions 450 °C, 50 MPa, 5 after min) by thetreatment, SPS technique. ◦ sintered under the same conditions (i.e., 450 C, 50 MPa, and 5 min) by the SPS technique.
Na-doped nanoplate
After SPS nanoplate
20
30
40
Before SPS
50
2 theta (deg.)
(004)
60
(133)
JCPDS 71-0044 (113)
(022)
(111)
nanowire
70
Na-doped nanoplate
80
42 44 46 48
Figure 1. Powder X-raydiffraction diffraction(XRD) (XRD) patterns patterns of samples of nanowire, nanoplate Figure 1. Powder X-ray ofas-synthesized as-synthesized samples of nanowire, nanoplate 2−xSe compared with those of the standard cards (JCPDS 71-0044). The and Na-doped nanoplate Cu and Na-doped nanoplate Cu2−x Se compared with those of the standard cards (JCPDS 71-0044). thethe comparison of peak position for as-synthesized (dashed (dashed line) and line) after and SPSed (solid Theinset insetshows shows comparison of peak position for as-synthesized after SPSed line) samples of Na-doped Cu2−xSe nanoplate. (SPS: spark plasma sintering) (solid line) samples of Na-doped Cu2−x Se nanoplate. (SPS: spark plasma sintering)
Appl. Sci. 2018, 8, 12 Appl. Sci. 2018, 8, 12
4 of 10 4 of 10
tothe theHall Hallcoefficient coefficientmeasurements, measurements, carrier concentrations of nanoplate According to thethe carrier concentrations of nanoplate and and Na3 3and 3, 3respectively. Na-doped nanoplate estimatedtotobe be5.71 5.71 × × 10 102222/cm /cm and2.80 2.80 ××10 102222/cm /cm , respectively.Na Na doping doped nanoplate areare estimated Se.This Thismeans meansthat thatNa Naacts acts as as an an electron electron donor donor to the reduce the carrier carrier concentration concentration of of Cu Cu22−x −xSe. The generated generated electrons electrons by by Na Na recombine recombine with with holes, holes, resulting resulting in a decrease of the hole nanoplate. The concentration by the electron–hole pairs [30]. This is consistent with the observed observed decreased electrical Senanoplates nanoplatesshown shown in in the the next section. As expected, Na-doped conductivity in Na-doped Na-doped Cu Cu22−x −xSe nanoplate showed a lower carrier mobility than an undoped nanoplate due to the higher carrier concentration. The Thecarrier carriermobility mobility nanoplate and Na-doped nanoplate were estimated be concentration. ofof nanoplate and Na-doped nanoplate were estimated to beto0.96 0.96 1.32 and 1.32 cm2respectively. /Vs, respectively. and cm2/Vs, Sewith withdifferent differentshapes shapeswere wereachieved achieved under under different different conditions In our synthetic process, process, Cu Cu22−x −xSe (see Experimental Section Section for for details). details). Figure Figure 22shows showsthe themorphologies morphologiesofofthe theas-obtained as-obtainedCu Cu 2−x 2− x Se observed by SEM. It was found that the morphology of products depends on the concentration of very clearly clearly known known at at present present why why reaction reaction concentration concentration reactants and the reducing reagent. It is not very significantly. One possible reason may be that the concentration affects can change the morphologies significantly. Se nanoplate with a the growth rate of of crystals crystals [31]. [31]. Figure Figure 2a,b 2a,b display displaythe theSEM SEMimages imagesof ofthe theCu Cu2− 2−x xSe hexagonal morphology. morphology. In In general, general, the the lateral lateral dimensions dimensions of of the nanoplates nanoplates are are 1–3 µm. μm. The thickness of the nanoplate nanoplate was was about about ~50 ~50 nm, nm, shown shown in in aavertical verticalSEM SEMimage imageofofaasingle singleCu Cu 2−x 2− x Se nanoplate 2b). Figure Figure 2c,d 2c,d show show SEM SEM images imagesof ofCu Cu22−x Se nanowire with lengths larger than (Figure 2b). Se nanowire with lengths ~30 μm µm and −x diameters of ~200 nm.
Figure 2. Scanning electron microscope (SEM) images of (a,b) nanoplate; and (c,d) nanowire of Figure 2. Scanning electron microscope (SEM) images of (a,b) nanoplate; and (c,d) nanowire of Cu2−xSe powder. Cu2−x Se powder.
Figure 3a shows the SEM images of Na-doped Cu2−xSe nanoplates. The size and shape of NaFigure 3a shows the SEM images of Na-doped Cunanoplate. sizeofand shapeNaof 2−x Se nanoplates. doped nanoplate are similar to those of undoped Cu2−xSe The TEMThe image a typical Na-doped nanoplate are similar to those of undoped Cu Se nanoplate. The TEM image of a typical 2 − x doped Cu2−xSe nanoplate is shown in Figure 3b, where a hexagonal shaped nanoplate can be clearly Na-doped The Cu2−inset is shown in Figure 3b, wherediffraction a hexagonal shaped nanoplate be x Se nanoplate identified. of Figure 3b is a selected-area electron pattern taken along thecan [111] clearly identified. The inset showing of Figure the 3b is a selected-area electron taken the direction of the nanoplate, single crystallinity of the diffraction nanoplate.pattern To check the along chemical [111] direction of the nanoplate, showing the single crystallinity of the nanoplate. To check the chemical composition of the Cu2−xSe samples, energy-dispersive spectroscopy (EDS) and inductively coupled composition of the Cu2−x Se samples, energy-dispersive spectroscopy coupled plasma optical emission spectroscopy (ICP-OES) are performed. The(EDS) resultand of inductively elemental-mapping plasma optical emission spectroscopy (ICP-OES) performed. Theofresult of elemental-mapping using the TEM-EDS analysis is shown in Figure 3c.are The distributions the elements Cu, Se, and Na are homogeneous in Na-doped Cu2−xSe nanoplate. About ~16% of Na was detected in Na-doped Cu2−xSe nanoplate. Similar results were observed by inductively coupled plasma optical emission
Appl. Sci. 2018, 8, 12
5 of 10
using the TEM-EDS analysis is shown in Figure 3c. The distributions of the elements Cu, Se, and Na are homogeneous in Na-doped Cu2−x Se nanoplate. About ~16% of Na was detected in Na-doped Appl. Sci. 2018, 8, 12 5 of 10 Cu2−x Se nanoplate. Similar results were observed by inductively coupled plasma optical emission spectroscopy (ICP-OES), (ICP-OES), shown shown in in Table Se nanoplate nanoplate xSe spectroscopy Table 1. 1. The The atomic atomic ratio ratio of of Cu Cu and and Se Sefor forCu Cu2− 2−x calculated from the ICP-OES results is around 63.7:36.3, whereas the Na-doped Cu Se nanoplate has −xSe nanoplate has calculated from the ICP-OES results is around 63.7:36.3, whereas the Na-doped Cu22−x atomic ratio ratio between between Cu:Se Se nanoplate nanoplate xSe atomic Cu:Se of of around around 63.6:31.3, 63.6:31.3, which which means meansthat thatthe theNa-doped Na-dopedCu Cu2− 2−x we got through the two-step procedure is the Cu-rich Cu Se phase. −Se x phase. we got through the two-step procedure is the Cu-rich Cu22−x
Figure Figure 3. 3.(a) (a)SEM SEMimage; image;(b) (b)Transmission Transmissionelectron electron microscope microscope (TEM) (TEM) image image with with selected selected area area electron electron 2−xSe nanoplates; (c) the corresponding mapping on diffraction (SAED) patterns (inset) for Na-doped Cu diffraction (SAED) patterns (inset) for Na-doped Cu2−x Se nanoplates; (c) the corresponding mapping compositions by an spectrometer (EDS) for Na-doped Cu2−xCu Se nanoplate. on compositions byenergy-dispersive an energy-dispersive spectrometer (EDS) for Na-doped Se nanoplate. 2−x
Table 1. Atomic ratio of Cu, Se, and Na for Cu2−xSe calculated from ICP-AES. Table 1. Atomic ratio of Cu, Se, and Na for Cu2−x Se calculated from ICP-AES.
Sample Cu2−xSe-wire Cu2−xCu Se-wire 2−xSe-plate Cu2−x Se-plate Na-Cu2−xSe-plate
Na - 0.051
Sample
Na
Na-Cu2−x Se-plate
0.051
Cu Cu 0.613 0.613 0.637 0.637 0.636 0.636
Se 0.397 Se 0.363 0.397 0.313 0.363 0.313
Composition Composition Cu1.59 Se Cu1.59 Se Cu1.75Se 1.75 Se Na0.162CuCu 2.03Se
Na0.162 Cu2.03 Se
The SPS pressed Na-doped Cu2−xSe bulk sample was also characterized by X-ray photoelectron The SPS pressed Na-doped Cu2−x Se bulk sample also characterized by X-ray photoelectron spectroscopy (XPS). The XPS spectra provide useful was information for understanding the chemical spectroscopy (XPS). The XPS spectra provide useful information for understanding the chemical bonding states of the constituent atoms. The binding energies obtained in the XPS analysis were bonding states of the constituent The binding energies obtained in XPS the XPS analysis corrected for specimen charging byatoms. a setting C 1s to 284.6 eV. Representative spectra of Na,were Cu, corrected for specimen charging by a setting C 1s to 284.6 eV. Representative XPS spectra of Na, Cu, and Se are shown in Figure 4. As shown in Figure 4b, one strong peak located at 1071.7 eV, indicative and are shown inthe Figure 4. As of shown in Figure 4b, one strong located at 1071.7 eV, indicative of NaSe1s, suggested existence Na+ species in Na-doped Cu2−xpeak Se nanoplates. As shown in Figure + species in Na-doped Cu of Na 1s, suggested the existence of Na Se nanoplates. As shown in 2 − x 4c,d, the resulted binding energies of Se 3d and Cu 2p3/2 are given as 54.0 and 933.4 eV, respectively. Figure 4c,d, the resulted binding energies of Se 3d and Cu 2p are given as 54.0 and 933.4 eV, All of the observed binding energy values for Cu 2p and Se 3d3/2 are nearly in agreement with the respectively. of the observed binding energy values for Cu 2p and Se nearly in agreement reported dataAll in the literature [30]. In the literature, the binding energy of 3d Cuare 2p3/2 has been reported 0 1+ 2+ with the reported data in the literature [30]. In the literature, the binding energy of Cu 2p has to be ~933 eV regardless of its oxidation state (Cu , Cu and Cu ) [31,32]. Generally, Cu2+ 3/2 is best 0 , Cu1+ and Cu2+ ) [31,32]. Generally, been reported to be ~933 eV regardless of its oxidation state (Cu distinguished from other Cu oxidation states by observing low-intensity satellite peaks in the region 2+ is best distinguished from other Cu oxidation states by observing low-intensity satellite Cu940–950 of eV. According to Figure 4c, the satellite peaks indicate that the presence of Cu2+ ion inpeaks bulk in the region of 940–950 eV. According to Figure 4c, the satellite peaks indicate that the presence of Na-doped Cu2−xSe nanoplates. A significant broadening of the Se 3d spectra is observed, as shown in Figure 4d. Similar features were previously found in InSe compounds upon Na deposition [33].
Appl. Sci. 2018, 8, 12
6 of 10
Cu2+ ion in bulk Na-doped Cu2−x Se nanoplates. A significant broadening of the Se 3d spectra is observed, as shown in Figure 4d. Similar features were previously found in InSe compounds upon Na Appl. Sci. 2018, 8, 12 6 of 10 deposition [33].
(a)
Na 1s
(b)
Na 1s
Cu 2p Intensity (a.u.)
Intensity (a.u.)
O 1s
C 1s Se 3d
1200
1000
800
600
400
200
0
1080
Binding Energy (eV)
(c)
1075
1070
1065
Binding Energy (eV)
Cu 2p3/2
(d) Se 3d
Intensity (a.u.)
Intensity (a.u.)
Cu 2p1/2
970
960
950
940
Binding Energy (eV)
930
60
55
50
45
Binding Energy (eV)
Figure Figure4.4.(a) (a)X-ray X-rayphotoelectron photoelectronspectroscopy spectroscopy(XPS) (XPS)survey surveyspectra, spectra,and andhigh-resolution high-resolutionXPS XPSspectra spectra ofof(b) Se sample. (b)Na; Na;(c) (c)Cu; Cu;and and(d) (d)SeSeions ionsofofSPSed SPSedNa-doped Na-dopedCu Cu 2−x 2−x
Figure5 shows 5 shows electrical and thermal properties SPSed bulk pellets of nanoplate, nanowire, Figure the the electrical and thermal properties of SPSedofbulk pellets of nanowire, nanoplate, and Na-doped Cu 2−x Se nanoplate, and compared to that of bulk Cu 1.75 Se sample [32]. and Na-doped Cu2−x Se nanoplate, and compared to that of bulk Cu1.75 Se sample [32]. For all For of all samples, of the samples, theofincrease of the temperature, electrical conductivity decreases, the with the with increase the temperature, the electricalthe conductivity decreases, indicating a indicating a degenerated semiconductor behavior, shown in Figure 5a. The electrical conductivity degenerated semiconductor behavior, shown in Figure 5a. The electrical conductivity of SPSed bulkof SPSedofbulk pelletsisof nanowire is relatively of the other two samples, which pellets nanowire relatively lower than thoselower of thethan otherthose two samples, which is mainly due to theis mainly due to thedefects presence point defects vacancies thelower pelletsymmetry. along with presence of point andofdislocations byand Cu dislocations vacancies inby theCu pellet along in with lower symmetry. Compared to the bulk, the undoped Cu 2−x Se nanoplates exhibited a similar electrical Compared to the bulk, the undoped Cu2−x Se nanoplates exhibited a similar electrical conductivity. conductivity. It is observed that a Na doped Cu 2−x Se nanoplate sample shows lower electrical It is observed that a Na doped Cu2−x Se nanoplate sample shows lower electrical conductivity than than a Cu 2−xSe nanoplate sample. The reason for reduction this may be of the carrier aconductivity Cu2−x Se nanoplate sample. The reason for this may be the ofthe thereduction carrier concentration concentration by Na-doping. by Na-doping. Figure5b 5bshows showsthe thetemperature temperaturedependences dependencesofofthe theSeebeck Seebeckcoefficients. coefficients.All Allsamples samplespossess possess Figure a positive Seebeck coefficient in the measured temperature range. This means that the 2−xSe a positive Seebeck coefficient in the measured temperature range. This means that the CuCu 2−x Se samples exhibit p-type conduction and the majority carriers are holes, which is consistent with the samples exhibit p-type conduction and the majority carriers are holes, which is consistent with the Hall Hall measurements. It seen can be that the coefficients Seebeck coefficients increase 10 to 70 increasing μV/K with measurements. It can be thatseen the Seebeck increase from 10 to from 70 µV/K with increasing temperature. It is observed that Na doped Cu 2−x Se nanoplate sample shows slightly temperature. It is observed that Na doped Cu2−x Se nanoplate sample shows a slightly higheraSeebeck higher Seebeck coefficient than that of the undoped Cu 2−x Se nanoplate sample. This result canthe be coefficient than that of the undoped Cu2−x Se nanoplate sample. This result can be attributed to attributed toconcentration the lower carrier concentration by Na doping. lower carrier by Na doping. Based on the results of the electrical conductivity andthe theSeebeck Seebeckcoefficient, coefficient,the thepower powerfactor factor Based on the results of the electrical conductivity and 2. As shown in Figure 5c, 2 (PF) of all of the samples can be calculated according to the equation PF = σS (PF) of all of the samples can be calculated according to the equation PF = σS . As shown in Figure 5c, thepower power factor increases as temperature increases dueincreased to the values increased values coefficients. of Seebeck the factor increases as temperature increases due to the of Seebeck coefficients. Because of a high electrical conductivity, the maximum power factor of the undoped Because of a high electrical conductivity, the maximum power factor of the undoped Cu2−x Se nanoplate 2 Cu2−xSe nanoplate is 6.5 μW/cmK (at ~673 K). A Na-doped Cu2−xSe nanoplate has a slightly lower PF when compared to the Cu2−xSe nanoplate. The peak PF values of 3.9 μW/cmK2 (at ~673 K) was observed for the Na-doped Cu2−xSe nanoplate. This lower PF is mainly owing to the lower electrical conductivity of Na-doped Cu2−xSe nanoplate samples.
Appl. Sci. 2018, 8, 12
7 of 10
is 6.5 µW/cmK2 (at ~673 K). A Na-doped Cu2−x Se nanoplate has a slightly lower PF when compared to the Cu2−x Se nanoplate. The peak PF values of 3.9 µW/cmK2 (at ~673 K) was observed for the Na-doped Cu2−x Se nanoplate. This lower PF is mainly owing to the lower electrical conductivity of Na-doped −x Se nanoplate samples. Appl. Sci. 2018,Cu 8, 212 7 of 10
( )
) (
wire plate Na-doped plate Cu1.75Se-Bulk
0 4 0 3
0 0 0 4
0 2
0 0 0 2
0 1
)
( )
wire plate Na-doped plate Cu1.75Se-Bulk Klatt of plate Klatt of Na-doped plate
)
3
(
0 0 7
4 2
r o t c a F r e w o P
0 0 6K
5
9876543210
6
K m / W
210 111
7
(d) wire plate Na-doped plate Cu1.75Se-Bulk
e 0r 0u t 5a r e p m
K
8
( )
0 0e 4T
0 0 7
0 0 6
e r 0u 0t 5a r e p m e T
0 0 4
0 0 3
0 0 3 0
0
t n e i c i f f e o C k c e b e e S
0 5
k l u b e S
5 7 .
0 0 0 6
K m c / W
K / V
0 6
a N e S
x -
0 0 0 8
2
(b)
0 7
x -
e t a l p e S
wire plate Na-doped plate Cu1.75Se-Bulk
0 0 0 0 1
y t i v i t c u d n o C l a c i r t c e l E
(c)
e r i w e S
x -
u2 u2 u2 u1 C C C C
m c / S
0 8
0 0 0 2 1
(a)
1
(
t t a
Kl
0
0 0 7
0 0 6
K
K
e r 0u 0t 5a r e p m e T
0 0 4
0 0 3
0 0 7
0 0 6
e r 0u 0t 5a r e p m e T
0 0 4
0 0 3
( )
( )
Figure 5. Temperature dependent thermoelectric thermoelectric properties nanowire, nanoplate nanoplate and Na-doped Figure 5. Temperature dependent properties of of nanowire, and Na-doped 2−xSe samples: (a) electrical conductivity; (b) Seebeck coefficient; (c) Power factor; (d) nanoplate Cu nanoplate Cu2−x Se samples: (a) electrical conductivity; (b) Seebeck coefficient; (c) Power factor; thermal conductivity along withwith the the lattice contribution to the thermal conductivities. Solid dotsdots are (d) thermal conductivity along lattice contribution to the thermal conductivities. Solid experimental datadata in this work, while open dotsdots are are bulkbulk Cu1.75 fromfrom reference [34].[34]. are experimental in this work, while open CuSe samples Se samples reference 1.75
As shown in Figure 5d, the thermal conductivity of all of the samples decreased gradually with As shown in Figure 5d, the thermal conductivity of all of the samples decreased gradually with increasing temperature. Owing to the α–β phase transition in Cu2−xSe compounds, an anomalous increasing temperature. Owing to the α–β phase transition in Cu2−x Se compounds, an anomalous behavior of thermal conductivity is observed near 373 K [35]. The thermal conductivities of the Nabehavior of thermal conductivity is observed near 373 K [35]. The thermal conductivities of doped Cu2−xSe samples are lower than that of the undoped Cu2−xSe nanoplate sample. The total the Na-doped Cu2−x Se samples are lower than that of the undoped Cu2−x Se nanoplate sample. thermal conductivity (κtot) is the sum of two contributions, one from the charge carriers (κelec.), and the The total thermal conductivity (κ tot ) is the sum of two contributions, one from the charge other from the lattice vibrations (κlatt.), (κtot = κelec. + κlatt.). Here κelec. is estimated by the Wiedemann– carriers (κ elec. ), and the other from the lattice vibrations (κ latt. ), (κ tot = κ elec. + κ latt. ). Here κ elec . is Franz relationship, κelec. = L0σT, where L0 is the Lorenz number, σ is the electrical conductivity and T estimated by the Wiedemann–Franz relationship, κ elec. = L0 σT, where L is the Lorenz number, the absolute temperature. The value of Lorenz number (L0 = 1.5 × 10⁻⁸ WΩ/K02) [35] for Cu2−xSe is used σ is the electrical conductivity and T the absolute temperature. The value of Lorenz number to estimate κelec. . The κlatt. values are calculated by subtracting κelec. from κtot, present in Figure 5d. The (L0 = 1.5 × 10⁻⁸ WΩ/K2 ) [35] for Cu2−x Se is used to estimate κ elec . . The κ latt. values are calculated by κlatt. values of undoped and Na-doped Cu2−xSe at 300 K are ~3.03 W/m·K and ~0.83 W/m·K, subtracting κ from κ , present in Figure 5d. The κ values of undoped and Na-doped Cu2−x Se respectively. elec. Regardlesstotof the exact mechanism, Nalatt. appears to play a role in lowering the lattice at 300 K are ~3.03 W/m·K and ~0.83 W/m·K, respectively. Regardless of the exact mechanism, thermal conductivity. Na appears to play a role in lowering the lattice thermal conductivity. According to the above measured results of electrical conductivity, the Seebeck coefficient and According to the above measured results of electrical conductivity, the Seebeck coefficient and the thermal conductivity, the dimensionless figure of merit ZT can be calculated using the formula the thermal conductivity, the dimensionless figure of merit ZT can be calculated using the formula ZT = S2σT/κ, as shown in Figure 6. It can be seen that the ZT values of all of the samples were increased ZT = S2 σT/κ, as shown in Figure 6. It can be seen that the ZT values of all of the samples were with the increasing temperature. Benefiting from the carrier concentration optimization and low thermal conductivity, the Na-doped Cu2−xSe shows the highest ZT value among all of the samples over the entire temperature range. The maximum ZT value of 0.24 was obtained at 673 K for a Nadoped Cu2−xSe sample, which is greater than those of undoped Cu2−xSe nanowire and nanoplate. It indicates that Na doping can indeed increase the figure of merit of the Cu2−xSe nanoplates.
Appl. Sci. 2018, 8, 12
8 of 10
increased with the increasing temperature. Benefiting from the carrier concentration optimization and low thermal conductivity, the Na-doped Cu2−x Se shows the highest ZT value among all of the samples over the entire temperature range. The maximum ZT value of 0.24 was obtained at 673 K for a Appl. Sci. 2018,Cu 8, 212 8 of 10 Na-doped −x Se sample, which is greater than those of undoped Cu2−x Se nanowire and nanoplate. It indicates that Na doping can indeed increase the figure of merit of the Cu2−x Se nanoplates. 4 2 . 0 x -
e r i w e S
u2 u2 u2 u1 C C C C
x -
a N e S
8 1 . 0
x -
e t a l p e S
1 2 . 0
k l u b e S
5 7 .
5 1 . 0 2 1 . 0 9 0 . 0
T Z
6 0 . 0 3 0 . 0 0 0 . 0 0 0 7
0 0 6K
e r 0u 0t 5a r e p m
0 0e 4T
0 0 3
( )
Figure 6. Temperature-dependent dimensionless figure of merit (ZT) for nanowire, nanoplate Figure 6. Temperature-dependent dimensionless figure of merit (ZT) for for nanowire, nanoplate andfrom Naand Na-doped Cu2−x Se nanoplate samples along with the data bulk Cu1.75 Se samples doped Cu2−x Se nanoplate samples along with the data for bulk Cu1.75Se samples from reference [34]. reference [34].
4. 4. Conclusions Conclusions Se nanowires and nanoplates have been successfully In In conclusion, conclusion, surfactant-free surfactant-free Cu Cu2−x 2−x Se nanowires and nanoplates have been successfully synthesized by an aqueous approach, and Na-doped Cu Cu2−xSe nanoplate was prepared by heat synthesized by an aqueous approach, and aa Na-doped 2−x Se nanoplate was prepared by heat treatment Se nanoplates in a sodium hydroxide-ethylene glycol solution at 413 K for 24 h. The treatment of ofCu Cu2−x 2−x Se nanoplates in a sodium hydroxide-ethylene glycol solution at 413 K for 24 h. decreasing carrier concentrations and electrical conductivities upon Na-doping indicateindicate that sodium The decreasing carrier concentrations and electrical conductivities upon Na-doping that cations act as an n-type dopant, which is a key for increasing Seebeck coefficient and sodium cations act as an n-type dopant, which is a key for increasing Seebeck coefficient anddecreasing decreasing electronic The ZT ZT value value of of 0.24 0.24 was was obtained obtainedat at673 673KKfrom fromNa-doped Na-dopedCu Cu2−xSe electronic thermal thermal conductivity. conductivity. The 2−x Se nanoplate, which is much higher than that of undoped Cu 2−xSe nanoplate (ZT ~ 0.09 at 673 K). This nanoplate, which is much higher than that of undoped Cu2−x Se nanoplate (ZT ~0.09 at 673 K). study provides a strategy for improvement of theofthermoelectric performances. This study provides a strategy for improvement the thermoelectric performances. Acknowledgments: Acknowledgments: This This research research was was supported supported by by the the National National Research Research Foundation Foundation of of Korea Korea (NRF) (NRF) Grant Grant funded by by the the Korean Korean Government (MSIP) (NRF-2015R1A5A1036133). funded Author Contributions: Contributions: All Allauthors authorsparticipated participated research, data analysis edition ofmanuscript. the manuscript. Author inin thethe research, data analysis andand edition of the MiMi-Kyung Sung-Jin Kim conceived and designed experiments; YingshiJin Jinperformed performedthe theexperiments; experiments; Kyung HanHan andand Sung-Jin Kim conceived and designed thethe experiments; Yingshi Mi-Kyung Han analyzed the data and wrote the paper. Mi-Kyung Han analyzed the data and wrote the paper. Conflicts of Interest: The authors declare no conflicts of interest. Conflicts of Interest: The authors declare no conflicts of interest.
References References 1. 1. 2. 2. 3.
3. 4. 4. 5. 6.
Snyder, G.J.; Toberer, E.S. Complex thermoelectric materials. Nat. Mater. 2008, 7, 105–114. [CrossRef] Snyder, G.J.; Toberer, E.S. Complex thermoelectric materials. Nat. Mater. 2008, 7, 105–114. [PubMed] Rowe, D.M. CRC Handbook of Thermoelectrics; CRC Press: New York, NY, USA, 1995. Rowe, D.M. CRC Handbook of Thermoelectrics; CRC Press: New York, NY, USA, 1995. Yang, L.; Chen, Z.-G.; Dargusch, M.S.; Zou, J. High performance thermoelectric materials: Progress and Yang, L.; Chen, Z.-G.; Dargusch, M.S.; Zou, J. High performance thermoelectric materials: Progress and their their applications. Adv. Energy Mater. 2017, doi:10.1002/aenm.201701797. applications. Adv. Energy Mater. 2017, 1701797. [CrossRef] Yang, L.; Chen, Z.-G.; Dargusch, M.S.; Zou, J. High performance thermoelectric materials: Progress and Bell, L.E. Cooling, heating, generating power, and recovering waste heat with thermoelectric systems. Science their applications. Adv. Energy Mater. 2017, 1701797, doi:10.1002/aenm.201701797. 2008, 321, 1457–1461. [CrossRef] [PubMed] Bell, L.E. Cooling, heating, generating power, and recovering waste heat with thermoelectric systems. Science 2008, 321, 1457–1461. Moshwan, R.; Yang, L.; Zou, J.; Chen, Z.-G. Eco-friendly SnTe thermoelectric materials: Progress and future challenges. Adv. Funct. Mater. 2017, 27, doi:10.1002/adfm.201703278. Zhang, Q.; Liao, B.L.; Lan, Y.C.; Lukas, K.; Liu, W.S.; Esfarjani, K.; Opeil, C.; Broido, D.; Chen, G.; Ren, Z.F. High thermoelectric performance by resonant dopant indium in nanostructured SnTe. Proc. Natl. Acad. Sci.
Appl. Sci. 2018, 8, 12
5. 6.
7.
8. 9.
10.
11. 12. 13.
14.
15. 16.
17. 18. 19. 20. 21. 22.
23. 24.
25.
9 of 10
Moshwan, R.; Yang, L.; Zou, J.; Chen, Z.-G. Eco-friendly SnTe thermoelectric materials: Progress and future challenges. Adv. Funct. Mater. 2017, 27. [CrossRef] Zhang, Q.; Liao, B.L.; Lan, Y.C.; Lukas, K.; Liu, W.S.; Esfarjani, K.; Opeil, C.; Broido, D.; Chen, G.; Ren, Z.F. High thermoelectric performance by resonant dopant indium in nanostructured SnTe. Proc. Natl. Acad. Sci. USA 2013, 110, 13261–13266. [CrossRef] [PubMed] Liu, W.; Tan, X.J.; Yin, K.; Liu, H.J.; Tang, X.F.; Shi, J.; Zhang, Q.J.; Uher, C. Convergence of Conduction Bands as a Means of Enhancing Thermoelectric Performance of n-Type Mg2 Si1−x Snx Solid Solutions. Phys. Rev. Lett. 2012, 108. [CrossRef] [PubMed] Wang, H.; Gibbs, Z.M.; Takagiwa, Y.; Snyder, G.J. Tuning bands of PbSe for better thermoelectric efficiency. Energy Environ. Sci. 2014, 7, 804–811. [CrossRef] Girard, S.N.; He, J.Q.; Zhou, X.Y.; Shoemaker, D.; Jaworski, C.M.; Uher, C.; Dravid, V.P.; Heremans, J.P.; Kanatzidis, M.G. High Performance Na-doped PbTe-PbS Thermoelectric Materials: Electronic Density of States Modification and Shape-Controlled Nanostructures. J. Am. Chem. Soc. 2011, 133, 16588–16597. [CrossRef] [PubMed] Rhyee, J.S.; Lee, K.H.; Lee, S.M.; Cho, E.; Kim, S.I.; Lee, E.; Kwon, Y.S.; Shim, J.H.; Kotliar, G. Peierls distortion as a route to high thermoelectric performance in In4 Se3 -delta crystals. Nature 2009, 459, 965–968. [CrossRef] [PubMed] Chen, Z.-G.; Han, G.; Yang, L.; Cheng, L.; Zou, J. Nanostructured thermoelectric materials: Current research and future challenge. Prog. Nat. Sci. 2012, 22, 535–549. [CrossRef] He, Y.; Day, T.; Zhang, T.S.; Liu, H.L.; Shi, X.; Chen, L.D.; Snyder, G.J. High thermoelectric performance in non-toxic earth-abundant copper sulfide. Adv. Mater. 2014, 26, 3974–3978. [CrossRef] [PubMed] Zhao, L.L.; Wang, X.L.; Fei, F.Y.; Wang, J.Y.; Cheng, Z.X.; Dou, S.X.; Wang, J.; Snyder, G.J. High thermoelectric and mechanical performance in highly dense Cu2−x S bulks prepared by a melt-solidification technique. J. Mater. Chem. A 2015, 3, 9432–9437. [CrossRef] Zhao, K.P.; Blichfeld, A.B.; Chen, H.Y.; Song, Q.F.; Zhang, T.S.; Zhu, C.X.; Ren, D.D.; Hanus, R.; Qiu, P.F.; Iversen, B.B.; et al. Enhanced thermoelectric performance through tuning bonding energy in Cu2 Se1−x Sx liquid-like materials. Chem. Mater. 2017, 29, 6367–6377. [CrossRef] Yang, L.; Chen, Z.G.; Han, G.; Hong, M.; Zou, Y.C.; Zou, J. High-performance thermoelectric Cu2 Se nanoplates through nanostructure engineering. Nano Energy 2015, 16, 367–374. [CrossRef] Gahtori, B.; Bathula, S.; Tyagi, K.; Jayasimhadri, M.; Srivastava, A.K.; Singh, S.; Budhani, R.C.; Dhar, A. Giant enhancement in thermoelectric performance of copper selenide by incorporation of different nanoscale dimensional defect features. Nano Energy 2015, 13, 36–46. [CrossRef] Yang, L.; Chen, Z.-G.; Han, G.; Hong, M.; Zou, J. Impacts of Cu deficiency on the thermoelectric properties of Cu2−x Se nanoplates. Acta Mater. 2016, 113, 140–146. [CrossRef] He, Y.; Zhang, T.S.; Shi, X.; Wei, S.H.; Chen, L.D. High thermoelectric performance in copper telluride. NPG Asia Mater. 2015, 7, e210. [CrossRef] Mallick, M.M.; Vitta, S. Realizing high figure-of-merit in Cu2 Te using a combination of doping, hierarchical structure, and simple processing. J. Appl. Phys. 2017, 122. [CrossRef] Kurosaki, K.; Goto, K.; Kosuga, A.; Muta, H.; Yamanaka, S. Thermoelectric and thermophysical characteristics of Cu2 Te-Tl2 Te pseudo binary system. Mater. Trans. 2006, 47, 1432–1435. [CrossRef] Ballikaya, S.; Chi, H.; Salvador, J.R.; Uher, C. Thermoelectric properties of Ag-doped Cu2 Se and Cu2 Te. J. Mater. Chem. A 2013, 1, 12478–12484. [CrossRef] Zhao, L.L.; Wang, X.L.; Yun, F.F.; Wang, J.Y.; Cheng, Z.X.; Dou, S.X.; Wang, J.; Snyder, G.J. The effects of Te2− and I− substitutions on the electronic structures, thermoelectric performance, and hardness in melt-quenched highly dense Cu2−x Se. Adv. Electron. Mater. 2015, 1. [CrossRef] Yang, L.; Chen, Z.-G.; Han, G.; Hong, M.; Huang, L.; Zou, J. Te-doped Cu2 Se nanoplates with a high average thermoelectric figure of merit. J. Mater. Chem. A 2016, 4, 9213–9219. [CrossRef] Liu, H.L.; Yuan, X.; Lu, P.; Shi, X.; Xu, F.F.; He, Y.; Tang, Y.S.; Bai, S.Q.; Zhang, W.Q.; Chen, L.D.; et al. Ultrahigh thermoelectric performance by electron and phonon critical scattering in Cu2 Se1−x Ix . Adv. Mater. 2013, 25, 6607–6612. [CrossRef] [PubMed] Balapanov, M.K.; Ishembetov, R.K.; Kuterbekov, K.A.; Kubenova, M.M.; Almukhametov, R.F.; Yakshibaev, R.A. Transport phenomena in superionic Nax Cu2−x S (x = 0.05; 0.1; 0.15; 0.2) compounds. Ionics 2017. [CrossRef]
Appl. Sci. 2018, 8, 12
26.
27. 28.
29. 30. 31. 32.
33. 34. 35.
10 of 10
Olvera, A.A.; Moroz, N.A.; Sahoo, P.; Ren, P.; Bailey, T.P.; Page, A.A.; Uher, C.; Poudeu, P.F.P. Partial indium solubility induces chemical stability and colossal thermoelectric figure of merit in Cu2 Se. Energy Environ. Sci. 2017, 10, 1668–1676. [CrossRef] Bailey, T.P.; Hui, S.; Xie, H.Y.; Olvera, A.; Poudeu, P.F.P.; Tang, X.F.; Uher, C. Enhanced ZT and attempts to chemically stabilize Cu2 Se via Sn doping. J. Mater. Chem. A 2016, 4, 17225–17235. [CrossRef] Xu, J.; Zhang, W.X.; Yang, Z.H.; Ding, S.X.; Zeng, C.Y.; Chen, L.L.; Wang, Q.; Yang, S.H. Large-scale synthesis of long crystalline Cu2−x Se nanowire bundles by water-evaporation-induced self-assembly and their application in gas sensing. Adv. Funct. Mater. 2009, 19, 1759–1766. [CrossRef] Ge, Z.H.; Liu, X.Y.; Feng, D.; Lin, J.Y.; He, J.Q. High-performance thermoelectricity in nanostructured earth-abundant copper sulfides bulk materials. Adv. Energy Mater. 2016, 6. [CrossRef] Jiang, Y.; Wu, Y.; Xie, B.; Zhang, S.Y.; Qian, Y.T. Room temperature preparation of novel Cu2−x Se nanotubes in organic solvent. Nanotechnology 2004, 15, 283–286. [CrossRef] Poulston, S.; Parlett, P.M.; Stone, P.; Bowker, M. Surface oxidation and reduction of CuO and Cu2 O studied using XPS and XAES. Surf. Interface Anal. 1996, 24, 811–820. [CrossRef] Teeter, G. X-ray and ultraviolet photoelectron spectroscopy measurements of Cu-doped CdTe(111)-B: Observation of temperature-reversible Cux Te precipitation and effect on ionization potential. J. Appl. Phys. 2007, 102. [CrossRef] Schellenberger, A.; Schlaf, R.; Pettenkofer, C.; Jaegermann, W. XPS and SXPS studies on in-situ prepared Na/InSe insertion compounds. Solid State Ion. 1993, 66, 307–312. [CrossRef] Yu, J.L.; Zhao, K.P.; Qiu, P.F.; Shi, X.; Chen, L.D. Thermoelectric properties of copper-deficient Cu2−x Se (0.05 ≤ x ≤ 0.25) binary compounds. Ceram. Int. 2017, 43, 11142–11148. [CrossRef] Xiao, X.; Xie, W.; Tang, X.; Zhang, Q. Phase transition and high temperature thermoelectric properties of copper selenide Cu2−x Se (0 ≤ x ≤ 0.25). Chin. Phys. B 2011, 20, 087201. [CrossRef] © 2017 by the authors. Licensee MDPI, Basel, Switzerland. This article is an open access article distributed under the terms and conditions of the Creative Commons Attribution (CC BY) license (http://creativecommons.org/licenses/by/4.0/).