Electronic Supplementary Material (ESI) for Analyst This journal is © The Royal Society of Chemistry 2011
Electronic Supplementary Information
Detection and identification of body fluid stains using antibodynanoparticle conjugates Nunzianda Frascione,*a Richard Thorogatea, Barbara Daniela and Sue Jickellsa
Department of Forensic Science and Drug Monitoring, King’s College London Franklin-Wilkins Building, 150 Stamford Street, London, UK, SE1 9NH. E-mail:
[email protected]; Fax: 020 7848 4980; Tel: 020 7848 3841 a
Electronic Supplementary Material (ESI) for Analyst This journal is © The Royal Society of Chemistry 2011
S1. Antibody-nanoparticle conjugation Antibodies (1mg mL-1) were buffer exchanged into modification buffer (100 mM sodium phosphate, 150 mM NaCl; pH 7.2) and 20-fold molar excess succinimidyl 6-hydrazinonicotinate acetone hydrazone (SHyNic) in DMF was added. Reactions were incubated at room temperature, in the dark for 2 hours. Unreacted S-HyNic was removed by a 0.5 mL Zeba desalt spin column equilibrated with conjugation buffer (100 mM sodium phosphate, 150 mM NaCl; pH 6.0). Super-paramagnetic amino-nanoparticles (190 ± 15 nm in diameter and NH2 density of 100 µmol/g) (Cambridge BioScience Ltd., Cambridge, UK) were washed in 3 x 100 μL modification buffer. Modification of the nanoparticle amino groups was performed by adding an excess of succinimidyl 4-formylbenzoate (S-4FB) in DMF followed by incubation for 2 hours with gentle shaking. Unreacted S-4FB was removed and the beads were washed in 3 x 100 μL conjugation buffer using a BcMag separator-2 (Bioclone Inc.). The modified antibody (70 μL) and nanoparticles were combined and the conjugation reaction was allowed to take place for 16 hours. The conjugates were then washed in 5X 100 μL of PBS and resuspended in 50 μL of PBS. Sodium azide was added to a final concentration of 1 mM and the conjugates stored at 4oC.
S2. Degree of labelling (D.O.L) Degree of labelling was determined by measuring the absorbance at 280nm and at 494nm or 578nm (the wavelength specific for the absorbance of AF488 and AF568 respectively) on a NanoDrop ND-100 spectrophotometer (LabTech International, Ringmer, UK). The ratio of fluorophore to antibody was calculated using the following equations: (a)
Contribution of dye to A280: Aprotein = [A280 – (Adye x correction factor)] Correction factor = 0.11 for AF488 and 0.46 for AF568 [1]
(b)
Protein concentration (mg mL-1): Aprotein/203,000 x MW of IgGs (146,000 Da) = Aprotein/1.4
(c)
Degree of labelling (DOL): Adye x MW [protein] x Єdye Molecular weight (MW) of antibody = 146,000 [protein] = protein concentration in mg mL-1 Єdye = 71,000 for AF488 and 91,300 for AF568
Table 1S: Protein concentrations and Degree of Labelling for the tagged antibodies (number of dye molecules per antibody molecule). Antibody-dye conjugates Anti CD235a-488 Anti MPO-568 Anti MUC7-568
A280 0.96 1.41 1.40
Adye 0.76 1.23 1.10
IgG conc. (mg/ml) 0.63 0.60 0.64
D.O.L. 2.5 3.2 2.7
As shown in Table 1S D.O.L values for all tagged antibodies fell within the optimal labeling range of 1.5 – 4 dye molecules/protein [1] S3. Specificity test The specificity of the selected antibodies was tested in a cross reactivity study which included both body fluids as well as some common household substances. The volumes or quantities used per smears were as
Electronic Supplementary Material (ESI) for Analyst This journal is © The Royal Society of Chemistry 2011
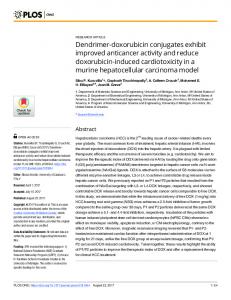
follows: 3μl of blood, 5μl of saliva, sweat and urine. Household substances were either pipetted onto microscope slides, or applied directly on a ‘spreader’ slide. The ‘spreader’ slides were then used to spread the sample on the microscope slide. The smears were air dried and spray fixed in 70:30 (v/v) methanol:acetone. Experiments were conducted in triplicate. The results are shown in Figure 1S and Table 2S.
Figure 1S: Blood and saliva smears treated with CD235a-488-200, MUC7-568-200 and MPO-568200 conjugates. Fluorescence signal was detected with blood in presence of erythrocyte- and leucocytespecific conjugates. The incubation of blood with saliva-specific conjugates left the smear unlabelled (no fluorescent signal seen). Saliva smears showed no labeling when incubated with the two blood-specific conjugates, whereas fluorescence was detected following treatment with the MUC-7 conjugates. Scale bar 10µm.
Electronic Supplementary Material (ESI) for Analyst This journal is © The Royal Society of Chemistry 2011
Table 2S: Cross reactivity test. (-) no fluorescence; (+) very weak, minimal fluorescence; (++) weak fluorescence; (+++) intermediate fluorescence; (++++) high fluorescence. I not tested
Blood Saliva Sweat Urine Coffee Jam Olive oil Milk Moisturizing cream
CD235a ++++ -
MPO ++++ -
MUC7 ++++ -
-
S4. DNA profiling of biological fluids treated with Ab-NP conjugates Six samples of blood from the same donor (10 µl) were treated with Ab-NP conjugates and subjected to DNA profiling using SGM Plus. Three untreated controls (sample ID 1 and 2) consisting of untreated blood samples were included in the analysis, as well as a further untreated control (sample ID 3) that consisted of pre-extracted high quality DNA (007 DNA control™, ABI). DNA was extracted from samples using the QiagenTM QIAamp DNA blood mini kit™ as per manufacturer’s recommendations. Samples were eluted in 50 µL H2O. Quantification was carried out using the Quantifiler™ kit (Applied Biosystems) in a 10 μl reaction, following all other manufacturer’s recommendations. The reactions were monitored on an ABI7000 sequence detection system and SDS Software v 1.2. The quantification reaction included Internal PCR control (IPC) in order to detect any possible inhibition to the PCR. In this case, all IPC Ct values were found to lie within the pre-established 26.5-29 range that is supportive of a lack of PCR inhibition. STR analysis of the DNA was carried out using AmpFlSTR SGM plus™ (Applied Biosystems), as per manufacturer’s recommendations in a 10 μl reaction volume. Samples were amplified in a Gene Amp 9700 PCR system. The amplified DNA was analysed using the ABI Prism™ 3130 DNA analyser using 3130 Data Collection software version 2.0 (Applied Biosystems), according to manufacturer’s instructions. The instrument was pre-calibrated with the required spectral matrices, and instrument maintenance was performed as described in the product maintenance guide. The DNA profiling results are summarised in Table 3S. The DNA profiles of one treated and one untreated sample are shown in Figure S2. Table 3S: DNA profiling results of samples treated with Ab-NP conjugates compared to untreated samples.
Sample ID 1 2 3 4 5 6 Average
Number of alleles amplified Treated Untreated 22 22 22 22 22 22 22 22 22 22 22
Electronic Supplementary Material (ESI) for Analyst This journal is © The Royal Society of Chemistry 2011
Figure 2S: An example of electropherograms obtained from a) control sample and b) sample treated with Ab-NP conjugates.
Electronic Supplementary Material (ESI) for Analyst This journal is © The Royal Society of Chemistry 2011
Full profiles were obtained in all cases, and the resultant electropherograms from both control samples and treated samples were of indistinguishable quality (Figure 2S). All profiles were genotyped and it was determined that all alleles were attributable to the donor. All peak heights were consistent in the 100-400 rfu levels in both treated samples and controls, indicating a successful amplification. References 1.
P. Banks and D. Paquette, Bioconjug Chem, 1995, 6, 447-458.
2.
http://probes.invitrogen.com/media/pis/mp10168.pdf