Dec 23, 2010 - Florida, FL 32816, USA. gNanoscience Technology Center, University of Central Florida, FL 32816,. USA. 1090 | Nanoscale, 2011, 3, 1090â ...
Nanoscale
View Online
C
Dynamic Article Links
< r¼ þ2219:39 kg m�3 ; if T#1000 K > : 2217:53 kg m�3 ; if T .1000K
rSi
8 �1:37T 4 þ 4:29E �8 T 3 � 5:43E �5 T 2 þ 3:84E �3 T > < r¼ þ2332:57 kg m�3 ; if T #1000 K > : 2311:28 kg m�3 ; if T.1773 K
kSnO2 kSiO2
Tmelt (SnO2)
10 W m�1 K�1 [39] Extrapolated from: [34] 8 �1:53E �17 T 4 þ 4:76E �14 T 3 � 5:54E �11 T 2 þ 3:02E �8 T > < [43,44] k¼ �2:62E �6 W m-1 K�1 ; if T#1000K > : �6 1 �1 4:40E W m K if T#1000K 8 �10 4 �7 3 �4 2 1:62E T � 2:72E T � 2:96E T þ 0:826T > > > > > > þ134:45 J kg-1 K�1 if T#1100 K > < �8 3 �5 [36] Cr ¼ 1:01E T � 6:21E T 2 þ 0:149T > > > > þ457:63 J kg-1 K�1 ; if1100K\T#1800K > > > : 583:97 J kg-1 K�1 ; if T.1800K [45,46]8 �9 4 �6 3 �3 2 T þ 5:95E T � 6:95E T þ 3:77T �191E > > > > < þ63:04J kg-1 K-1 ; if T#900K [45,46] Cr ¼ > �3:18E �5 T 2 þ 0:187T þ 769:46J kg-1 K-1 ; if900K\T#1685K > > > : 994:45J kg-1 K-1 ; if T.1685K 1903 K
Tboil (SnO2) 3
2173 K 10 K [23]
kSi
CpSnO2
CpSiO2 CpSi
This journal is ª The Royal Society of Chemistry 2011
Nanoscale, 2011, 3, 1090–1101 | 1097
Downloaded on 11 October 2011 Published on 23 December 2010 on http://pubs.rsc.org | doi:10.1039/C0NR00689K
View Online
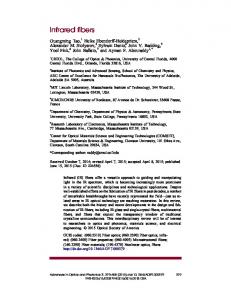
Fig. 12 Thermal model results showing: (a) the temperature difference between the interference maxima and minima when the entire film has melted; (b) maximum surface temperature as a function of SnO2 film thickness for q ¼ 72� and Eo ¼ 400 mJ cm�2; and (c) maximum surface temperature as a function of SnO2 film thickness for q ¼ 86� and Eo ¼ 550 mJ cm�2. The shaded regions in (b) and (c) represent the integrated evaporation difference G*.
dependent parameters.33 Third, the effective mass of the material heated M(ho) is also a strong function of film thickness for the following reason. When the film thickness is less then one thermal conduction depth, any heat generated within the nanoscopic metal film due to optical absorption will diffuse into the underlying SiO2 substrate. Consequently, the effective mass of material heated will include the thermal mass of the film and an effective thermal mass of the substrate estimated from the length scale of thermal diffusion occurring within the substrate in the nanosecond time scales of the experiment. Therefore, the heated qffiffiffiffiffiffiffiffiffi mass will be Mðho Þ ¼ ðrCp Þm ho þ ðrCp ÞS Dth S s, where the subscript m and s denote metal and substrate while r and Cp are values of density and specific heat, Dth S is the substrate thermal diffusivity and s is the ns time scale of laser heating. Consequently, energy balance shows that the temperature rise will be qualitatively given by DT(ho) ¼ I(ho)(1 � R(ho))s/M(ho). As can be noted, in this function, I increases with increasing thickness while (1-R) and 1/M decrease with increasing thickness. As a result, a non-monotonic variation in temperature with film height ho can be expected for any given laser intensity and in fact at a critical film thickness the temperature rise will be a maximum. This behavior, as estimated from a more accurate finite element modeling, is shown in Fig. 12 (b). A maxima in temperature occurs around a film thickness of 25 nm, while there is a large rate of change in temperature with thickness for films on either side of this maxima.
4. Discussion and conclusion The nanowire array may be formed by either liquid movement due to thermocapillary (TC) forces resulting from a temperature induced surface tension gradient, or preferential evaporation of the film between the regions of high intensity (constructive interference) and low intensity. As shown in Fig. 12 (a), the two beam irradiation causes a temperature disparity between the regions of constructive and destructive interference. Consequently, the surface tension gradient generates marangoni or thermocapillary flow along the plane. An estimate of magnitude of contribution of TC effects on fluid flow may be directly obtained from the characteristic time scale of TC flow sM. As shown in ref. 40, sM depends on the temperature gradient on the film surface, the film thickness ho, as well as materials parameters, and can be expressed as: 1098 | Nanoscale, 2011, 3, 1090–1101
sM ¼
L2laser h vg DTho 4 vT
(1)
where Llaser, h, vg/vT and DT are the laser fringe spacing, dynamic viscosity of the film material, rate of surface tension change with temperature and peak-valley temperature difference, respectively. Due to the unavailability of actual dynamic viscosity and the surface tension data for SnO2 the material constants of a known ceramic oxide, close to the position of tin oxide in the periodic table (such as lead oxide), was adapted judiciously. For lead oxide, h ¼ 2.1 Pa-s and vg ¼ �0:0968 J m�2 K�1 , and this was used to estimate the TC vT time scale.41 For the case of Eo ¼ 400 mJ cm�2 and ho ¼ 50 nm, a temperate difference of DT ¼ 530 K was obtained from thermal modeling for a fringe spacing of Llaser ¼ 225 nm (corresponding to qi ¼ 72� ). From this, the value of sM was estimated to be around 9 ns, which is comparable to the laser pulse time scale suggesting that it is reasonable to expect some contribution from TC flow under the two beam interference irradiation. However, at this stage, the experimental observations from wire formation cannot clearly differentiate between contributions from TC flow versus evaporation. Moreover, since we have observed substantial evaporation, it is also important to estimate the magnitude of contribution from preferential evaporation on the wire formation. First, the maximum rate of evaporation at a given temperature can be estimated from the classical relation between pressure and temperature42 as: rffiffiffiffiffiffi M Ge ¼ 5:834 � 10 Pe T �2
(2)
where Ge ¼ the mass evaporation rate in g cm�2 s�1, M is the molecular weight, and Pe is the equilibrium pressure in Torr. Assuming a 9 ns melt time, the theoretical evaporation rate for SnO2 at its boiling temperature of 2173 K is 0.15 nm pulse�1. Assuming a constant evaporation rate, fewer then 1000 pulses would be required to remove 100 nm of film. However, as seen from Fig. 12 (b) the peak film temperature is non-monotonic with respect to ho leading to a cut-off of evaporation at a critical thickness, which corresponds approximately to the film thickness where the maximum film temperature is equal to the melting point of the SnO2. For the case of qi ¼ 72� and E0 ¼ 400 mJ cm�2, This journal is ª The Royal Society of Chemistry 2011
Downloaded on 11 October 2011 Published on 23 December 2010 on http://pubs.rsc.org | doi:10.1039/C0NR00689K
View Online
Fig. 12 (b), this occurs at h ¼ 11 nm. From the above discussion, the observation of a final fixed remaining thickness hrem following processing of films of varying initial thickness at a given energy density Eo can also be explained qualitatively. The model predicts that for Eo ¼ 300 mJ cm�2 and qi ¼ 720, hrem ¼ 13 nm, which is in good agreement with our experimental observation shown in Fig. 6 (b). Additionally, for the case of qi ¼ 86� and ho ¼ 42 nm, hrem was found to be only weakly dependent on Eo (Fig. 9 (b), open circles), which agrees with the theoretical prediction (solid line), and the true nature of the dependence (predicted to be decreasing hrem with increasing Eo) may be masked by the inherent error in the experiment. From this analysis, one can claim that evaporation sharply drops following thinning of the film beyond the position of the temperature maxima. Interestingly, the temperature gradient also drops sharply in this region, as evident from Fig. 12 (b). Therefore, we suggest that the self-limiting behavior occurs due to this shuttingoff of evaporation and the parallel reduction in thermal gradients, which reduces TC flow. The thermal model can also be used to explain the behavior of hnw as a function of ho and Eo. In Fig.12 (b) and (c), the temperature difference between the regions of maxima and minima are shown as a function of starting film thickness ho for the 72 and 86� irradiation geometries respectively. As Fig.12 (b) and (c) show, evaporation will occur at the maxima and minima locations, but at different rates because of the different temperatures. For thick films (> 25 nm or so), this evaporation rate increases as the film thins. Now, as the temperature in the maxima continues to rise, the temperature in the minima will also begin to rise as a consequence of thermal diffusion. Consequently, the minimum also enters the evaporation zone and starts thinning. Now, a parallel thinning of the maxima and minima occur, albeit at slight different rates, as given by their respective temperatures. Finally, both locations thin enough such that the evaporation stops. From Fig. 12 (b) or (c), the two regimes can be seen to have slightly different evaporation cutoff thicknesses. If one assumes a constant evaporation rate for the entire film, so that the total evaporation time tevap f h0 � heff, and if the local evaporation rate is assumed to be relative to the modeled T � Tboil, a relative measure of preferential evaporation may be determined by integrating the relative temperature difference that exists above the melting point and the thickness. This relative evaporation difference G* can be evaluated as:
G* ¼
hð0
* * Tmaxima ðhÞ � Tminima ðhÞ
(3)
0
where T* ¼
�
T * � Tboil T * $Tboil ; 0;
if T * $Tboil if T * $Tboil ;
(4)
where T*maxima and T*minima are, for a given h, the difference between the peak temperatures of the interference maxima and minima and the boiling point, and where temperatures below the boiling point result in a value of zero. If the previous assumptions are valid, the resulting integrated evaporation, G*, should be proportional to hnw. As shown by the open circles in Fig. 6 (a), This journal is ª The Royal Society of Chemistry 2011
films of larger initial thickness exhibit a much greater hnw, and are in qualitative agreement with the theoretical G*, plotted as the solid line. It should be noted that the scale of G* is arbitrary, but agrees with the experimentally measured data when both y axes intersect the x axis at 0. Similarly, increasing Eo should increase G*, since DT increases in concert with Eo. This relationship agrees with the experimentally determined data in Fig. 9 (a). However, due to the angle disparity between the constant energy and thickness experiments, the absolute values of G* could not be compared between the two cases. From this discussion, the non-monotonic thickness-dependent temperature behavior provides opportunity to synthesize wires under a variety of interesting laser parameters. For instance, by varying the intensity of the individual interfering beams, it is possible to modulate the temperature difference between the maxima and minima. Hence, this can be used to influence hnw as well as the hrem. Another important aspect of the processing of SnO2 is the relatively small difference between the melting point and boiling point (i.e. 270 K). As a result, wire formation by pure thermocapillary flow requires stringent control on the laser energy as well as in the intensity of each of the interfering beams. These studies could form the basis for further investigations of wire formation in SnO2. Another important issue concerns the difference in the morphology of the nanowires formed from the films with different initial thickness and/or at different laser energies. As seen from Fig. 4 and Fig. 7, the morphology can consist of a cluster of nanoparticles in contact with each other [Fig. 4 (a)], continuous smooth nanowires, [Fig. 7 (b)], or a porous nanowire structure [7 (d)]. We have found that the nanoparticle-like morphology occurs when synthesis is done starting with very thin films, typically near the final remaining thickness hrem. In this situation synthesis is dominated by melting and fluid flow rather then evaporation. We attribute this morphology behavior to the competition between liquid film morphology change due by dewetting competing with morphology from thermocapillary flow. It has been shown earlier for metal films that when the films are extremely thin, the time scale for film dewetting, which scales with thickness as sD f h5, can be comparable to the thermocapillary time scale sM.25 Consequently, the observed morphology was a compromise between the two processes and resulted in nanoparticles arranged in rows. We suggest that a similar reasoning underlies the morphology seen in Fig. 4 (b), especially for the films with low starting thickness where the synthesis is dominated by melting and fluid flow, as compared to evaporation. On the other hand, the more porous structure seen for the thicker films processed at higher laser energies [Fig. 7 (d)] is possibly due to the relatively larger role played by evaporation in this synthesis regime. In conclusion, we have synthesized parallel nanowire arrays of SnO2 on SiO2 substrates by nanosecond pulsed laser irradiation. Such nanowires are potential candidates for improved H2 sensor performance The array morphology was characterized by SEM and AFM, in conjunction with EDS and XPS measurements to evaluate concentration and stoichiometry. Due to evaporation, the final nanowire array had a lower effective SnO2 film thickness, whose value was independent of starting film thickness for any given laser energy density, but decreased with increasing energy density. Furthermore, a self-limiting effect was observed Nanoscale, 2011, 3, 1090–1101 | 1099
View Online
Downloaded on 11 October 2011 Published on 23 December 2010 on http://pubs.rsc.org | doi:10.1039/C0NR00689K
wherein the wire formation stopped at this effective remaining film thickness. These behaviors could be explained by nanoscale effects of the laser-film heating that resulted in a highly nonmonotonic film temperature dependence on film thickness. In addition to the nanowire height, the structure of the nanowires was dependant on the amount of evaporation, with large initial thicknesses producing consistent nanowires and small thicknesses, where no evaporation takes place, producing clusters of nanoparticles in contact with each other. These results show that fabrication of large nanowire arrays can be achieved by careful analysis of the thermal behavior in conjunction with experiments.
Acknowledgements The authors acknowledge support by the National Science Foundation through grants NSF-ECCS-0850574 and NSFECCS-0801774. RK also acknowledges support through CAREER grant DMI-0449258. NS and JS also acknowledge AFM measurements performed by P. Mreutesatorn. A portion of the research (XPS and XRD) was performed using EMSL, a national scientific user facility sponsored by the Department of Energy’s Office of Biological and Environmental Research and located at Pacific Northwest National Laboratory.
References 1 N. M. Sammes and R. Boersma, Small-scale fuel cells for residential applications, J. Power Sources, 2000, 86(1–2), 98–110. 2 M. Mogensen, M. S. Nigel and G. A. Tompsett, Physical, chemical and electrochemical properties of pure and doped ceria, Solid State Ionics, 2000, 129(1–4), 63–94. 3 C. M. White, R. R. Steeper and A. Lutz, The hydrogen-fueled internal combustion engine: a technical review, Int. J. Hydrogen Energy, 2006, 31(10), 1292–1305. 4 B. S. Archanjo, G. V. Silveira, A.-M. B. goncalves, D. C. B. Alves, A. S. Ferlauto, R. G. Lacerda and B. R. A. Neves, Fabrication of Gas Nanosensors and Microsensors via Local Anodic Oxidation, Langmuir, 2009, 25, 602–605. 5 C. Drake, A. Amalu, J. Bernard and S. Seal, Enhancing the low temperature hydrogen sensitivity of nanocrystalline SnO2 as a funciton of trivalent dopants, J. Appl. Phys., 2007, 101, 104307. 6 S. G. Ansari, P. Boroojerdian, S. R. Sainkar, R. N. Karekar, R. C. Aiyer and S. K. Kulkarni, Grain size effects on H2 gas sensitivity of thick film resistor using SnO2 nanoparticles, Thin Solid Films, 1997, 295(1–2), 271–276. 7 G. K. Mor, M. A. Carvalho, O. K. Varghese, M. V. Pishko and C. A. Grimes, A room-temperature TiO2-nanotube hydrogen sensor able to self-clean photoactively from environmental contamination, J. Mater. Res., 2004, 19(2), 628–634. 8 C. Wang, L. Yin, L. Zhang, Y. Qi, N. Lun and N. Liu, Large Scale Synthesis and Gas-Sensing Properties of Anatase TiO2 ThreeDimensional Hierarchical Nanostructures, Langmuir, 2010, 26, 12841–12848. 9 P. Tobiska, A. Hugon, A. Trouillet and H. Gagnaire, An integrated optic hydrogen sensor based on SPR on palladium, Sens. Actuators, B, 2001, 74, 168. 10 C. K. Kim, J. H. Lee, Y. H. Lee, N. I. Cho and D. J. Kim, A study on a platinum-silicon carbide Schottky diode as a hydrogen gas sensor, Sens. Actuators, B, 2000, 66(1–3), 116–118. 11 G. H. Lu, L. E. Ocola and J. H. Chen, Room temperature gas sensing based on electron transfer between discrete tin oxide nanocrystals and multiwalled carbon nanotubes, Adv. Mater., 2009, 21, 24. 12 S. Shukla, S. Seal, L. Ludwig and C. Parish, Nanocrystalline indium oxide-doped tin oxide thin film as low temperature hydrogen sensor, Sens. Actuators, B, 2004, 97(2–3), 256–265.
1100 | Nanoscale, 2011, 3, 1090–1101
13 G. Zhang and M. Liu, Effect of particle size and dopant on properties of SnO2-based gas sensors, Sens. Actuators, B, 2000, 69(1–2), 144– 152. 14 A. Licciulli, S. Mazzarelli, G. De, P. Siciliano, L. Vasanelli and R. Rella, Os and pd modified tin oxide films for sensors by the sol gel process, J. Sol-Gel Sci. Technol., 2001, 21(3), 195–201. 15 T. F. Baumann, S. O. Kucheyev, A. E. Gash and J. H. Satcher, Adv. Mater., 2005, 17, 1546–1548. 16 M. Law, H. Kind, B. Messer, F. Kim and P. D. Yang, Photochemical sensing of NO2 with SnO2 nanoribbon nanosensors at room temperature, Angew. Chem., Int. Ed., 2002, 41, 2405–2408. 17 M. Batzill and U. Diebold, The surface and materials science of tin oxide, Prog. Surf. Sci., 2005, 79, 47–154. 18 Z. Fan, J. C. Ho, T. Takahashi, R. Yerushalmi, K. Takei, A. C. Ford, Y. Chueh and A. Javey, Toward the development of printable nanowire electronicsand sensors, Adv. Mater., 2009, 21, 3730–3743. 19 H. M. van Driel, J. E. Sipe and J. F. Young, Laser-induced periodic surface structures on solids: a universal phenonmenon, Phys. Rev. Lett., 1982, 49(26), 1955–1959. 20 S. E. Clark and D. C. Emmony, Ultraviolet-laser-induced periodic surface structures, Phys. Rev. B:, 1989, 40(4), 2031–2043. 21 D. Bauerle, Laser Processing and Chemistry. Berlin: Springer, second ed., 1996. 22 S. J. Henley, J. D. Carey and S. R. P. Silva, Pulsed-laser-induced nanoscale island formation in thin metal-on-oxide films, Phys. Rev. B, 2005, 72, 195408. 23 J. Trice, D. G. Thomas, C. Favazza, R. Sureshkumar and R. Kalyanaraman, Investigation of pulsed laser induced dewetting in nanoscopic Co films: Thermal modeling and experiments, Phys. Rev. B: Condens. Matter Mater. Phys., 2007, 75, 235439. 24 Y. Wu, J. D. Fowlkes, P. D. Rack, J. A. Diez and L. Kondic, On the Breakup of Patterned Nanoscale Copper Rings into Droplets via Pulsed-Laser-Induced Dewetting: Competing Liquid-Phase Instability and Transport Mechanisms, Langmuir, 2010, 26, 11972– 11979. 25 C. Favazza, J. Trice, R. Kalyanaraman and R. Sureshkumar, Self-organized metal nanostructures through laser-interference driven thermocapillary convection, Appl. Phys. Lett., 2007, 91, 043105. 26 J. Trice, C. Favazza, D. Thomas, H. Garcia, R. Kalyanaraman and R. Sureshkumar, Novel self-organization mechanism in ultrathin liquid films: theory and experiment, Phys. Rev. Lett., 2008, 101(1), 017802. 27 H. Krishna, N. Shirato, C. Favazza and R. Kalyanaraman, Energy driven self-organization in nanoscale metallic liquid films, Phys. Chem. Chem. Phys., 2009, 11, 8136–8143. 28 I. H. Malitson, Interspecimen comparison of the refractive index of fused silica, J. Opt. Soc. Am., 1965, 55, 1205. 29 T. Jean-Marc, C. Mohammed, H. Luc, L. Philippe, D. Jacques and G. Jean-Marie, Characterization of tin oxides by X-rayphotoemission spectroscopy, Phys. Rev. B, Jul 1992, 46, 2460– 2466. 30 Handbook of Optics, vol. 2. McGraw-Hill, 2 ed., 1994. 31 V. M. Jimenez, J. P. Espinos, A. Caballero, L. Contreras, A. Fernandez, A. Justo and A. R. Gonzalez-Elipe, SnO2 thin films prepared by ion beam induced CVD: preparation and characterization by X-ray absorption spectroscopy, Thin Solid Films, 1999, 353, 113. 32 J. S. C. Prentice, Coherent, partially coherent and incoherent light absorption in thin-film multilayer structures, J. Phys. D: Appl. Phys., 2000, 33, 3139–3145. 33 O. Heavens, Optical Properties of Thin Solid Films. Dover Publications, 1991. 34 L. W. Kurt and J. C. Thomas, Thermal conductivity of clear fused silica at high temperatures, J. Appl. Phys., 1959, 30, 1702. 35 P. Bouchut, D. Decruppe and L. Delrive, Fused silica thermal conductivity dispersion at high temperature, J. Appl. Phys., 2004, 96, 3221. 36 L. B. Pankratz, US Bureau of Mines Bulletin 672, 1984, p. 30. 37 D. Taylor, Trans. J. British Ceramic Soc., 1984, 83, 32. 38 P. Tiirkes, J. Phys. C: Solid State Phys., 1980, 13, 4941. 39 CRC Handbook of Chemistry and Physics, 2009. 40 T. Schwarz-Selinger, D. G. Cahill, S.-C. Chen, S.-J. Moon and C. P. Grigoropoulos, Micron-scale modifications of Si surface
This journal is ª The Royal Society of Chemistry 2011
View Online
43 P. D. Desai, J. Phys. Chem. Ref. Data, 1986, 15, 967. 44 K. K. Kelley, US Bureau of Mines Bulletin 476, 1949, p. 42. 45 C. F. Lucks, H. W. Deem and W. D. Wood American, Ceram. Soc. Bull., 1960, 39, 313. 46 L. van Vlack, Physical Ceramics for Engineers. Addison-Wesley Publishing Co., 1964.
Downloaded on 11 October 2011 Published on 23 December 2010 on http://pubs.rsc.org | doi:10.1039/C0NR00689K
morphology by pulsed-laser texturing, Phys. Rev. B: Condens. Matter, 2001, 64, 155323. 41 C. Yaws, ed., Chemical Properties Handbook. McGraw-Hill, 1999. 42 M. Ohring, The Materials Science of Thin Films, Harcourt Brace jovanovich, 1992.
This journal is ª The Royal Society of Chemistry 2011
Nanoscale, 2011, 3, 1090–1101 | 1101