Nanoscale View Article Online
Published on 11 September 2014. Downloaded by Sungkyunkwan University on 11/05/2015 18:15:03.
PAPER
Cite this: Nanoscale, 2014, 6, 12943
View Journal | View Issue
Significant enhancement of the electrical transport properties of graphene films by controlling the surface roughness of Cu foils before and during chemical vapor deposition† Dongmok Lee,a,b Gi Duk Kwon,b Jung Ho Kim,a,b Eric Moyen,b Young Hee Lee,a,b,c Seunghyun Baik*a,d and Didier Pribat*b We have studied the influence of the surface roughness of copper foils on the sheet resistance of graphene sheets grown by chemical vapor deposition. The surface roughness of the copper foils was reproducibly controlled by electropolishing. We have found that the graphene sheet resistance monotonically decreases as the surface roughness of the copper foils decreases. We show that a pre-annealing treat-
Received 30th June 2014, Accepted 7th September 2014
ment combined with an optimized electropolishing process of the Cu foils and a fast CVD growth pre-
DOI: 10.1039/c4nr03633f
vents the evolution of the Cu surface roughness during graphene synthesis. This combination of fabrication conditions produces small grain polycrystalline graphene films with a sheet resistance of 210 Ω
www.rsc.org/nanoscale
□−1
and carrier mobility values as high as 5450 cm2 V−1 s−1 after transfer onto SiO2/Si.
Introduction After the successful mechanical exfoliation of graphene from highly oriented pyrolytic graphite in 2004,1 scalable production methods have been actively investigated. In particular, chemical vapor deposition (CVD) on certain metal catalyst films/foils has been – and still is – considered as a powerful method for large area graphene synthesis.2–7 Among various metal catalysts, copper (Cu) can grow monolayer graphene due to its low carbon solubility5,8 which induces a self-limiting growth mechanism.5 Because tremendous efforts have been devoted to improve synthesis conditions, including Cu surface morphology, pre-annealing conditions, growth temperature, feed gas composition, pressure and time, etc.,9–14 some CVD-grown a Center for Integrated Nanostructure Physics, Institute for Basic Science (IBS), Suwon 440-746, Republic of Korea. E-mail:
[email protected] b Department of Energy Science, Sungkyunkwan University, Suwon 440-746, Republic of Korea. E-mail:
[email protected] c Department of Physics, Sungkyunkwan University, Suwon 440-746, Republic of Korea d School of Mechanical Engineering and Samsung-SKKU Graphene Center (SSGC), Sungkyunkwan University, Suwon 440-746, Republic of Korea † Electronic supplementary information (ESI) available: Developed AFM profiles, evaporation induced planarization effect of Cu foils, EBSD analysis of a polycrystalline Cu foils, XPS spectra on RAW, EP and O-EP samples, Raman area map of the D-to-G mode intensity ratio of A-EP sample, Evaluation of the sheet resistance variation as a function of grain size, Optical images of a Cu foil before and after electropolishing, van der Pauw square resistance measurements, XPS spectra of graphene transferred on SiO2/Si substrates with and without HCl treatment. See DOI: 10.1039/c4nr03633f
This journal is © The Royal Society of Chemistry 2014
graphene samples can now match the remarkable electrical properties of exfoliated graphene.15 However, as shown by Tsen et al.,15 the structure of grain boundaries and the stitching conditions between grains govern the transport properties of graphene. Although scattering by grain boundaries is the most invoked limitation for carrier mobility values in polycrystalline CVD graphene,15–17 additional scattering/limitations due to corrugations,18 ripples and wrinkles19 should also be considered whether in CVD or exfoliated graphene.18 Considerations on corrugations, ripples and wrinkles are all the more important as graphene is usually transferred onto an oxidized Si wafer after growth. In other words, assuming that graphene coverage is conformal on the Cu surface, the roughness of the Cu foil after growth should match inasmuch as possible that of the receiving substrate, unless more wrinkles/ripples are created after transfer, in order to accommodate the length/ surface area difference.20 For instance, the length difference measured along a 50 µm-long atomic force microscope (AFM) profile between a raw Nilaco Cu foil (exhibiting a root mean square (RMS) roughness of ∼78 nm) and an oxidized Si surface (RMS roughness of ∼6.82 nm) is ∼377 nm, i.e. ∼7.54 nm µm−1. Assuming graphene growth is performed on a raw Nilaco Cu foil, this length difference must be accommodated upon transfer, thus creating extra corrugations and ripples in the graphene film (see ESI Fig. S1†). Here we have systematically investigated the effect of the Cu surface roughness on the electrical quality of graphene after synthesis and transfer onto SiO2/Si. The idea is to improve the electrical characteristics of graphene by decreasing corruga-
Nanoscale, 2014, 6, 12943–12951 | 12943
View Article Online
Published on 11 September 2014. Downloaded by Sungkyunkwan University on 11/05/2015 18:15:03.
Paper
tions, ripples and wrinkles, i.e. by matching inasmuch as possible the roughness values of the growth (Cu foil) and receiving (Si/SiO2) substrates. In order to unambiguously prove the deleterious effect of the roughness mismatch between the growth and receiving substrates, we have prepared Cu foils with various roughness values, using a newly developed elevated temperature electropolishing method.21 After electropolishing, graphene growth was performed in exactly the same conditions for all samples, so that the only varying parameter in our experiments is the surface roughness value of the Cu foils. Because the graphene grain size (which to a large extent governs the electrical properties of graphene15–17) also changes with the surface roughness of the Cu foils, we separated the two effects by using some of the results of ref. 15 (see below). Some samples were also electropolished after pre-annealing of the Cu substrate at 1050 °C for 30 min, in order to stabilize the Cu grain structure and prevent further surface modifications during subsequent graphene growth at 1000 °C. We find that the graphene sheet resistance decreases as the roughness of the Cu surface decreases. Moreover, pre-annealed and electropolished Cu foils, with a RMS surface roughness in the 10 nm range, produced small-grain polycrystalline graphene exhibiting a low sheet resistance of ∼210 Ω □−1 and an electron mobility as high as ∼5450 cm2 V−1 s−1 after transfer onto SiO2/Si substrates. Any thin film or epitaxial deposition process first requires a surface preparation step for the substrate and this holds for graphene as well. Indeed, various polishing/etching methods for Cu foils before graphene growth have already been reported in the literature. The general idea is to remove rolling marks and surface defects which act as uncontrolled graphene nucleation sites.9 For instance, in several recent reports, electropolishing of the Cu foils is employed,22–25 but no systematic studies of surface roughness are performed. In another study, the Cu foils are prepared by chemical-mechanical polishing (CMP), yielding a clear improvement in the sheet resistance values of graphene after transfer, even though residual impurities from the CMP slurry still act as uncontrollable graphene nucleation seeds.9 In more recent work, a simple chemical etching in Fe(NO3)3 was shown to decrease the surface quality of Cu foils, leaving etch quarries even after annealing at 1025 °C.14
Results and discussion Fig. 1 shows a schematic of the various paths we have investigated for graphene synthesis using three different types of Cu substrates. The acronyms of those Cu substrates are summarized in Table 1. The surface roughness was measured at three different locations for each ∼1 × 1 cm2 specimen, using tapping mode atomic force microscopy (AFM); the average RMS roughness value is indicated in Fig. 1 for each situation. A detailed description of the surface roughness characterization is provided in Fig. 2 and in the Experimental section. As shown in Fig. 1a, the typical RMS roughness of a raw copper
12944 | Nanoscale, 2014, 6, 12943–12951
Nanoscale
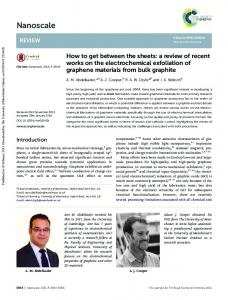
Fig. 1 A quick overview of the various paths studied for graphene synthesis. Three different types of copper substrates were prepared. Representative AFM images and RMS values are shown at each step of the process sequence. (a) Graphene was synthesized on a raw copper substrate (RAW). (b) The raw copper substrates were firstly electropolished and then used for graphene synthesis (EP). The electropolishing conditions were controlled to prepare copper substrates with four different surface roughness values. (c) The raw copper substrate was firstly preannealed at 1050 °C for 30 min followed by electropolishing and then synthesis of graphene (A-EP).
Table 1
Acronyms of copper substrates
Acronym RAW EP A-EP
Raw copper substrate Electropolished copper substrate The raw copper substrate was firstly annealed at 1050 °C for 30 min followed by electropolishing
foil (RAW, Nilaco, #113321, 99.96% purity, 100 μm thickness) was ∼78 nm. Unless otherwise mentioned, the overall graphene synthesis process used throughout this study consisted of an annealing step at 1000 °C for 30 minutes under pure H2, followed by graphene growth also at 1000 °C using a mixture of CH4 and H2 (see Experimental section for details). The surface roughness of raw Cu (RAW) foils was generally found to decrease after synthesis of graphene (RMS = 58 nm, Fig. 1a) because of surface reorganization due to surface diffusion and evaporation of Cu atoms.26,27 More specifically, surface levelling is provided by the motion of Cu surface steps induced by Cu evaporation during the annealing treatment prior to graphene growth.14,28 At this point, it has to be borne in mind that Cu does evaporate during the high temperature graphene synthesis process and that the surface of the Cu foil (or film29) evolves continuously not only during the annealing stage but also during the graphene growth stage, due to the movement of surface steps.28–30 In particular, while step receding and annihilation on the Cu surface can provide planarization during annealing (see ESI, Fig. S2†),14 step flow can also be impeded at a further stage of the synthesis process by growing graphene islands, which create step bunching and hillocks below graphene flakes, thus promoting surface roughening.28–30 Of course, the roughening process stops once the Cu surface is totally covered by graphene. To summarize at
This journal is © The Royal Society of Chemistry 2014
View Article Online
Published on 11 September 2014. Downloaded by Sungkyunkwan University on 11/05/2015 18:15:03.
Nanoscale
Paper
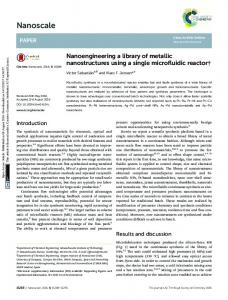
Fig. 2 Characterization of copper substrates. (a) Raman spectra of the copper substrate before and after detaching graphene using 3 M scotch tape. The final surface roughness of the copper substrate was characterized after detaching the synthesized graphene. The inset shows the detachment process. (b) Optical and AFM images of a copper substrate after graphene synthesis and removal. The surface roughness was characterized within a copper grain since there was a large height variation at the grain boundary. The surface roughness values measured at 3 different locations were averaged to obtain RMS values. (c) The Cu2p XPS spectra of RAW, EP, and O-EP samples; the latter were obtained by just exposing EP samples to ambiant air for 8 days. (d) Optical images of pre-annealed copper substrates (1050 °C, 30 min) with and without H2 (30 sccm) flow during the cooling process.
this point, the final roughness of the Cu foils is the result of two competing effects depending on whether the surface steps are mobile or partially blocked, namely (i) surface planarization during annealing and (ii) surface roughening during graphene growth. Note that in the present work, in order to minimize surface roughening during graphene growth (after the annealing stage), we have used a high CH4/H2 ratio of 10 (see Experimental section) so that we rapidly reach total Cu surface coverage by graphene. As a consequence, the high supersaturation of the vapor phase induces a high graphene nucleation rate and we grow polycrystalline graphene with a small grain size of 3–4 µm (see below, Fig. 4 and its comments). As shown in Fig. 1b, in order to investigate the effect of Cu surface roughness on the electrical transport properties of graphene, four Cu substrates with different roughness values (RMS = 25, 49, 50 and 100 nm) were prepared by carefully controlling the electropolishing parameters (see Experimental section and ref. 21). The original surface roughness could be increased or decreased depending on those electropolishing parameters (H3PO4 concentration, bath temperature, current density) and a detailed description is provided in the Experimental section. For all situations of Fig. 1b, the Cu surface roughness was found to be stable or to slightly decrease after
This journal is © The Royal Society of Chemistry 2014
graphene synthesis, indicating that surface roughening due to step bunching during the growth stage was minimized. Fig. 1c shows a different process sequence, where the Cu foils were pre-annealed at 1050 °C during 30 min before electropolishing, in order to increase the Cu grain size and prevent further temperature-induced grain evolution during the graphene synthesis at 1000 °C. The enlarged grain size of the polycrystalline Cu substrates after the annealing process at 1050 °C could be observed by electron backscattering diffraction analysis (see ESI, Fig. S3†). After pre-annealing and cooling down, the Cu foils were electropolished and then graphene was synthesized using the normal sequence at 1000 °C. As shown in Fig. 1c, the pre-annealing stage smoothed the Cu surface, and the roughness was further decreased down to 12 nm (RMS) by electropolishing in optimized conditions.21 Graphene synthesis (including the 1000 °C, 30 minutes pre-annealing step) did not significantly alter the Cu surface quality since the roughness after growth was almost unchanged (13 nm). We have also used X-ray diffraction analysis to track the evolution of the Cu grain orientation in the foils, following the various high temperature annealing/graphene growth treatments. Various spectra are shown in Fig. S4 of the ESI.† The RAW substrate exhibits a slight (100) texture, whereas after a high temperature bake (whether 1000 or 1050 °C), a strong (111) texture is
Nanoscale, 2014, 6, 12943–12951 | 12945
View Article Online
Published on 11 September 2014. Downloaded by Sungkyunkwan University on 11/05/2015 18:15:03.
Paper
Nanoscale
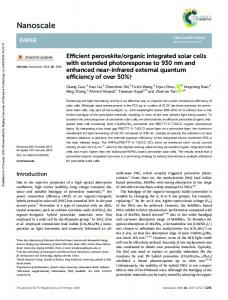
Fig. 3 Characterization of graphene synthesized using different copper substrates. (a) Optical transmittance. An optical image of a graphene sheet (1.5 × 1.5 cm2) transferred on a glass substrate is shown in the inset with the letters ‘SKKU’ placed below the glass substrate. (b) Raman spectra of graphene sheets transferred on SiO2 (300 nm)/Si substrates. The excitation wavelength was 532 nm. (c) Sheet resistance of graphene on SiO2/Si substrates as a function of the surface roughness (RMS) of the Cu foil on which the graphene was grown. See ESI Table S1† for the standard deviation values. (d) The transfer characteristic (ID–VG) curve for a field effect transistor fabricated in a graphene sheet grown on A-EP substrate and transferred on a SiO2 (300 nm)/Si substrate. The inset shows an optical image of the A-EP field effect transistor.
observed for all samples (ESI Fig. S4†). This means that the substrates on which our graphene films have been grown are similar, at least on a macroscopic scale. As shown in Fig. 2a, the final surface roughness of the Cu substrates was measured after peeling-off the CVD-grown graphene using 3 M scotch tape. We removed the graphene films after growth in order to avoid artifacts in roughness measurements. This final surface roughness value (after graphene growth and peel-off ) was used to designate each specimen in Fig. 1 and 3 since we consider it as the most meaningful value, corresponding to the actual surface on which graphene was grown. Because any plasma technique (based on O2 or H2) can modify the substrate roughness and since the graphene–Cu interaction is weak, we used a scotch tape to peel-off graphene from the Cu foils after growth. The Raman spectra measured on the Cu substrate indicate that the synthesized graphene was successfully detached by the scotch tape (see Fig. 2a and also ESI, Fig. S5† for Raman mapping over a larger area). The typical G (∼1580 cm−1) and 2D (∼2700 cm−1) modes disappeared from the Cu substrate after the detachment of graphene.31,32 As quoted above, the surface roughness was measured by AFM at three different locations of the Cu substrates. However, the grain boundaries were avoided in those AFM characterizations since there was systematically a steepsided valley-like height variation which again would have introduced artifacts in roughness measurements as shown in Fig. 2b.
12946 | Nanoscale, 2014, 6, 12943–12951
Fig. 2c compares X-ray photoelectron spectroscopy (XPS) data of RAW samples, EP samples, and samples kept 8 days in ambient air after electropolishing (those are labelled O-EP). The full-range XPS spectra are provided in ESI, Fig. S6.† The native Cu oxide layer (CuO) satellite peaks were observed on raw Cu (RAW) at higher binding energies than the main Cu2p3/2 and Cu2p1/2 peaks.33 However, CuO peaks were negligible on EP samples which demonstrates that electropolishing is very effective in removing the native Cu oxide layer. After 8 days of exposure of the electropolished Cu substrates to ambient air (O-EP), the overall XPS spectrum was found to be similar to that of raw Cu. The CuO satellite peaks could be observed again confirming the surface oxidation of those samples. Fig. 2d compares the surface of pre-annealed Cu substrates (at 1050 °C) with and without H2 flow during the rapid cooling process. Surprisingly, the surface roughness of Cu increased significantly when the substrates were cooled down under H2 flow (30 sccm). We suspect that due to H2 adsorbtion and dissociation on the Cu surface, the released atomic hydrogen then reacts with some remaining Cu surface oxides34 or Cu oxide inclusions. This reaction generates steam (insoluble in Cu) when the temperature approaches the critical temperature of water, thus producing some kind of surface blistering.35 This results in a large increase in surface roughness as shown in Fig. 2d. Therefore, the H2 flow was stopped right before the rapid cooling of the Cu substrate.
This journal is © The Royal Society of Chemistry 2014
View Article Online
Published on 11 September 2014. Downloaded by Sungkyunkwan University on 11/05/2015 18:15:03.
Nanoscale
The synthesized graphene films on different Cu substrates (RAW, EP and A-EP) were transferred on glass or SiO2 (300 nm)/Si substrates for further optical and electrical characterizations (Fig. 3). Details concerning the transfer process can be found in Experimental section. As shown in Fig. 3a, the optical transmittance of graphene films on glass substrates was ∼97.7% at 550 nm indicating successful synthesis of monolayer graphene. Raman spectra measured on graphene films on SiO2/Si substrates demonstrated two prominent G and 2D bands (Fig. 3b).31,32 The intensity ratio of G-to-2D modes was less than 0.5 indicating monolayer graphene.5 Moreover, the full width at half maximum (FWHM) of the 2D peak was 34 cm−1, 35 cm−1 and 32 cm−1 for respectively RAW, EP and A-EP samples; these values are also characteristic of monolayer graphene. The D band (∼1350 cm−1) was negligible, demonstrating high crystalline quality for all synthesized graphene films. For the EP samples, we did not observe any significant difference in the optical transmittance and Raman spectra ( particularly the D band intensity) among the samples grown on Cu foils with different surface roughness values. A Raman area map of the A-EP sample demonstrates a uniform high crystalline quality graphene with small D-to-G mode intensity ratios (see ESI Fig. S7†). Although the transmittance and Raman analysis indicated that good crystalline quality monolayer graphene films were synthesized in all situations, the sheet resistance was strongly dependent on the surface roughness of Cu foils (see Fig. 3c). More specifically, the sheet resistance of graphene synthesized on electropolished Cu substrates was found to decrease monotonically as the RMS roughness value decreased. To the best of our knowledge, this is the first report of a clear correlation
Paper
between the surface roughness of Cu foils and the sheet resistance of graphene. Interestingly, the RMS roughness value of A-EP, which was only 13 nm, produced a minimum graphene sheet resistance of 210 Ω □−1. Actually, the measured sheet resistance values were found to slightly decrease with time when the samples were kept in ambient air. This phenomenon is due to charge transfer doping of graphene induced by the redox reaction of oxygen from air with adsorbed water at the surface of the hydrophilic SiO2 dielectric.36 Consequently, in order to get stable sheet resistance values, all measurements were performed after a 10-day exposure time to ambient air, after which we did not observe any variation in sheet resistance values. The sheet resistance was measured in ambient air environment by a four-point probe in-line method, and the distance between tungsten probes was 1 mm (see Experimental section for details).37,38 The sheet resistance was characterized at 3 different locations for each sample, and five hundred measurements were carried out at each location using a delta mode method. The delta mode automatically triggers the current source to alternate the signal polarity followed by voltage reading at each polarity. This current reversal technique cancels out any constant thermoelectric offsets to measure the true voltage values.37,38 The mean values and standard deviations are shown in Fig. 3c and ESI Table S1.† This observed sheet resistance is remarkably low considering that there are ∼280–300 graphene grains (as will be discussed in relation with Fig. 4) in series between the two probes. This observation would tend to confirm that not only grain boundaries, but also surface corrugations, ripples and wrinkles (which are minimized here due to the low surface roughness of the Cu foil after growth) strongly affect the electrical
Fig. 4 Grain size and nucleation density analysis. (a–c) SEM images of graphene synthesized on respectively RAW (58 nm), EP (25 nm) and A-EP (13 nm) Cu foils. The synthesis conditions were identical for all samples (CH4: 20 sccm, H2: 2 sccm, growth time: 10 seconds). (d) The grain size was estimated using the average distance between the center of nucleation sites. The corresponding RMS roughness of Cu foils is shown in parenthesis.
This journal is © The Royal Society of Chemistry 2014
Nanoscale, 2014, 6, 12943–12951 | 12947
View Article Online
Published on 11 September 2014. Downloaded by Sungkyunkwan University on 11/05/2015 18:15:03.
Paper
Nanoscale
properties of graphene. In Fig. 3c, we note the higher sheet resistance value of the RAW sample (black dot) even though its surface roughness value is comparable to that of one of the EP samples (∼60 nm). We attribute this difference to (i) the much smaller grain size (see Fig. 4 and it comments) which will alter the carrier mobility values and (ii) the surface chemical contamination (e.g., Fe from the rolling process) which creates defects during graphene growth, thus again impairing carrier mobility (see Fig. S8 of ESI† for optical pictures of the Cu surface before and after electropolishing). In order to confirm the sheet resistance values, we have also performed a limited number of experiments using the van der Pauw measurement technique39–41 on ∼5 × 5 mm2 graphene squares transferred on Si/SiO2 and fitted with In contacts (see Experimental section and ESI, Fig. S9†). We chose an EP sample with a surface RMS roughness of ∼30 nm. For this sample, the sheet resistance value measured with the 4-point probe in-line technique was 311.2 Ω □−1, whereas the value obtained by the van der Pauw method was 310 Ω □−1. Because the agreement between the two methods was excellent, we did not pursue the van der Pauw measurements any further. Actually, as shown in Fig. 4, the grain size of graphene films also varies slightly with the roughness of the Cu foils, so that concerning the improved sheet resistance value of the A-EP sample, it is difficult to separate the effect due to the decrease in roughness from the effect due to the slight increase in grain size. We evaluated the sheet resistance (Rs) variation as a function of the average grain size (D), using the expression derived by Tsen et al.:15 Rs ! ρsq ð1 þ λ=DÞ; where ρsq is the single domain sheet resistance (without the grain boundary effect) and λ represents the grain boundary connectivity. λ depends upon the growth process used for graphene synthesis (as well as the grain size and grain stitching situation) and in ref. 15, the average values of λ were ∼110 nm for a growth type similar to ours (grain size in the 1 µm range, rapid coverage of the Cu substrate) and ∼880 nm for a growth type yielding large grains (50 µm and more; long growth duration). With the grain size values of Fig. 4d, (∼2.8 µm for EP and ∼3.5 µm for A-EP) and a λ value of 110 nm, we calculate a ratio of Rs EP/Rs A-EP ≈ 1.0083, which is much smaller than the actual ratio of Rs EP/Rs A-EP ≈ 1.4578 that we measure experimentally (see ESI for the detailed calculation and the exact sheet resistance values – Table S1†). The same ρsq value was assumed for both samples. So, clearly, the grain size variation alone cannot account for the decrease in sheet resistance that we measured. We emphasize again that apart from the surface roughness of the Cu foils, all the other parameters were kept unchanged for the various growth experiments. In order to get more insights on the electrical properties of graphene grown on Cu foils first annealed and then electropolished in optimized conditions (A-EP, see Fig. 1c), we performed additional carrier mobility measurements (in vacuum) using field effect transistor (FET) structures with a channel
12948 | Nanoscale, 2014, 6, 12943–12951
length (L) of 26 µm and a channel width (W) of 2 µm (see Experimental section). The FET structures were fabricated on a p-type doped silicon substrate (used as back gate) covered with 300 nm of SiO2 (gate dielectric). A typical FET transfer characteristic (ID–VG curve) is shown in Fig. 3d. Assuming a MOSFETlike behavior for the graphene 2D carrier gas, we extracted the carrier mobility values from the ID–VG curve using the following expression:42 μ¼
! " L dI D WCG V D dV G
ð1Þ
where CG is the capacitance of the 300 nm-thick SiO2 dielectric (1.15 × 10⁻⁸ F cm−2) and VD is the (constant) drain voltage used in our measurements (10 mV). We have neglected the quantum capacitance of graphene, since it is in series with the much smaller SiO2 capacitance. We find mobility values of 4450 and 5450 cm2 V−1 s−1 for respectively holes and electrons. Since the channel length of our transistor is several times the graphene grain size (see Fig. 4 and its comments), the carrier mobility values that we measure are surprisingly high, bearing in mind the deleterious effect of grain boundaries on electronic transport in graphene.16,17 Actually, those carrier mobility values are comparable to recent values measured on millimeter-size single crystalline graphene grains also transferred on SiO2.43 Again, it seems that minimizing corrugations, ripples and wrinkles in graphene films (by providing Cu foils with low surface roughness values as well as roughness stability during graphene growth) is as important as increasing grain size (i.e. minimizing the density of grain boundaries) in order to obtain high electrical quality graphene films. However, we emphasize that due to the high supersaturation of the gas phase, the graphene growth time used in this work is only ∼10 minutes, which is much more practical than the several hours necessary to grow large grains at low supersaturation.17,43 Finally, in order to better characterize and understand the overall properties of our graphene films, we analyzed the graphene nucleation density and grain growth on various Cu samples. As with previous works, we stopped the growth before reaching full surface coverage in order to determine the graphene nucleation density. Fig. 4 shows scanning electron microscopy (SEM) images of graphene grains on different Cu substrates (RAW, EP and A-EP). The dark areas on those SEM pictures indicate graphene grains and the bright areas correspond to the bare Cu surface. Irregularly shaped graphene grains were observed in the SEM images of all samples due to the low H2 flow rate (2 sccm) used in this work. Hydrogen plays an important role in the graphene growth with methane because it controls the shape and size of growing grains by etching away weak carbon–carbon bonds. Our observations are consistent with those of Vlassiouk et al. who reported that a low hydrogen pressure caused irregularlyshaped graphene grains.12 In contrast, a high hydrogen pressure resulted in hexagon-shaped compact graphene grains.
This journal is © The Royal Society of Chemistry 2014
View Article Online
Published on 11 September 2014. Downloaded by Sungkyunkwan University on 11/05/2015 18:15:03.
Nanoscale
Graphene grains on RAW samples exhibit a straight line pattern which is related to preferential nucleation on the rolling marks of the raw Cu substrates as already discussed by Han et al.9 Moreover, as summarized in Fig. 4d, the nucleation density is very high on those RAW samples resulting in a small grain size (typically below 1 µm). We considered each graphene flake on the Cu surface as a single crystalline grain whose final size was estimated by measuring the distances between centers of nearest-neighbor grains; the average distance was considered as the average graphene grain size. The straight line pattern of graphene grains disappears on EP and A-EP samples since the original rolling marks were removed by electropolishing as shown in Fig. 4b and c, respectively. The graphene flakes appear relatively homogeneous in size on EP and A-EP samples. The average grain size for all samples is summarized on Fig. 4d.
Conlusion In conclusion, we have presented a clear correlation between the electrical properties of polycrystalline graphene films and the surface roughness values of the Cu foils. Moreover, when Cu foils are stabilized by a pre-annealing treatment before electropolishing, their surface roughness does not significantly vary during graphene synthesis. In such conditions, excellent polycrystalline graphene films can be synthesized in a short time.
Experimental section
Paper
Synthesis and transfer of graphene Graphene was synthesized in a 2 inch quartz tube which was evacuated by a rotary pump. Firstly, Cu substrates were heated to 1000 °C at a heating rate of 16.25 °C min−1 under a H2 flow of 30 sccm. The pressure inside the tube was regulated at ∼0.1 Torr. The temperature was maintained at 1000 °C for 30 min under the identical H2 flow rate and pressure. In the next step, H2 (2 sccm) and CH4 (20 sccm) were supplied at 1000 °C for 10 min to synthesize graphene. The pressure slightly increased to 0.15 Torr during graphene growth. Finally, the Cu substrates were rapidly cooled to room temperature without any gas flow by moving the furnace out of the growth region.5,7 The synthesized graphene films were transferred onto glass or SiO2 (300 nm)/Si substrates following a protocol published previously.5,9,10 A thin layer of PMMA dissolved in chlorobenzene (Sigma-Aldrich, No. 182265, 46 mg mL−1) was first spin-coated on top of the graphene/Cu substrate, followed by drying at room temperature. The graphene grown on the rear side of the Cu substrate was then removed by O2 plasma. In the next step, the Cu substrate was etched using an FeCl3-based Cu etchant (Transene, CE-100) for 1 h.9 The PMMA/graphene layer was rinsed using DI water for 2 hours. The PMMA/graphene layer was also treated with 0.5 M HCl solution to remove the iron nanoparticle residues, followed by rinsing with DI water for 2 hours (see ESI, Fig. S10†).10 Finally, the PMMA/Graphene layer was transferred onto the glass or SiO2 (300 nm)/Si substrates. The PMMA layer was removed using acetone for 1 h. The specimens were also annealed at 500 °C for 1 h under flowing Ar (100 sccm) and H2 (30 sccm) in a 2 inch quartz tube to further remove the PMMA residues.
Surface preparation of Cu substrates Throughout this study, we used Nilaco Cu foils with a purity of 99.96%. The surface roughness of the Cu substrates was controlled by electropolishing.21 For roughness values below 50 nm (unless specified, all RMS roughness values were measured on 50 µm × 50 µm surface areas) we have used a current density of 380 mA cm−2 in 2.17 M H3PO4 electrolytes (with an ethylene glycol additive) at temperatures of 35, 40 and 65 °C, resulting in RMS roughness values of 50, 49 and 25 nm, respectively. For RMS roughness values above 50 nm, we have used a current density of 100 mA cm−2 in 7.59 M H3PO4 electrolytes (still with an ethylene glycol additive) at temperatures of 55, 65 and 75 °C, all resulting in RMS roughness values of ∼100 nm. The electropolishing time was 5 minutes for all situations. The surface of Cu foils was etched away during electropolishing21 which also removes possible surface contaminants. The optical images of a Cu foil before and after electropolishing are provided in ESI Fig. S8.† For the pre-annealing process, raw Cu substrates were heated to 1050 °C at a heating rate of 17.5 °C min−1 under a H2 flow of 30 sccm in a 2 inch-diameter quartz tube which was pumped down to ∼0.1 Torr. The temperature was maintained at 1050 °C for 30 min under the H2 flow. Finally, the H2 flow was stopped, and the Cu substrates were rapidly cooled down to room temperature.
This journal is © The Royal Society of Chemistry 2014
Characterizations The surface roughness of Cu substrates was characterized by AFM (Veeco, diINNOVA 840-012-711). The surface composition of Cu substrates was investigated by XPS (ESCA 2000, Al Kα X-ray). The transmittance of graphene on glass substrates was measured using an ultraviolet-visible spectrometer (Agilent 8453). The X-ray diffraction (XRD) spectra were obtained on a Rigaku X-ray Diffractometer (Rigaku Smart Lab) with Cu Kα radiation (λ = 1.54056 Å) at 45 kV and 200 mA. The recorded XRD spectra match the JCPDS pattern of Cu (04-0836). Scanning electron microscopy observations were performed on a JEOL JSM7500F equipment. Raman spectra were acquired at an excitation wavelength of 532 nm (Renishaw, RM1000 microprobe). The resistance of graphene was measured in ambient air environment by a four-point probe in-line method with a current source (Keithley 6221) and a nanovoltmeter (Keithely 2182A).37,38 The distance between tungsten probes was 1 mm. For the van der Pauw measurements in ambient air environment, we used a Keithley 2000 multimeter. The four probes were located on the corners of a square-shaped graphene sample (∼5 mm × 5 mm) and high purity indium (Sigma-Aldrich, No. 264075, purity 99.99%) was used as contact between the graphene sheet and the four probes. Details concerning the calculation of the sheet
Nanoscale, 2014, 6, 12943–12951 | 12949
View Article Online
Published on 11 September 2014. Downloaded by Sungkyunkwan University on 11/05/2015 18:15:03.
Paper
resistance are given in the ESI (see ESI, Fig. S9†). The mobility was characterized using graphene field-effect transistors. The graphene was transferred on SiO2 (300 nm)/Si substrates after etching the copper substrate using ammonium peroxydisulfate solution (Alfa Aesar 54106, 98.0%, 0.5 M). The active channel region was defined via standard e-beam lithography and oxygen plasma etching (480 mTorr, 20 W, 10 s). Metal electrodes were also patterned by e-beam lithography followed by Cr/Au (5 nm/50 nm) deposition by e-beam evaporation (10−6 Torr). After the lift-off process, the devices were carefully rinsed using acetone and IPA followed by annealing in vacuum (10−6 Torr) under N2 (100 sccm) at 200 °C. This annealing process removes adsorbates on the graphene surface, and improves contact adhesion between graphene and metal. After cooling to room temperature, I–V measurements were performed using a Keithley 4200 probe station under vacuum (5.5 × 10⁻⁶ Torr).
Acknowledgements This work was supported by a National Research Foundation of Korea (NRF) grant (no. 2012-R1A2A2A01013312) funded by the Korean government (MSIP), the Center for Advanced Soft-Electronics funded by the Ministry of Science, ICT and Future Planning as Global Frontier Project (CASE-2014M3A6A5060951), and the Human Resources Development program (no. 20124010203270) of the KETEP grant funded by the Korean government Ministry of Knowledge Economy.
References 1 K. S. Novoselov, A. K. Geim, S. V. Morozov, D. Jiang, Y. Zhang, S. V. Dubonos, I. V. Grigorieva and A. A. Firsov, Science, 2004, 306, 666. 2 P. W. Sutter, J. Flege and E. A. Sutter, Nat. Mater., 2008, 7, 4061. 3 Y. Pan, H. Zhang, D. Shi, J. Sun, S. Du, F. Liu and H. Gao, Adv. Mater., 2009, 21, 2777. 4 S. J. Chae, F. Güneş, K. K. Kim, E. S. Kim, G. H. Han, S. M. Kim, H. Shin, S. Yoon, J. Choi, M. H. Park, C. W. Yang, D. Pribat and Y. H. Lee, Adv. Mater., 2009, 21, 2328. 5 X. Li, W. Cai, J. An, S. Kim, J. Nah, D. Yang, R. Piner, A. Velamakanni, I. Jung, E. Tutuc, S. K. Banerjee, L. Colombo and R. S. Ruoff, Science, 2009, 324, 1312. 6 K. S. Kim, Y. Zhao, H. Jang, S. Y. Lee, J. M. Kim, K. S. Kim, J. Ahn, P. Kim, J. Choi and B. H. Hong, Nature, 2009, 457, 706. 7 S. Bae, H. Kim, Y. Lee, X. Xu, J. Park, Y. Zheng, J. Balakrishnan, T. Lei, H. R. Kim, Y. I. Song, Y. Kim, K. S. Kim, B. Özyilmaz, J. Ahn, B. H. Hong and S. lijima, Nat. Nanotechnol., 2010, 5, 574. 8 G. A. Lopez and E. J. Mittemeijer, Scr. Mater., 2004, 51, 1.
12950 | Nanoscale, 2014, 6, 12943–12951
Nanoscale
9 G. H. Han, F. Günes, J. J. Bae, E. S. Kim, S. J. Chae, H. Shin, J. Choi, D. Pribat and Y. H. Lee, Nano Lett., 2011, 11, 4144. 10 S. Bhaviripudi, X. Jia, M. S. Dresselhaus and J. Kong, Nano Lett., 2010, 10, 4128. 11 H. Kim, C. Mattevi, M. R. Calvo, J. C. Oberg, L. Artiglia, S. Agnoli, C. F. Hirjibehedin, M. Chhowalla and E. Saiz, ACS Nano, 2012, 6, 3614. 12 I. Vlassiouk, M. Regmi, P. Fulvio, S. Dai, P. Datskos, G. Eres and S. Smirnov, ACS Nano, 2011, 5, 6069. 13 P. R. Kidambi, C. Ducati, B. Dlubak, D. Gardiner, R. S. Weatherup, M. Martin, P. Seneor, H. Coles and S. Hofmann, J. Phys. Chem. C, 2012, 116, 22492. 14 O. I. Sarajlic and R. G. Mani, Chem. Mater., 2013, 25, 1643. 15 A. W. Tsen, L. Brown, M. P. Levendorf, F. Ghahari, P. Y. Huang, R. W. Havener, C. S. Ruiz-Vargas, D. A. Muller, P. Kim and J. Park, Science, 2012, 336, 1143. 16 Q. Yu, L. A. Jauregui, W. Wu, R. Colby, J. Tian, Z. Su, H. Cao, Z. Liu, D. Pandey, D. Wei, T. F. Chung, P. Peng, N. P. Guisinger, E. A. Stach, J. Bao, S. Pei and Y. P. Chen, Nat. Mater., 2011, 10, 443. 17 H. Zhou, W. J. Yu, L. Liu, R. Cheng, Y. Chen, X. Huang, Y. Liu, Y. Wang, Y. Huang and X. Duan, Nat. Commun., 2013, 4, 2096. 18 M. I. Katsnelson and A. K. Geim, Philos. Trans. R. Soc. London, Ser. A, 2008, 366, 195. 19 W. Zhu, T. Low, V. Perebeinos, A. A. Bol, Y. Zhu, H. Yan, J. Tersoff and P. Avouris, Nano Lett., 2012, 12, 3431. 20 N. Liu, Z. Pan, L. Fu, C. Zhang, B. Dai and Z. Liu, Nano Res., 2011, 4, 996. 21 G. D. Kwon, Y. W. Kim, E. Moyen, D. H. Keum, Y. H. Lee, S. Baik and D. Pribat, Appl. Surf. Sci., 2014, 307, 731. 22 Z. Luo, Y. Lu, D. W. Singer, M. E. Berck, L. A. Somers, B. R. Goldsmith and A. T. C. Johnson, Chem. Mater., 2011, 23, 1441. 23 B. Zhang, W. H. Lee, R. Piner, I. Kholmanov, Y. Wu, H. Li, H. Ji and R. S. Ruoff, ACS Nano, 2012, 6, 2471. 24 Z. Yan, J. Lin, Z. Peng, Z. Sun, Y. Zhu, L. Li, C. Xiang, E. L. Samuel, C. Kittrell and J. M. Tour, ACS Nano, 2012, 6, 9110. 25 I. Vlassiouk, P. Fulvio, H. Meyer, N. Lavrik, S. Dai, P. Datskos and S. Smirnov, Carbon, 2012, 54, 58. 26 F. J. Bradshaw, R. H. Brandon and C. Wheeler, Acta Metall., 1964, 12, 1057. 27 I. Vlassiouk, S. Smirnov, M. Regmi, S. P. Surwade, N. Srivastava, R. Feenstra, G. Eres, C. Parish, N. Lavrik, P. Datskos, S. Dai and P. Fulvio, J. Phys. Chem. C, 2013, 117, 18919. 28 J. M. Wofford, S. Nie, K. F. McCarty, N. C. Bartelt and O. D. Dubon, Nano Lett., 2010, 10, 4890. 29 K. Hayashi, S. Sato and N. Yokoyama, Nanotechnol., 2013, 24, 025603. 30 N. R. Wilson, A. J. Marsden, M. Saghir, C. J. Bromley, R. Schaub, G. Costantini, T. W. White, C. Partridge, A. Barinov, P. Dudin, A. M. Sanchez, J. J. Mudd, M. Walker and G. R. Bell, Nano Res., 2013, 6, 99.
This journal is © The Royal Society of Chemistry 2014
View Article Online
Published on 11 September 2014. Downloaded by Sungkyunkwan University on 11/05/2015 18:15:03.
Nanoscale
31 A. C. Ferrari, J. C. Meyer, V. Scardaci, C. Casiraghi, M. Lazzeri, F. Mauri, S. Piscanec, D. Jiang, K. S. Novoselov, S. Roth and A. K. Geim, Phys. Rev. Lett., 2006, 97, 187401. 32 L. M. Malard, M. A. Pimenta, G. Dresselhaus and M. S. Dresselhaus, Phys. Rep., 2009, 473, 51. 33 J. Iijima, J. Lim, S. Hong, S. Suzuki, K. Mimura and M. Isshiki, Appl. Surf. Sci., 2006, 253, 2825. 34 Y. Hao, M. S. Bharathi, L. Wang, Y. Liu, H. Chen, S. Nie, X. Wang, H. Chou, C. Tan, B. Fallahazad, H. Ramanarayan, C. W. Magnuson, E. Tutuc, B. I. Yakobson, K. F. McCarty, Y. Zhang, P. Kim, J. Hone, L. Colombo and R. S. Ruoff, Science, 2013, 342, 720. 35 M. R. Louthan Jr., J. Fail. Anal. Prevent., 2008, 8, 289.
This journal is © The Royal Society of Chemistry 2014
Paper
36 P. L. Levesque, S. S. Sabri, C. M. Aguirre, J. Guillemette, M. Siaj, P. Desjardins, T. Szkopek and R. Martel, Nano Lett., 2010, 11, 132. 37 F. Smits, Bell Syst. Tech. J., 1958, 37, 711. 38 Y. Oh, D. Suh, Y. Kim, E. Lee, J. S. Mok, J. Choi and S. Baik, Nanotechnol., 2008, 19, 495602. 39 L. J. van der Pauw, Philips Tech. Rev., 1958, 20, 220. 40 D. W. Koon, Rev. Sci. Instrum., 1989, 60, 271. 41 D. W. Koon, A. A. Bahl and E. O. Duncan, Rev. Sci. Instrum., 1989, 60, 275. 42 D. A. Neamen and B. Pevzner, Semiconductor physics and devices: basic principles, McGraw-Hill, New York, USA, 2003. 43 S. Chen, H. Ji, H. Chou, Q. Li, H. Li, J. W. Suk, R. Piner, L. Liao, W. Cai and R. S. Ruoff, Adv. Mater., 2013, 25, 2062.
Nanoscale, 2014, 6, 12943–12951 | 12951