View Article Online View Journal
Nanoscale Accepted Manuscript
This article can be cited before page numbers have been issued, to do this please use: A. Balcytis, M. Ryu, G. Seniutinas, P. R. Stoddart, M. A. Al Mamun, J. Morikawa and S. Juodkazis, Nanoscale, 2016, DOI: 10.1039/C6NR06904E. Volume 8 Number 1 7 January 2016 Pages 1–660
Nanoscale www.rsc.org/nanoscale
This is an Accepted Manuscript, which has been through the Royal Society of Chemistry peer review process and has been accepted for publication. Accepted Manuscripts are published online shortly after acceptance, before technical editing, formatting and proof reading. Using this free service, authors can make their results available to the community, in citable form, before we publish the edited article. We will replace this Accepted Manuscript with the edited and formatted Advance Article as soon as it is available. You can find more information about Accepted Manuscripts in the author guidelines.
ISSN 2040-3364
PAPER Qian Wang et al. TiC2: a new two-dimensional sheet beyond MXenes
Please note that technical editing may introduce minor changes to the text and/or graphics, which may alter content. The journal’s standard Terms & Conditions and the ethical guidelines, outlined in our author and reviewer resource centre, still apply. In no event shall the Royal Society of Chemistry be held responsible for any errors or omissions in this Accepted Manuscript or any consequences arising from the use of any information it contains.
rsc.li/nanoscale
Page 1 of 6
Nanoscale View Article Online
DOI: 10.1039/C6NR06904E
Nano-rescaling of gold films on polystyrene: thermal management for SERS† Armandas Balˇcytis,∗a,b‡ Meguya Ryu,c‡ Gediminas Seniutinas,a,d Paul R. Stoddart,e Md Abdullah Al Mamun,a Junko Morikawa∗c and Saulius Juodkazisa, f
Nano-textured Au surfaces were prepared on pre-stretched 2D polystyrene (PS) sheets sputtered with different thicknesses of Au. The Au-coated PS was subjected to thermal annealing above the glass transition temperature at ∼ 150◦ C, thus undergoing surface area rescaling via a volume phase transition. The yellow color of the Au changed from the typical mirror-like appearance to a diffusive dark yellow, progressing to dark brown at the smallest feature size, hence, electromagnetic energy is coupled into the substrate. While the surface area footprint is the same after shrinking the PS, the roughness can be modified from nano- to micro-scale for different initial thicknesses of sputtered Au. The nanometer-sized features of surface wrinkles on the Au films makes them suitable for surface-enhanced Raman scattering (SERS) sensors that can reach ∼ 104 counts/s/mW. The thermal diffusivity of the contracted surfaces was determined by a noncontact temperature wave method and was larger than that of PS (α ' 1.1 × 10⁻⁷ m2 /s) with a linear scaling on the Au thickness: each 10 nm addition of Au increased the diffusivity by 4%. This allows improved heat dissipation from the laser irradiated spot during SERS measurements.
1
Introduction
Nano-textured materials are finding an increasing number of applications in solar and fuel cells, sensors, super-capacitors, antifouling, bactericidal and super-hydrophobic surfaces. In the fields of chemical and biomedical sensing, there is a continuing challenge to reduce the fabrication costs of single-use substrates of high light scattering efficiency for surface-enhanced Raman scattering/spectroscopy (SERS). The availability of simple to fabricate and cost effective substrates is one major prerequisites for the broad adoption of SERS 1 . Numerous approaches to simplify fabrication have been proposed, including nanoparticle printing 2 , electrochemically structured gold surfaces 3 , metal deposition on templates 4,5 as well as self-assembly techniques 6,7 .
a
School of Science, Swinburne University of Technology, John St., Hawthorn, Victoria 3122, Australia. E-mail:
[email protected] b Department of Laser Technologies, Center for Physical Sciences and Technology, Savanoriu Ave. 231, LT-02300 Vilnius, Lithuania. c Tokyo Institute of Technology, Meguro-ku, Tokyo 152-8550, Japan. E-mail:
[email protected] d Paul Scherrer Institut, CH-5232 Villigen PSI, Switzerland. e ARC Training Centre in Biodevices, Swinburne University of Technology, John St., Hawthorn, Victoria 3122, Australia. f Melbourne Centre for Nanofabrication, the Victorian Node of the Australian National Fabrication Facility, 151 Wellington Rd., Clayton, VIC 3168, Australia. † Electronic Supplementary Information (ESI) on nanoscale features of Au surface available ‡ These authors contributed equally to this work.
Inherent randomness of the nano-textured patterns, while detrimental to the uniformity of performance, has been shown to be favorable for increasing the SERS intensity via the formation of hot spots in which light is concentrated 8 . The surface roughness of plasmonic metal coatings can be tuned from very smooth surfaces that support long surface-wave propagation distances, to highly roughened surfaces that are strongly scattering 9 . Even conductive metal films can appear dark due to the anti-reflection property defined by a gradual change of refractive index at the roughened interface e.g. gold can appear black 10–12 . A simple and novel technique for creating nano-structured metallic surfaces involves the deposition of a thin metal layer onto a sheet of polystyrene (PS) or other pre-stretched polymer. Subsequently, when the coated plastic is heated above its glass transition temperature, it shrinks into an equilibrium state that conserves the volume. This contraction gives rise to a roughly two-fold decrease of the area dimensions 13 . Under these conditions the stiffer metal thin film buckles and even can crack to create wrinkle or flake structures, depending on the hardness of the metal. Furthermore, the resulting structures can be described in a predictive way by a characteristic length 14 : λs = 2πhs
p 3 ES /EB ,
(1)
where hs is the thickness of the metal skin layer, and ES and EB are the Young’s moduli of the metal film and the substrate, respectively. Such wrinkled structures have been shown to perform well J our na l Na me, [ y ea r ] , [ vol . ] , 1–6 | 1
Nanoscale Accepted Manuscript
Published on 30 November 2016. Downloaded by Tokyo Institute of Technology on 03/12/2016 08:26:07.
J our nal Name
Nanoscale
Page 2 of 6 View Article Online
2 2.1
Experimental Nano-wrinkled films of Au on polysterene
Large A4 format PS sheets of 0.2 mm thickness (Acrysunday Co., Ltd., Japan) were used as substrates for the fabrication of nanowrinkled substrates for SERS. The PS was washed and rinsed in methanol before Au deposition by magnetron sputtering (AXXIS physical vapor deposition system, Kurt J. Lesker). The coating thickness was measured on a flat PS reference surface using a 3D optical profiler (Contour GT-K1, Bruker). Scanning electron microscopy (SEM) was used for structural inspection of the coatings (Raith 150TWO). Thermal annealing was carried out on a hot plate at 150 ◦ C with the sample placed between two sapphire plates with high quality optical surfaces. The sapphire plates provided a uniform temperature distribution as the mechanical phase transition took place and the PS underwent lateral shrinkage and perpendicular expansion. 2.2
IR characterisation and SERS
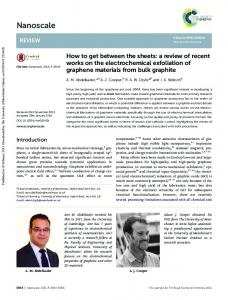
The IR spectral properties were investigated using a mapping spectrometer (Spotlight, PerkinElmer) and an attenuated total reflection Fourier transform IR (ATR-FTIR) spectrometer with a diamond window (Alpha, Bruker). Typical spectra of PS and the solvents used in SERS are shown in Fig. 1. Raman scattering spectra were measured using an In-Via Raman microscope (Renishaw Plc) with λ = 785 nm laser excitation. The laser beam was focused to a line with dimensions of 20 × 2 µm by a 50× objective lens (NA = 0.75). The Au sputtered PS substrates were functionalized with thiophenol by immersing in a 10 mM ethanolic solution for thirty minutes, followed by rinsing in ethanol and blow-drying with N2 . At least 25 different measurement positions were probed for each of the substrates to obtain information on the statistical distribution of SERS performance. Temperature diffusivity on the nano-textured surface was measured via IR imaging. Laser light at 630 nm wavelength was modulated at 1 Hz frequency and the image obtained by a µbolometer camera integrating IR wavelengths in the range 7 − 14 µm. The thermal image was analysed using fast Fourier trans-
2|
J our na l Na me, [ y ea r ] , [ vol . ] , 1–6
form (FFT), with the FFT amplitude proportional to the temperature on the surface. Light excitation can be delivered from the back-side through the PS or from the front at slanted incidence. In the case back-side illumination is used, the thermally rescaled Au coated PS sheets (which transversely expand to a 0.5 mm thickness form the original 0.2 mm) were suspended in epoxy resin and mechanically polished down to a residual thickness of 100 µm. This was done to minimize light scattering in the underlying PS sheet.
3
Results and discussion
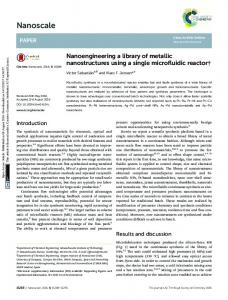
3.1 Nano-wrinkled Au as SERS substrate The formation of nano-wrinkled Au surfaces by size rescaling of consumer-grade, pre-stretched PS sheets was carried out for several thicknesses of sputtered Au film. Figure 2 shows SEM images of the nano-textured surfaces which were obtained by the simple procedure of placing a 1 × 1 cm2 square of PS covered with Au on a hot plate for few minutes (see Supplement for SEM images formed by the back-scattered and secondary electrons). The characteristic length of the wrinkles scales according to Eqn. 1 with EB ≈ 3 GPa for PS and ES = 74 GPa for Au. Hence the size of the wrinkles is expected to be λs ' 2.2 × hs . Polystyrene - a typical polymer - is formed from coils composed of segments that can also have their own larger or smaller scale structure; isotactic PS can crystallise 21 . If the distance between the ends of the coil is R and the number of building segments is N √ (e.g., smaller coils), then R ∝ N for random walk coils 22,23 . This scaling is behind the fractal nature of the self-similar wrinkles made by thermal shrinkage of PS and rescaling of the deposited Au film. Gold is a good material for such nano-texturing due to its high ductility. Similar tests with Cr (ES = 279 GPa) caused brittle fracture of the Cr film and delamination from the PS. The reflectivity of the nano-wrinkled Au was measured using an FTIR spectrometer in the 2.5 - 16 µm wavelength range. The smallest thickness of Au film was hs = 10 nm, hence the wrinkle wavelength was λs ' 22 nm. This sample had a dark appearance (see inset of Fig. 3). The thicker Au films had a yellow tint, but did not exhibit specular reflectance. Strong reflectivity changes from 10 to 90% can be created over the measured IR spectral range using thin nano-textured Au films. Such surfaces can be
H 2O 0.50
EtOH MeOH Polystyrene
0.25
0.00 4000
3000
2000
1000 -1
Wavenumber (cm ) Fig. 1 Near-infrared absorbance spectra of polystyrene (PS) and solvents used in the SERS analysis.
Nanoscale Accepted Manuscript
as surface-enhanced fluorescence substrates 15 , and were also reported under certain conditions to be both bactericidal and hydrophobic, hence self-cleaning 16 . It has been proposed to control the surface morphology by inducing variations in the crosslinking of the polymer surface, which has been shown to influence the wrinkle pattern 17 . The novel optical, mechanical and thermal functionalities of these nano-textured surfaces are under active investigation, stimulated by the current trend towards flexible (opto)electronics and wearable sensors 18,19 . Here the properties of nano-scale wrinkles of Au formed on thermally shrunk polystyrene (PS) are investigated for their thermal properties and SERS activity. Thermal diffusivity on nanometer-thick Au was determined by IR imaging using temperature wave analysis 20 , while the SERS performance was evaluated as a function of Au film thickness.
Absorbance
Published on 30 November 2016. Downloaded by Tokyo Institute of Technology on 03/12/2016 08:26:07.
DOI: 10.1039/C6NR06904E
Page 3 of 6
Nanoscale View Article Online
50 nm
100 nm
10 nm
Fig. 2 SEM images of thermally shrunken and buckled Au films on polystyrene (PS), with coating thicknesses from 10 to 290 nm. Thermal treatment was performed at 150 ◦ C
(b)
(a)
100
Au (nm): 10 50 100 290
Reflectance (%)
100
10 4000
CO2
3000
2000
1000 -1
Wavenumber (cm )
90
Au (nm): 10 50 290
CO2
80 4000
3000
2000
1000 -1
Wavenumber (cm )
Fig. 3 Reflectance spectra of Au nano-wrinkles made by thermal shrinking of PS for different film thicknesses of sputtered Au. Inset shows photographs of ∼ 5 × 5 mm2 samples. (b) Reflectivity of the Au sputtered films on PS before thermal rescaling. The Au reference mirror of the Spotlight spectrometer (Perkin Elmer) was used to carry out normalisation by assuming R = 1. Note the different scales for the y-axes.
used for IR optical applications and are simpler to fabricate than metal-coated photonic crystals 24 . Figure 4 shows the SERS performance of nano-wrinkled Au films on PS as well as its average variability. For thinnest 10 nm gold coatings, a uniformly modest signal intensity with small spread was observed. On the other hand, the thickest 290 nm wrinkled gold films had slightly better signal enhancement compared to the 10 nm case, but also high variability, with some rare outlier points having thiphenol peak intensities on par with the 50-100 nm Au thickness substrates, on which strongest enhancements and the lowest relative variability of ∼ 29% were observed. When measured under the same excitation conditions, the intensity of the thiophenol SERS spectra measured using the 100 nm nano-wrinkled Au substrates is comparable to other nanotextured Au surfaces made by more complicated fabrication methods of laser ablation, plasma or chemical etching 25–28 . Similarly
to the case of black-Si 27 or black-CuO 29 , which have a random arrangement of nano-needles on the surface, SERS measurements are sensitive to the focusing. This is explained by the axial extent of the nano-needles and optimisation has to be carried out to select an objective lens with matching depth of field. For surface wrinkles larger than λs ' 220 nm, it appears that surface roughness due to the height of the wrinkles causes strong scattering out of the solid angle of the focusing (collection) optics and the SERS intensity drops for larger thicknesses of Au with larger wrinkles. The SERS maximum was observed for the 100 nm Au coating, with wrinkles of λs = 216 nm close to the λ /4 ' 200 nm distance of the Raman excitation wavelength. This sample surface appeared yellow, indicating that strong scattering could be expected for Raman excitation or Stokes scattered light at around 600 nm wavelength. The same initial surface area of Au (due to the same roughness) J our na l Na me, [ y ea r ] , [ vol . ] , 1–6 | 3
Nanoscale Accepted Manuscript
Au 290 nm
10 µm
Reflectance (%)
Published on 30 November 2016. Downloaded by Tokyo Institute of Technology on 03/12/2016 08:26:07.
DOI: 10.1039/C6NR06904E
Nanoscale
Page 4 of 6 View Article Online
1.0 0.8
(a)
(b)
Au (nm): 10 nm 50 nm 100 nm 290 nm
1.2 1.0 0.8
0.6
0.6
0.4
0.4
0.2
0.2
0.0 500
1000
1500
Raman shift (cm-1)
0
100
200
0.0 300
Au layer thickness (nm)
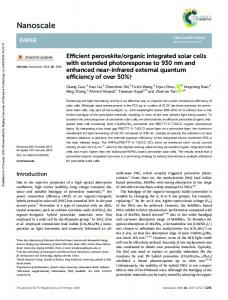
Fig. 4 (a) SERS intensity from a thiophenol self-assembled monolayer on wrinkled Au of different coating thicknesses. (b) The maximum SERS intensity (taken as an average of the three major peaks around 1000 cm−1 ) as well as its average spot-to-spot variability vs Au thickness.
at different sputtered Au film thicknesses showed similar SERS performance. Note that the thickness has to be larger than 50-60 nm to reduce transmission to a negligible level. The reference Au film on PS before thermal treatment provided comparable SERS performance. After the formation of wrinkles, spectral acquisition over the same laser spotsize resulted in a strong SERS enhancement, which peaked for a Au thickness of 100 nm (Fig. 4). This SERS intensity dependence on Au thickness can be explained by the combined effects that changes in layer morphology due to variable length-scale wrinkle formation, as well as structural differences in the Au film itself, have on the plasmonic properties of the substrate. Purely from the morphology point of view 10 nm thick Au films should give the best performance: then wrinkles are smallest and packed in the densest fashion, so as to maximize the number of possible hot-spot supporting nanoscale gaps per unit surface area. On the other hand, 290 nm thick gold layers have large wrinkles tens of microns in size and mostly produce gaps that are on length scales far beyond plasmonic activity. Conversely, from a structural point of view, thicker gold layers, at least 40 nm in thickness, would be preferable, since only then the roughness needed to couple light into plasmon modes as well as the grain size sufficient to support them is established (see, Supplement). It was previously shown that the SERS intensity increases with the Au film thickness on sapphire 30 , governed by an electrically accessible surface that had an increasing roughness for thicker films. Only when both, morphological and structural, factors are favorable for sufficient density of increased electromagnetic field intensity hot-spots to form (at 50-100 nm Au thicknesses) the highest performance is achieved. Based on this discussion the hot-spots are presumed to be located between the wrinkle-induced nano-gaps. These wrinkled SERS substrates can be used to reveal further intricacies in the contributions and coupling of localised and propagating plasmons over nano-rough and curved surfaces. 3.2 Thermal diffusivity Photothermal effect induced thermal gradients are known to affect SERS measurements through thermodiffusion, also known as
4|
J our na l Na me, [ y ea r ] , [ vol . ] , 1–6
(a)
(b)
Au : 10 nm
630 nm
Amplitude
Bolometer camera
No1
resin
Au
No2
No1
100 µm
Fig. 5 (a) Setup for thermal imaging with two possible illumination ports No. 1 and 2. Au-on-PS samples were mechanically polished to a PS thickness of ∼ 100 µm for back-side optical excitation (port No. 2). The excitation wavelength was λ = 630 nm and illumination was carried out at a repetition rate of 1 Hz. (b) The FFT amplitude of the micro-bolometer thermal image in the 7-14 µm wavelength range. The elipticity is caused by slanted illumination (port No. 1).
the Soret effect 31 . Therefore, for determining the thermal management properties of thermally shrunk Au coated substrates the non-contact temperature wave method using oblique and backside imaging modes was implemented (Fig. 5). The same method was used previously to determine thermal diffusivity in laser modified regions 32 . Gold nano-films on PS were annealed to shrink the polymer, resulting in an approximately 2.5 times increase in the PS sheet thickness. Scattering of light in the PS increased substantially. Hence it was necessary to mechanically polish the Au-on-PS nano-textured samples to have diffraction limited light delivery onto the Au from the PS side (Fig. 5(a)). With a welldefined heat source, the IR background in thermal imaging was also reduced. Figure 5(b)) shows a thermal image of nanotextured Au and the amplitude of the FFT under modulated laser excitation. The thermal diffusivity α = k/(ρc p ) is defined by the thermal conductivity, k [W/(m·K)], mass density ρ [kg/m3 ], and specific heat capacity at constant pressure, c p [J/K]. It defines the temporal evolution of temperature as given by the diffusion equation ∂T = α∇2 T , hence the spatial curvature of temperature. The ∂t materials used in this study have very different thermal diffusivities: 1.27 × 10⁻⁴ m2 /s (Au), ∼ 1.5 × 10⁻⁵ m2 /s (for plastic), ∼ 1.9 × 10⁻⁵ m2 /s (air at RT). If the air gap between the Au ridges is small enough for heat to travel faster in air than over the curved Au valleys, then heat will spread on the surface through the coupled air-Au pathway. To be competitive, the air path should be up to seven times faster, with the proportion given by the ratio αAu /αair ' 6.7. On a flat Au film, the fastest pathway for temperature spreading is in the metal layer, however, on the nanowrinkled surfaces a complex temperature spreading up to 100 times slower was observed. The thermal diffusivity of PS was determined by direct contact measurements and was found to be 1.06 × 10⁻⁷ m2 /s 20 . For the nano-wrinkled Au on PS, the best results were obtained for thinned 100-µm-thick samples in the back side illumination mode (No. 2 in Fig. 5(a)). In this way a small focal spot was placed onto the nano-wrinkled Au sample from the back-side and reduced the light scattering in the PS sheet, which becomes opaque after thermal resizing. The FFT amplitude and phase were calculated from
Nanoscale Accepted Manuscript
1.2
Max. SERS intensity (104 counts s-1 mW-1)
SERS intensity (104 counts s-1 mW-1)
Published on 30 November 2016. Downloaded by Tokyo Institute of Technology on 03/12/2016 08:26:07.
DOI: 10.1039/C6NR06904E
Page 5 of 6
Nanoscale View Article Online
film thickness. Therefore, through changes in the wrinkled pattern, thermal diffusivity can be tuned from the value of flat Au, down to values at which thermal transport and heat dissipation channels through air can become competitive.
1.0
4 0.5
polystyrene
0.0 0
50
100
150
200
250
300
Thickness of Au (nm)
Fig. 6 Thermal diffusivity on the surface of nano-wrinkled Au, measured for different thicknesses of the Au film. Non-contact thermal imaging was used to determine the diffusivity, α, from the slope of FFT images of the phase (insets show the actual images used; port No. 2 in Fig. 5).
the thermal spreading maps thus obtained and the thermal diffusivity was extracted by a standard routine 32 . The resulting thermal diffusivity values are summarised in Fig. 6. Back-side laser heating (port No. 2 in Fig. 5(a)) showed a considerably better signal-to-noise ratio of the phase maps used for determination of the temperature diffusivity (insets in Fig. 6) as compared with the front-side illumination (see, Fig. 5(b)). The change in the slope, γ, of the FFT phase plots (insets in Fig. 6) is related to the change in the thermal diffusivity, α. The phase of the detected q thermal image at the frequency of illumi-
ω x + c 33 , where x is the propagation coornation is ∆θ (x) = 2α dinate, ω is the driving cyclic frequency of the heat source, and the constant c represents the initial phase, which is dependent on the q setup and illumination conditions. A decrease in the slope
ω signifies an increase in the α value and vice versa. Nanoγ ∝ 2α wrinkled Au films of larger thickness showed an almost linear increase in thermal diffusivity, i.e. a reduction in the slope γ can be inferred from the insets of Fig. 6. It was found that each 10 nm of sputtered gold increased the thermal diffusivity by 4% in the tested range of thicknesses from 10 to 290 nm. The way by which thermal diffusion is limited in the nanowrinkled Au substrates can be understood through the variation of mean free path of the thermal carriers Λ, which is the major factor in determining the thermal conductivity k = ρ hviCv Λ/3, where ρ is the mass density, hvi is the average thermal velocity of carriers, and Cv is the heat capacity. In turn, Λ can be expressed as the product of average thermal velocity of carriers and the time interval between scattering events Λ = hvi τtotal . When describing heat transport via multiple thermal energy transfer channels the Matthiessen’s rule applies for carrier scattering rates. The total scattering rate is a sum of different contributions, in this particu−1 −1 −1 = τAu + τAir . lar case, of transport in gold and via air gaps: τtotal Accordingly, in most cases the contribution of Au should be the dominant factor in thermal diffusion. However, as the feature size of nano-wrinkled gold film is decreased, temperature diffusivity likewise decreases linearly. The wrinkled surface can be represented as having different scattering properties for temperature diffusion depending on the "wrinkle wavelength" as well as the
Conclusions
A simple thermal procedure for surface nano-roughening of readily available polymer sheets was used to form Au nano-textures with feature sizes ranging from λs = 20 to 600 nm. A SERS intensity reaching ∼ 104 counts/mW/s for 100 nm Au films makes this substrate very promising for practical applications due to the simple hot-plate fabrication procedure. While PS is an attractive SERS substrate due to its affordability, its poor heat conduction could potentially limit the use of high laser powers required for higher SERS intensities. The SERS substrates demonstrated here have solved this issue, with only 10 nm of gold showing approximately two times larger thermal diffusivity at 2 × 10⁻⁷ m2 /s. Thermal diffusivity was found to scale linearly with the Au thickness: for the best performing 100 nm Au coating, heat dissipation was almost two times larger again. This feature of nano-wrinkled Au surfaces may improve heat dissipation from the focal spot during SERS spectral acquisition and is promising for higher throughput SERS measurements. Substrate heating can also affect the SERS spectrum for exposures below the damage threshold of the analyte. For example, a new 960 cm−1 peak has been reported in thiophenol for power levels above 10 mW 34 , while the intensity and lineshape of the 1575 cm−1 C-C stretching peak is believed to vary with substrate temperature. Therefore the improved heat dissipation of these nanotextured Au surfaces will be used to study these thermal effects in future work. The simple nano-wrinkled Au SERS substrates demonstrated here may also find other applications for nanoscale heat management.
Acknowledgments JM acknowledges support by JSPS KAKENHI Grant Number 25420752. SJ is grateful for partial support via the Australian Research Council DP130101205 Discovery project, a research visit support by Tokyo Institute of Technology via Top Global University project in 2015, and the Australia-JSPS visiting scholar program in 2016. Swinburne’s startup grant for Nanotechnology facility, and the nanotechnology Ambassador fellowship program at the Melbourne Centre for Nanofabrication (MCN) in the Victorian Node of the Australian National Fabrication Facility (ANFF) are acknowledged.
References 1 J. F. Betz, W. W. Yu, Y. Cheng, I. M. Whiteab and G. W. Rublof, Phys. Chem. Chem. Phys., 2014, 16, 2224 – 2239. 2 W. Wu, L. Liu, Z. Dai, J. Liu, S. Yang, L. Zhou, X. Xiao, C. Jiang and V. A. Roy, Sci. Rep., 2015, 5, 10208. 3 M. E. Abdelsalam, P. N. Bartletta, J. J. Baumbergb, S. Cintraa, T. A. Kelfb and A. E. Russell, Electrochem. Commun., 2005, 7, 740 – 744. 4 S. B. Chaney, S. Shanmukh, R. A. Dluhy and Y.-P. Zhao, Appl. Phys. Lett., 2005, 87, 031908. 5 S. Yamazoe, M. Naya, M. Shiota, T. Morikawa, A. Kubo, T. Tani, T. H. amd T. Horiuchi, M. Suematsu and M. Kajimura, ACS Nano, 2014, 8, 5622 – 5632. 6 K. W. Kho, Z. X. Shen, H. C. Zeng, K. C. Soo and M. Olivo, Anal. Chem., 2005, 77, 7462 – 7471.
J our na l Na me, [ y ea r ] , [ vol . ] , 1–6 | 5
Nanoscale Accepted Manuscript
Published on 30 November 2016. Downloaded by Tokyo Institute of Technology on 03/12/2016 08:26:07.
-6
2
Temperature diffusivity (10 m /s)
DOI: 10.1039/C6NR06904E
Nanoscale
Page 6 of 6 View Article Online
7 A. V. Whitney, J. W. Elam, S. Zou, A. V. Zinovev, P. C. Stair, G. C. Schatz and R. P. V. Duyne, J. Phys. Chem. B, 2005, 109, 20522 – 20528. 8 Y. Nishijima, J. B. Khurgin, L. Rosa, H. Fujiwara and S. Juodkazis, Opt. Express, 2013, 21, 13502–13514. 9 K. M. McPeak, S. V. Jayanti, S. J. P. Kress, S. Meyer, S. Iotti, A. Rossinelli, and D. J. Norri, ACS Photonics, 2015, 2, 326 – 333. 10 K. Nishio and H. Masuda, Angewandte Chemie Intern. Ed., 2011, 1603 – 1607. 11 C. Li, O. Dag, T. D. Dao, T. Nagao, Y. Sakamoto, T. Kimura, O. Terasaki and Y. Yamauchi, Nature Commun., 2015, 6, 6608. 12 M. K. Khristosov, L. Bloch, M. Burghammer, Y. Kauffmann, A. Katsman and B. Pokroy, Nature Commun., 2015, 6, 8841. 13 S. Juodkazis, K. Yamasaki, S. Matsuo and H. Misawa, Appl. Phys. Lett., 2004, 84, 514 – 516. 14 K. Efimenko, M. Rackaitis, E. Manias, A. Vaziri, L. Mahadevan and J. Genzer, J. Nat. Mater., 2005, 4, 293 – 297. 15 L. R. Freschauf, J. McLane, H. Sharma and M. Khine, PLoS ONE, 2012, 7, e40987. 16 H. Sharma, M. A. Digman, N. Felsinger, E. Gratton and M. Khine, Opt. Mater. Express, 2014, 4, 753 – 763. 17 B. A. Glatz, M. Tebbe, B. Kaoui, R. Aichele, C. Kuttner, A. E. Schedl, H.-W. Schmidt, W. Zimmermann and A. Fery, Soft Matter, 2015, 11, 3332 – 3339. 18 P. Gutruf, E. Zeller, S. Walia, H. Nili, S. Sriram and M. Bhaskaran, Small, 2015, 11, 4532 – 4539. 19 D. Yin, J. Feng, R. Ma, Y.-F. Liu, Y.-L. Zhang, X.-L. Zhang, Y.-G. Bi, Q.-D. Chen and H.-B. Sun, Nature Commun., 2016, 7, 11573. 20 J. Morikawa, A. Orie, T. Hashimoto and S. Juodkazis, Appl. Phys. A, 2009, 98, 551–556.
6|
J our na l Na me, [ y ea r ] , [ vol . ] , 1–6
21 A. Mamun, N. Okui and M. A. K. Khan, Canad. Chem. Transact., 2013, 1, 267 – 276. 22 P.-G. Gennes, Scaling concepts in polymer physics, Cornell University Press, Ithaca, 1979. 23 A. Y. Grosberg, S. K. Nechaev and E. I. Shakhnovich, J. de Physique, 1988, 49, 2095 – 2100. 24 V. Mizeikis, S. Juodkazis, R. Tarozait˙e, J. Juodkazyt˙e, K. Juodkazis and H. Misawa, Opt. Express, 2007, 15, 8454–8464. 25 R. Buividas, P. R. Stoddart and S. Juodkazis, Annalen der Physik, 2012, 524, L5 – L10. 26 A. Chou, E. Jaatinen, R. Buividas, G. Seniutinas, S. Juodkazis, E. L. Izake and P. M. Fredericks, Nanoscale, 2012, 4, 7419 – 7424. 27 G. Gervinskas, G. Seniutinas, J. S. Hartley, S. Kandasamy, P. R. Stoddart, N. F. Fahim and S. Juodkazis, Annalen der Physik, 2013, 525, 907–914. 28 G. Seniutinas, G. Gervinskas, R. Verma, B. D. Gupta, F. Lapierre, P. R. Stoddart, F. Clark, S. L. McArthur and S. Juodkazis, Optics Express, 2015, 23, 6763 – 6772. 29 A. Balˇcytis, M. Ryu, G. Seniutinas, J. Juodkazyt˙e, B. C. C. Cowie, P. R. Stoddart, M. Zamengo, J. Morikawa and S. Juodkazis, Nanoscale, 2015, 7, 18299 – 18304. 30 R. Buividas, N. Fahim, J. Juodkazyt˙e and S. Juodkazis, Appl. Phys. A, 2013, 14, 169–175. 31 T. Kang, S. Hong, Y. Choi and L. P. Lee, Small, 2010, 6, 2649 – 2652. 32 J. Morikawa, A. Orie, T. Hashimoto and S. Juodkazis, Opt. Express, 2010, 18, 8300–8310. 33 J. Morikawa, E. Hayakawa, T. Hashimoto, R. Buividas and S. Juodkazis, Opt. Express, 2011, 19, 20542–20550. 34 C. Viets and W. Hill, J. Phys. Chem. B, 2001, 105, 6330–6336.
Nanoscale Accepted Manuscript
Published on 30 November 2016. Downloaded by Tokyo Institute of Technology on 03/12/2016 08:26:07.
DOI: 10.1039/C6NR06904E