370
Biophysical Journal
Volume 79
July 2000
370 –376
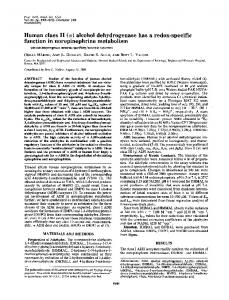
Natural Electrophoresis of Norepinephrine and Ascorbic Acid P. F. Dillon, R. S. Root-Bernstein, P. R. Sears, and L. K. Olson Department of Physiology, Michigan State University, East Lansing, Michigan 48823 USA
ABSTRACT The electric field produced by cell membranes, extending only a few nanometers, is 1000 times stronger than the electric fields required to produce dissociation of molecular complexes. Using the complex formed by norepinephrine (NE) and ascorbic acid (AA), we have demonstrated the quantitative binding of AA to NE, the use of capillary electrophoresis to measure quantitative binding of nonelectrolyte complexes, the determination of a dissociation constant (Kd) from electric field-dissociation constants (Ke), and a model for natural dissociation of the NE–AA complex due to the electric field generated by a cell membrane. NE–AA dissociation constants show little effect of NE concentration or pH changes. NE-related compounds also bind AA: epinephrine ⬎ norepinephrine ⬎ tyrosine ⬎ histamine ⬎ phenylalanine. Serotonin does not bind AA. Phosphorylated AA and glucose also bind NE at 0.05 and 0.08 of the AA binding, respectively. Natural electrophoresis of molecular complexes allows compounds to travel through the body in a protected state and still be available for physiological activity upon reaching a membrane.
INTRODUCTION Biological membranes produce a significant electric field (Delahay, 1966; McLaughlin and Harary, 1974; Moore, 1972; Tien, 1974). An electric field is the length derivative of the membrane voltage as it dissipates into the fluid adjacent to the membrane. The electric field approaches zero within 20 nm away from the membrane when the surrounding fluid has normal physiological salt concentration (Delahay, 1966). Perhaps because of this limited range, there is no research on any physiologic effects of the electric field generated by a cell membrane. Electric fields have been used to separate molecules through capillary electrophoresis (CE) (Dillon and Sears, 1998; Kuhn and Hoffstetter-Kuhn, 1993). CE uses an electric field to drive a carrier buffer from a high voltage toward ground, with the size of the electric field determined by the applied voltage divided by the length of the capillary (Kuhn and Hoffstetter-Kuhn, 1993). During the flow of the buffer, molecules are separated from one another based on their charge-to-mass ratio. Those molecules whose charge is the same as the driving voltage will be repelled by that voltage, and move more quickly in the electric field. Those molecules with opposite charge will have their movement in the electric field retarded by attraction to the driving voltage. It was hypothesized that molecules within the electric field of a membrane could be separated from one another. There has been considerable research in recent years on the molecular binding of pairs of molecules (Dillon and RootBernstein, 1997; Root-Bernstein and Dillon, 1997), including protein– hormone carrier systems (Barnard and Wolff, 1998), antigen–antibody complexes, protein–protein cou-
Received for publication 17 November 1999 and in final form 30 March 2000. Address reprint requests to Patrick F. Dillon, Department of Physiology, 108 Giltner Hall, Michigan State University, East Lansing, MI 48823. Tel.: 517-355-6475 ext. 1227; Fax: 517-355-5125; E-mail:
[email protected]. © 2000 by the Biophysical Society 0006-3495/00/07/370/07 $2.00
pling (Dillon and Clark, 1990; Dillon et al., 1995), and small molecule coupling (Root-Bernstein, 1987). The ability of CE to measure the effect of electric field alteration on molecular coupling was tested. Norepinephrine (NE) and ascorbic acid (AA) have previously been shown to have molecular complementarity with one another (Root-Bernstein, 1989). NE and AA and related compounds were run together through a CE system. These experiments were able to show the appearance of an NE–AA complex, that this complex was concentration dependent, that related compounds showed similar complex formation, that a dissociation constant could be calculated from the concentration dependence of the complex formation, and that the dissociation constant was dependent on the size of the electric field. The range of electric fields over which dissociation of the complex occurs is much smaller than that generated by biological membranes, leading to the formation of a new concept that natural electrophoresis of biological complexes will occur as those complexes approach the membrane. In this manner, coupled molecules will move through the body in a protected state and will still be available to produce physiological actions as they near cells. METHODS Solutions All solutions were prepared in the buffer, which was used in the particular CE experiment, 25 mM sodium borate 10-hydrate (Na2B4O7 䡠 10 H2O) at pH 9.4, 8.9 or 7.4. NE, AA, glucose, and histamine were purchased from Sigma Chem. Co. (St Louis, MO). Epinephrine, tyrosine, phenylalanine, and serotonin were purchased from Aldrich Chem. Co. (Milwaukee, WI). Phosphorylated AA was purchased from Wako Pure Chem. Ind., Ltd. (Japan). All chemicals were made as stock solutions and diluted to the required concentration in the CE injection vials.
CE procedures Samples were vacuum injected into a 100-m diameter, 98-cm length capillary tube (volume 7.7 l) for either 2 or 5 s (injection volume 8.6
Coupling of NE and Ascorbic Acid
371
nl/sec). The capillary tube had a detection window 66 cm from the injection site in an ISCO (Lincoln, NE) model 3850 electropherograph with an absorbance detector at 195 nm, absorbance maximum at either 0.2 or 0.5 absorbance units and a rise time of 3.2 sec. Driving voltage was 10, 12.5, 15, 17.5, or 20 kV, corresponding to electric fields of 102, 128, 153, 179, and 204 V/cm. The peaks were recorded on a chart recorder (The Recorder Co., Houston TX) at 1 cm/min and 1 V full scale.
Data analysis NE was always prepared and run as a 1-mM standard. Changes in free NE in the presence of AA were measured as reductions in peak height from this standard. NE–AA complex was calculated as the remainder of the NE standard minus the free NE at a given AA concentration. In comparison experiments, epinephrine, tyrosine, histamine, phenylalanine, or serotonin was substituted for NE. In other comparison experiments, phosphorylated AA or glucose was substituted for AA. When the combination of molecules produced a new peak in the EPG, the change in the standard was used to calculate the complex fraction, which was then used for calculation of the electric field dependent dissociation constant (Ke). In the cases where no new peak appeared but the standard peak height changed as a function of the concentration of the titrating agent, the highest and lowest peak measurements were used as the limits of the titration for the Ke calculation. Ke was calculated by plotting the log of the AA concentration against the log of the NE–AA complex/free NE ratio and using a least-squares best fit for the linearization and 95% confidence interval in the Axum data processing system. Ke was estimated from the linearization at the 0.5 complex– 0.5 free NE point. The same process was used for the NE substitutions. Estimate of the dissociation constant at zero electric field, the Kd, was made by extrapolating the log of the Ke values at a given electric field to zero electric field. For the AA substitutions, weaker binding would have necessitated using excessive phosphorylated AA-P concentrations. Instead, 5 mM AA, 100 mM AA-P or 100 mM glucose were mixed with 0.1, 0.3, 0.5, 0.7, or 1.0 mM NE and the fractional change from the free NE standard of the same concentration measured. The relative free NE for each condition was measured and the mean of the five concentrations determined.
RESULTS The formation of a NE–AA complex and its field dependence are demonstrated in Fig. 1. The appearance of a new peak in the third electropherogram (EPG) of Fig. 1 results from the presence of both NE and AA, because this peak is not present when only one of the two metabolites is present, as in the first two EPGs of Fig. 1. The appearance of this new peak is accompanied by a decrease in the size of the NE peak. The relative absorbance of AA is much smaller than NE, and the small fractional change in the AA peak produced by the formation of the complex is not measurable. This new peak is dependent on the relative concentrations of NE and AA (Fig. 2). The free NE peak 1.0-mM standard, shown on the right of Fig. 2 at both carrier pH values of 7.4 and 9.4, decreases as the concentration of AA increases at pH 9.4. Concomitantly, the new peak noted in Fig. 1 appears on the left of the free NE peak, its size increasing as the concentration of AA increases. Because no peak appears in this position when only NE or AA is present, the only conclusion possible is that a NE–AA complex is formed. When pH 7.4 carrier buffer is used, the free NE and NE–AA complex run together. The change in height of the peak
FIGURE 1 NE–AA complex formation. NE and AA solutions in 25 mM sodium borate at pH 9.4 are injected separately and together. A new peak appears when they are mixed together before injection. The ⴱ indicates the free NE peak.
corresponds to the increased sensitivity of the NE–AA complex, also seen at pH 9.4 in this figure. Linearization of the titration data, plotting the log(AA concentration) against the log(AA-bound NE/free NE), allows determination of a best fit line and an error estimate for the Ke value. An example of this using the data points (filled triangles) for the titration of NE by AA at 153 V/cm electric field is shown in Fig. 3. The Ke value is shown as the open triangle at the point where the free and bound concentrations of NE are equal. The dashed 95% confidence interval over the range and the 95% confidence interval at the Ke are also shown. The linearization was transformed into a sigmoidal titration curve and the NE–AA complex fraction and the associated titration curves at different electric field strengths are plotted in Fig. 4. The titrations indicate that, as the field strength increases, increased concentrations of AA are needed to saturate NE. This is consistent with an electric field causing separation between associated molecules. Dissociation is due to both the random dissociation of a chemical complex and the energy of the electric field. There is also a general increase in the slope of the dissociation curves as the field increases. In a solely chemical system, an increase in the slope is associated with cooperativity. In this case, however, the electric field may cause a net orientation of the molecules, due to polarization within the electric field, that facilitates interaction in a manner similar to cooperativity. The Ke values change as a function the electric field. When the log(Ke) of the NE–AA dissociation curves in Fig. 4 were plotted, they empirically demonstrated a strong (R2 ⫽ 0.99) relation (Fig. 5). The relation between the Ke and the electric field for NE and AA is
log共Ke兲 ⫽ 0.0130E ⫺ 4.13.
(1)
Biophysical Journal 79(1) 370 –376
372
Dillon et al.
FIGURE 3 Log–log linearization of the AA concentration and the NE– AA/free NE ratio for 1 mM NE at 153 V/cm. The solid line is the least squares best fit (R2 ⫽ 0.95) and the dashed lines are the 95% confidence interval. The open triangle at log ⫽ 0 (NE–AA/free NE ⫽ 1) is the log(Ke) for these conditions and the error bar is the 95% confidence range for the log(Ke). FIGURE 2 Titration of NE with AA in pH 7.4 and 9.4 sodium borate. The AA peak, not shown, is to the right of the NE peak. The ⴱ indicates the free NE peak. At pH 9.4, the new peak that appeared in Fig. 1 increases as the AA concentration increases, and the free NE peak decreases as the AA concentration increases. At pH 7.4, the NE peak height is AA concentration dependent.
At E ⫽ 0, the Ke becomes the Kd. The log(Kd) ⫽ ⫺4.13 converts to 74 M, the dissociation constant for 1 mM NE and AA in the absence of an electric field. The NE concentration dependence of the titration by AA and the pH dependence of the titration were measured and are shown in Table 1. Over a 30-fold change in NE between 1.0 and 0.03 mM the Ke value only changed by a factor of two. The concentration dependence (fugacity) of the coupling of NE and AA is measurable, but small. Applied in a conservative fashion to the Kd estimate above, the Kd as the concentration of NE approaches zero would be about onehalf of what it is at 1.0 mM. Therefore, 37 M may be an appropriate upper limit of the in vivo NE–AA dissociation constant. The pH dependence of the NE–AA binding is also shown in Table 1. The similarity of the titrations at pH 7.4 and 9.4 was demonstrated in Fig. 1. When Ke calculations were made, there was only a very small change in the Ke values over the 2-pH unit range. Both NE and AA are ionized in this pH range, and the absence of a significant change in Biophysical Journal 79(1) 370 –376
their physical state is probably responsible for the similarity in Ke values. Table 2 shows the Ke calculations for the titration of NE-related compounds by AA at 179-V/cm electric field. The variations in structure of the molecules result in differences in binding constants, with epinephrine having a stronger binding to AA than NE under these conditions. Although epinephrine and histamine do not show a new peak when AA is present, there is a significant change in their peak size, allowing calculation of a binding constant. New peaks, similar to those seen during NE–AA binding, appear when tyrosine and phenylalanine are titrated. In the face of this apparently general phenomenon, serotonin has no detectable AA binding. Although it is possible that a serotonin–AA complex has exactly the same absorbance and mobility as serotonin, this is unlikely. Figure 6 shows the effect AA-related molecules have on the NE peak at 154-V/cm electric field. As expected, the peak NE absorbance increases as a function of concentration. When these compounds bind to NE, they form a new peak, decreasing the size of the free NE peak. Over the range of concentrations tested, AA-P and glucose reduced the free NE peak, as did AA. The amount of AA-P or glucose necessary to reduce the free NE peak to the same magnitude as AA was much greater, however. Only 5 mM AA resulted in a reduction of the free NE to 0.54 ⫾ 0.04
Coupling of NE and Ascorbic Acid
FIGURE 4 Electric field dependence of NE–AA binding showing data points and best fit lines of the titration of 1 mM NE by AA at different electric fields. The lines are the transformation of the log–log linearizations of the AA concentrations and the NE–AA/free NE ratio. The R2 values for the linearizations from 102 to 204 V/cm are 0.96, 0.96, 0.95, 0.90, and 0.93. At greater electric fields, more AA is needed to saturate NE.
(SE, N ⫽ 5), whereas 100 mM AA-P was needed to reduce the free NE to 0.50 ⫾ 0.02 (SE, N ⫽ 5). There was no significant difference between the two free NE means. Because 20 times more AA-P than AA was used, AA-P has approximately 0.05 of the relative binding strength of AA for NE. Similarly, 100 mM glucose reduced the free NE peak to 0.29 ⫾ 0.02 (SE, N ⫽ 5). This is a greater reduction than the same concentration of AA-P produced. Based on the titration curve for NE–AA binding at this electric field, glucose binds AA at approximately 0.08 of the binding strength of AA. DISCUSSION The results indicate that electric fields have a significant effect on the binding of NE and AA in particular, and on a variety of other pairs of related compounds as well. CE is a useful tool both for qualitatively demonstrating the coupling of compounds (Figs. 1 and 2), and for quantitatively measuring an electric field-associated dissociation constant, Ke (Fig. 3). The greater the electric field, the more AA is needed to saturate NE, i.e., the electric field contributes to
373
FIGURE 5 Dissociation constant calculation from Ke values in Fig. 4. The error bars are the 95% confidence intervals from the log–log linearizations of the AA concentration and the NE–AA/free NE ratio. The ordinate intercept is the NE–AA dissociation constant in the absence of an electric field.
the dissociation of NE and AA. Further, there is a strong relation between the size of the electric field and the log(Ke) in Fig. 5, producing an entirely new method of measuring the Kd of two compounds. The coupling of NE and AA is robust over a range of concentration and pH changes (Table 1). The coupling process and the ability of CE to measure it appears to be a general phenomenon, extending AA binding to NE-related compounds (Table 2), and NE binding to AA-related compounds (Fig. 6). These results have implications both for AA–NE association and for the effect of electric fields on molecular complexes. The physiological binding of AA and NE can be estimated from the Kd of 37 M calculated above. The normal
TABLE 1 Concentration and pH dependence of norepinephrine–ascorbic acid binding NE (mM), pH, and Electric Field
log Ke ⫾ 95% confidence interval
Ke (mM)
1.0 mM NE, pH 9.4, 179 V/cm* 0.7 mM NE, pH 9.4, 179 V/cm* 0.03 mM NE, pH 9.4, 179 V/cm*
⫺1.89 ⫾ 0.10 ⫺1.97 ⫾ 0.06 ⫺2.19 ⫾ 0.13
12.9 mM 10.7 mM 6.5 mM
1.0 mM NE, pH 9.4, 204 V/cm* 1.0 mM NE, pH 8.9, 204 V/cm* 1.0 mM NE, pH 7.4, 204 V/cm†
⫺1.48 ⫾ 0.21 ⫺1.52 ⫾ 0.27 ⫺1.60 ⫾ 0.24
33.1 mM 30.2 mM 25.1 mM
*Separate NE and NE–AA peaks. † Single NE/NE–AA peak. Biophysical Journal 79(1) 370 –376
374
Dillon et al.
TABLE 2 Ascorbic acid binding of norepinephrine and related compounds Compound* Norepinephrine† Epinephrine‡ Tryptophan† Tyrosine† Histamine‡ Phenylalanine† Serotonin
log Ke ⫾ 95% confidence interval
Ke (mM)
⫺1.81 ⫾ 0.20 15.2 mM ⫺2.10 ⫾ 0.10 7.9 mM ⫺1.91 ⫾ 0.27 12.3 mM ⫺1.56 ⫾ 0.12 27.4 mM ⫺1.48 ⫾ 0.06 33.5 mM ⫺1.45 ⫾ 0.07 35.9 mM No Detectable AA Binding
*1 mM Compound, 179 V/cm. Separate Compound and Compound-AA peaks. ‡ Single Compound/Compound-AA peak. †
human plasma concentration of NE is 1.17 nM (Daniel et al., 1996). The AA concentration in plasma is about 100 M (Ek et al., 1995). Assuming that one molecule of NE binds to one of AA (Root-Bernstein, 1989; Root-Bernstein and Dillon, 1997), then the Henderson–Hasselbach equation can be used to calculate the concentration of free NE in plasma. At normal plasma values, there will be 0.32 nM free NE and 0.85 nM NE–AA, i.e., 73% of the circulating NE would be AA bound. Given the binding of AA and NE to other compounds described above and to other as yet untested compounds, the concentration of NE–AA may be lower. These experiments indicate that a substantial reduction of
free NE occurs in normal human plasma. A similar reduction of free epinephrine undoubtedly occurs due to epinephrine–AA complex formation. Plasma ascorbate concentration has been inversely related to blood pressure when controlled for all other dietary and lifestyle factors (Bendich and Langseth, 1995; Jacques, 1992; Ness et al., 1997). This is consistent with our findings. Having established both that NE and AA associate and that an electric field can disrupt this association, it is reasonable to investigate the effect of the electric field generated by the cell membrane on the NE–AA dissociation constant. There is a substantial body of literature on the effect of charged surfaces on their surroundings. The modified Gouy–Chapman model of a double-layer ion surface is used (Moore, 1972) to account for the closest approach possible by ions. The potential voltage decays exponentially on both sides of membrane (McLaughlin and Harary, 1974). This decay has been modified (Tien, 1974) to account for the unstirred layer immediately adjacent to the membrane where little voltage change occurs. The 2nd Wien effect (Onsager, 1934; Moore, 1972) describes the effect of electric field on the dissociation of weak electrolytes. Using a Debye–Hu¨ckel length constant for the exponential decay of 1 nm for physiological electrolyte concentrations (Delahay, 1966; Moore, 1972; Tien, 1974), the potential on the outside of a membrane can be estimated as
V ⫽ V0exp共⫺x/兲,
(2)
where V is the potential at distance x, with V0 the voltage at the membrane and the length constant. The electric field (E) will then be the length-dependent derivative of the voltage, or
E ⫽ dV/dx ⫽ 共⫺1/兲V0exp共⫺x/兲.
FIGURE 6 Concentration dependence of the NE EPG peak. The free NE peak height is reduced by AA-P, AA, and glucose. Biophysical Journal 79(1) 370 –376
(3)
For mobile complexes that are free to orient themselves in the electric field, E is the absolute value of dV/dx. The electric field at the membrane surface has been estimated in the range of 1–5 ⫻ 105 V/cm (Moore, 1972; Tien, 1974). Based on the high electric field at the membrane, the experimental data reported here makes NE–AA dissociation highly probable and extends the implications of field dissociation to nonelectrolyte complexes, including carrier proteins. We suggest calling this phenomenon membrane-associated or natural electrophoresis. Using an estimate of 30 mV for V0 (McLaughlin and Harary, 1974; Tien, 1974) and a length constant ⫽ 1 nm, at 0.5 nm from the membrane, E would equal 1.8 ⫻ 105 V/cm, in the range cited above. Figure 7 shows the decay in the electric field with increasing distance from the membrane. The electric field near the membrane will be far in excess of the electric field used in the experiments reported here. In this model, the electric fields applied to the NE–AA complex in our experiments would all occur between 7 and 8 nm from the cell membrane or several times the molecular
Coupling of NE and Ascorbic Acid
375
FIGURE 7 External electric field generation by the cell membrane. The electric field exponentially decreases with a length constant of 1 nm. Inset: Electric field-dissociation constant (Ke) dependence on distance from the cell membrane. Significant increases in the dissociation constant occur at relatively low electric fields.
dimensions of the complex, as shown in Fig. 7. The Ke as a function of distance from the membrane for the mobile complex of NE–AA can be calculated from Eqs. 1 and 3 as
log共Ke兲 ⫽ 0.0130共1/兲V0exp共⫺x/兲 ⫺ 4.13.
(4)
This relation is plotted in the inset of Fig. 7, along with the Ke data points from Fig. 5. The dashed line in the inset is the asymptote approached in Eq. 4, the 74-M dissociation constant reported above. As an NE–AA complex approaches the membrane, the dissociation constant will increase exponentially, leading to complete dissociation of the complex, and availability of the pair to receptor sites on the membrane. The high electric field in the dissociation zone may also help orient the individual molecules relative to the membrane (Grossman and Soane, 1990), thereby affecting its binding to the receptor. Receptors will be within the unstirred layer, where the voltage change and thus the electric field is much smaller than outside the unstirred layer (Tien, 1974). In the 20-nm space between most cells, virtually the entire space will have enhanced dissociation. In contrast, in a 7-m-diameter capillary blood vessel, the 10 nm adjacent to the capillary wall represents less than 0.006 of the capillary volume, leaving more than 0.994 of the volume in the bulk, NE–AA binding phase. The fractional dissociation of NE and AA discussed above applies in this phase.
These findings have many implications. AA was originally isolated from the adrenal medulla (Szent-Gyo¨rgi, 1928) and is present in millimolar concentration in the adrenal gland (Dhariwal et al., 1989) and in the brain (Grunewald, 1993; Schreiber and Trojan, 1993). In the adrenal medulla, AA is required for NE synthesis (Dhariwal et al., 1989), and has complex corelease behavior with catecholamines (Cahill and Wightman, 1995). AA may protect NE and epinephrine from oxidation during plasma transport, in the adrenal medulla, and in neurons. In addition to using AA as an enzyme cofactor for NE synthesis, NE–AA complex formation may lower the free product (NE) concentration, accelerating the reaction. The storage of catecholamines in the adrenal medulla will be enhanced by the millimolar concentrations of ascorbate, using a similar mechanism. AA, which has no known membrane transporter, is taken up against a concentration gradient in adrenal chromaffin cells (Ingebretsen et al., 1980). NE–AA complex formation will also serve to store AA in the adrenal medulla, enhancing long-term retention of this rapidly excreted vitamin. The complexation of NE by AA may account for the multiple cardiovascular effects of ascorbate cited above (Bendich and Langseth, 1995; Jacques, 1992; Ness et al., 1997). The laboratory use of AA to prevent oxidation of NE may rely on this coupling. Similar mechanisms may also account for neural co-storage and cotransmission, as well as other complexes such as dopamineneurotensin (Schenk et al., 1991). Complex formation based on molecular complementarity is generalizable to all metabolite complexes, providing protection from enzymatic catalysis and oxidation and enhancing the survival of the constituents. The dissociation of biophysical complexes, as manifested through natural membrane electrophoresis, must also be included in models of carrier protein systems (Barnard and Wolff, 1998).
REFERENCES Barnard, R., and R. C. Wolff. 1998. Analysis and application of an equilibrium model for in vitro bioassay systems with three components: receptor, hormone and hormone-binding-protein. J. Theor. Biol. 190: 333–339. Bendich, A., and L. Langseth. 1995. The health effects of vitamin C supplementation: a review. J. Am. Coll. Nutr. 14:124 –136. Cahill, P. S., and R. M. Wightman. 1995. Simultaneous amperometric measurement of ascorbate and catecholamine secretion from individual bovine adrenal medullary cells. Anal. Chem. 67:2599 –2605. Daniel, M., E. I. Eger, R. B. Weiskopf, and M. Noorani. 1996. Propofol fails to attenuate the cardiovascular response to rapid increases in desflurane concentration. Anesthesiology. 84:75– 80. Delahay, P. 1966. Double Layer and Electrode Kinetics. John Wiley and Sons, New York. 33– 44. Dhariwal, K. R., P. Washko, W. O. Hartzell, and M. Levine. 1989. Ascorbic acid within chromaffin granules. In situ kinetics of norepinephrine biosynthesis. J. Biol. Chem. 264.:15404 –15409 Dillon, P. F., and J. F. Clark. 1990. The theory of diazymes and functional coupling of pyruvate kinase and creatine kinase. J. Theor. Biol. 143: 275–284. Biophysical Journal 79(1) 370 –376
376 Dillon, P. F., and R. S. Root-Bernstein. 1997. Molecular complementarity II: energetic and vectorial basis of biological homeostasis and its implications for death. J. Theor. Biol. 188:481– 493. Dillon, P. F., and P. R. Sears. 1998. Capillary electrophoretic measurement of tissue metabolites. Am. J. Physiol. Cell Physiol. 274:C840 –C845. Dillon, P. F., M. K. Weberling, S. M. LeTarte, J. F. Clark, P. R. Sears, and R. S. Root-Bernstein. 1995. Creatine kinase increases the solubility and enzymatic activity of pyruvate kinase by means of diazymatic coupling. J. Biol. Phys. 21:11–23. Ek, A., K. Strom, and I. A. Cotgreave. 1995. The uptake of ascorbic acid into human umbilical vein endothelial cells and its effect on oxidant insult. Biochem. Pharm. 50:1339 –1346. Grossman, P. D., and D. S. Soane. 1990. Orientation effects on the electrophoretic mobility of rod-shaped molecules in free solution. Anal. Chem. 62:1592–1596. Grunewald, R. A. 1993. Ascorbic acid in the brain. Brain Res. Brain Res. Rev. 18:123–133. Ingebretsen, O. C., O. Terland, and T. Flatmark. 1980. Subcellular distribution of ascorbate in bovine adrenal medulla. Evidence for accumulation in chromaffin granules against a concentration gradient. Biochim. Biophys. Acta. 628:182–189. Jacques, P. F. 1992. Effects of vitamin C on high-density lipoprotein cholesterol and blood pressure. J. Amer. Coll. Nutr. 11:139 –144. Kuhn, R., and S. Hoffstetter-Kuhn. 1993. Capillary Electrophoresis: Principles and Practice. Springer-Verlag, Berlin.
Biophysical Journal 79(1) 370 –376
Dillon et al. McLaughlin, S., and H. Harary. 1974. Phospholipid flip-flop and the distribution of surface charges in excitable membranes. Biophys. J. 14:200 –208. Moore, W. J. 1972. Physical Chemistry. Prentice-Hall, Englewood Cliffs, NJ. 461– 463, 510 –512. Ness, A. R., D. Chee, and P. Elliot. 1997. Vitamin C and blood pressure—an overview. Human Hypertension. 11:343–350. Onsager, L. 1934. Deviations from Ohm’s law in weak electrolytes. J. Chem. Phys. 2:599 – 610. Root-Bernstein, R. S. 1987. Catecholamines bind to enkephalins, morphiceptin, and morphine. Brain Res. Bull. 18:509 –532. Root-Bernstein, R. S., and P. F. Dillon. 1997. Molecular complementarity. I. The complementarity theory of life and its origins. J. Theor. Biol. 188:447– 479. Root-Bernstein, R. S. 1989. Discovering. Harvard, Cambridge MA. 263. Schenk, J. O., M. T. Morocco, and V. A. Ziemba. 1991. Interactions of the argininyl moieties of neurotensin and the catechol protons of dopamine. J. Neurochem. 57:1787–1795. Schreiber, M., and S. Trojan. 1993. Antioxidants in brain and the effect of hypoxia. Sb. Lek. 94:11–17. Szent-Gyo¨rgi, A. 1928. Observation on function of peroxidase systems and chemistry of adrenal cortex; description of new carbohydrate derivative. Biochem. J. 22:1387–1389. Tien, H. T. 1974. Bilayer Lipid Membranes (BLM): Theory and Practice. Marcel Dekker, New York. 134 –142.