M PRA Munich Personal RePEc Archive
Natural resources and institutions: the “natural resources curse” revisited Argentino Pessoa Faculdade de Economia da Universidade do Porto
5. May 2008
Online at http://mpra.ub.uni-muenchen.de/8640/ MPRA Paper No. 8640, posted 8. May 2008 01:20 UTC
Natural resources and institutions: The “natural resources curse” revisited* Argentino Pessoa Faculdade de Economia do Porto Rua Dr. Roberto Frias 4200-464 Porto, Portugal
Email:
[email protected]
Abstract The present paper deals with the role of political authorities and institutions in explaining growth failures. We aim to search answers for three related questions: is there a natural resources curse? Are all types of natural resources exposed to a curse? Can good institutions, measured by a single indicator, avoid this “curse”? Although the estimates presented are supportive of negative relation between growth and relative resources abundance, and of the idea that good institutions enhance growth, our investigation do not demonstrated that if the curse exists it only appears in countries with inferior institutions. So, the key conclusion is that there is no justification for the pessimistic conviction that certain countries will remain caught up in a low growth trap constrained with institutions that impede their growth. At the international level, the main policy implication is that, the support to countries with a high share of natural resources in its exports should be directed towards improving specific areas of control fault, such as public budget and improving organizational systems, rather than imposing on aid-recipient countries wide-ranging global governance measures, that are usually measured by a cross-section general used, but subjective, index.
Keywords: economic growth, institutions, natural resources curse, resource dependence, rent seeking. JEL Codes: O13; O47; Q32; Q33
*
This is a revised version of the paper presented at EAEPE 2007 Conference (Economic growth, development, and institutions - lessons for policy and the need for an evolutionary framework of analysis), November 1-3, 2007, Porto – Portugal.
1
Natural resources and institutions: The “natural resources curse” revisited Introduction Looking at world economic growth, we find high growth countries and low growth countries; countries that have grown rapidly throughout time, and countries that have experienced growth spurts for a decade or two; countries that took off and countries whose growth collapsed (Pessoa, 2004). What is the role of natural resources in these collapses? What is the role of institutions in recovering from such collapses? How can political authorities and institutions help transform this picture? The present paper deals with the role of political authorities and institutions in explaining growth failures aiming to search answers to these questions. Although on the whole, countries that faced growth failures tended to be poor and to be located in certain regions of the world (in particular sub-Saharan Africa and Latin America), we find countries that suffered from growth failures at almost all levels of development, some of them being oil producers with relatively high levels of income. In fact, many fuel- and mineral-rich countries had failed to turn this resources affluence into assets, including human capital, which would have provided a supplementary or alternative long-term source of growth. The growth collapses in many countries that are highly dependent on commodities have given rise to the belief in the “natural resources curse”, according to which countries that are heavily dependent on natural resources are likely to grow more slowly than other countries. Although many explanations have been given to the negative correlation between natural resources abundance and economic per capita growth, the belief in the “curse” is basically supported on the basis of crosssection comparative studies of growth for the 20-year period 1970-1990, relying almost all of them in the data of Sachs and Warner (1995, 1997). Although the natural resources curse has been considered as ‘a reasonably solid fact’ (Sachs and Warner, 2001: 837) and ‘one important finding in development economics’ (Mehlum, et al., 2006), a group of scholars (Davis, 1998; Ahammad and Clements, 1999; Clements and Johnson, 2003) point out that the reported negative outcomes of natural resources abundant economies are case-specific and that even in Sub-Saharan Africa economic performance is mixed, with growth miracles as Botswana
2
and disasters like Zambia. So the poor growth performance of some natural resources based countries should not be generalized1. But the heaviest argument is that if natural resources would be excluded, growth rates of many African countries would be even lower. In fact the international statistics show that in Africa manufacturing almost does not exist and where it exists it is neither knowledge-driven nor it is globally competitive or it performs better than natural resources, and so the positive effects of their linkages are negligible. For the opponents of the “curse”, the problems associated with natural resources dependence are political rather than economic and they can be linked to the capacity of governments and society to respond to large extra rents from natural resources production. In most cases, these revenues are wasted rather than productively invested. Stijns (2001) observes that natural resources affect economic growth through both positive and negative channels and that what matters most in terms of economic development is the way countries deal with their natural resources. He notes that what natural resources do to a country’s productivity and development prospects depends on the learning process involved in exploiting and developing them. In this regard, Stijns concurs with Wright (1990)’s proposition that if natural resources are developed through advanced forms of knowledge development, their positive externalities may be just as powerful as the ones in any other sector, including manufacturing. In addition, in the nineteenth century, resource-rich countries such as the United States and Australia, as well as the Scandinavian countries, had achieved sustained growth and large increases in living standards as a result of their prosperous agricultural, forest and mineral industries (WESS, 2006). As the recent surge in demand for commodities, in particular caused by the economic expansion of India and China, but also by the increasing world demand of bio fuels, could have major benefits for commodity producers, making possible natural resource-rich countries to attain a path of sustainable growth, it is particularly important to find answers for three related questions: is there a natural resources curse? Are all types of natural resources exposed to a curse? Can the curse be avoided by good institutions, which can be measured by a single indicator?
1
Some authors argue that there is no consistent statistical evidence that show that natural resources dependence lead to either faster or slower economic growth and that without evidence of a general law upon which to build, the past successes and failures of the economies specialized in natural resources remain country-specific, with no possible generalization on development patterns (e.g., Davis, 1998).
3
So, given that this paper relates natural resources with institutions, after the introduction we’ll begin with an explanation about the problematic of natural resources curse. Next, we’ll make a cross-sectional test on relating growth of GDP per capita and natural resources abundance. In section 4 we point out some reasons to link institutions to the natural resources curse, we present the Economic Freedom of World (EFW) and we test the effects of EFW on growth controlling simultaneously the natural resources specialization. Section 5 concludes and highlights some policy implications.
2. The “natural resources curse” The idea that natural resources might be more a curse than a good thing started to become known in the 1980's. From then on, the 'resources curse' began refer to the apparent irony that countries with an abundance of natural exhaustible resources have less economic growth than countries without such endowment2. The idea of a curse was enforced by the results of empirical tests, although as was already noted by Stijns (2001), it is the primary export intensity that is tested rather than natural resources per se. There is not yet a theory of the negative effects of the natural resources abundance, but there are a large number of hypotheses that can be raised to account for that negative relationship3. Besides the early social explanation ‘that easy riches lead to sloth’, several other reasons have been advanced for this phenomenon. Firstly, the deterioration in the terms of trade of primary commodities as against manufactures, the famous hypothesis of Prebisch (1950) and Singer (1950) of a secular decline in the terms-of-trade of primary commodities in comparison with manufactures. This view basically predicted that world demand for primary products would grow slower than demand for manufactures or that productivity growth would be faster in manufacturing than in natural resource production, and so ending up by harming the resource-based growth. However, the hypothesis of a deterioration of the terms of trade is nowadays discarded as a cause of the curse (see for example Sachs and Warner, 2001).
2
The term 'resource curse thesis' was first used by Auty (1991) to describe how countries rich in natural resources were not able to use that wealth to boost their economies and how, counter-intuitively, these countries had lower economic growth than countries without an abundance of natural resources. See also Auty (1994; 2001). 3 Another explanation, which we don’t explore in this paper, is that the negative relationship is merely spurious.
4
But the idea that productivity growth has a faster pace in manufacturing than in natural resources has a long story in the development economics. In fact, since the beginning of 1950's and in 1960's, the lack of positive externalities coming from natural resource sectors in comparison with manufacturing has been emphasized. For example, Hirschman (1958), Seers (1964), and Baldwin (1966) promoted the view that helpful ‘forward and backward linkages’ from primary exports to the rest of the economy would be small. The basic idea was that manufacturing, as opposed to natural-resource production, leads to a more complex division of labor and hence to a higher level of development. The Dutch Disease models of the 1970s and 1980s retook this idea. Basically, a natural resources boom cause a move in factors of production from the manufacturing sector towards the booming primary sector in response of the increased rents in the latter4. It is above all because the manufacturing sector is characterized by increasing returns to scale and positive externalities that “Dutch Disease” is so harmful for growth (Sachs and Warner, 1995; Gylfason, 2000, 2001a, 2001b; Rodriguez and Sachs, 1999). But other effects are also highlighted: a decrease of the manufacturing sector further decreases the profitability of investments, accelerating the decrease in investments (Sachs and Warner, 1995, 1999a; Gillis et al, 1996; Gylfason, 2000, 2001a). Additionally, natural resources booms increase domestic income and the demand for goods, generating inflation and an overvaluation of the domestic currency. The relative price of all non-traded goods increase, the terms of trade deteriorate, and exports become expensive relative to world market prices and, consequently, decline. Therefore, when natural resources are abundant, tradable production is concentrated in natural resources rather than manufacturing, and capital and labor that otherwise might be employed in manufacturing are pulled into the non-traded goods sector. As a corollary, when an economy experiences a resource boom (either a termsof-trade improvement, or a resource discovery), the manufacturing sector tends to shrink and the non-traded goods sector tends to expand. It is the shrinkage of the manufacturing sector that is called the “disease,” though there is nothing dangerous about the decline in manufacturing if, competitive conditions prevail in the economy as is usually assumed by neoclassical theory. The 4 The effects of the Dutch Disease include, besides high inflation and currency appreciation, with the consequent rise in input costs, especially wages, the expansion of the non-traded goods and services sector or the shrinking of traded goods sector due to growth-promoting effects of higher incomes and demand or growth-inhibiting effects of rising input costs, respectively, and finally the reallocation of resources (financial and human), from less attractive sectors such as agriculture and manufacturing to the booming minerals sector, with the resulting contraction and loss of competitiveness in those sectors.
5
Dutch Disease can be a real disease, however — and a source of persistent slow growth — if there is something special about the sources of growth in manufacturing, such as the "backward and forward linkages" stressed by Hirschman and others, if such linkages constitute production externalities, or the learning-by-doing stressed by Matsuyama (1992). If manufacturing is characterized by externalities in production then the shrinkage of the manufacturing sector caused by resources abundance can lead to a socially inefficient decline in growth. The economy loses the benefits of the external economies or increasing returns to scale in manufacturing. Another group of explanations emphasizes crowding-out effects. More generally, natural exhaustible resource abundance is taken to pressure some variable or mechanism ‘X’ that obstructs or delays growth (see Sachs and Warner, 2001). Since abundance of natural resource provides a continuous stream of future wealth, it decreases the need for savings and investments. Yet, world prices for primary commodities tend to be more volatile than world prices for other goods. Therefore, an economy based on primary production will easily shift from booms to recessions and this creates uncertainty for investors in natural resource economies (Sachs and Warner 1999b). But the variable ‘X’ may be either the manufacturing sector, or education, or even openness. Natural resource wealth reduces the potential share of manufacturing sector for which human capital is an important factor of production. Sachs and Warner (1995) also argued that natural resources abundance creates a false sense of confidence: ‘easy riches lead to sloth’. An expanding primary sector does not need a high-skilled labor force, and there is no incentive to increase spending on education. The need for high-quality education declines, and so does the returns to education (Gylfason 2001a). This restricts the future expansion of other sectors that require educational quality (Gylfason, 2000, 2001a, 2001b; Sachs and Warner, 1999b) and the technological diffusion in the economy (Nelson and Phelps, 1966). Natural resources abundance reduces the openness of an economy and hurts its terms of trade. Since natural resources weaken the manufacturing sector, policy makers may impose import quotas and tariffs that, in the short run, protect domestic producers (Auty, 1994; Sachs and Warner, 1995). In the long run, such measures harm the openness of the economy and its integration into the global economy. An alternative approach lies in the area of political economy. Among political arguments, the rent-seeking rationale, whereby economic agents pursue short-term 6
objectives to extract monopoly rents, rather than attempt to invest in the long-term future of the industry (Krueger, 1974). Natural resource production typically generates high economic rents. Gelb (1988), in particular, stresses that governments typically earned most of the rents from natural resource exploitation. Therefore innovation tends to be impeded in natural resource-abundant societies. Others argue that natural resource abundance inevitably leads to greater corruption and inefficient bureaucracies; or that high rents distract governments from investing in the ability to produce growth supporting public goods, such as infrastructure or legal codes. Lane and Tornell (1995) argue that a windfall coming from a terms-of-trade improvement or a discovery of natural resource deposits can lead to a fight for the natural resource rents, which has as the result the exhaustion of the source of the rents. In general, as long as rent seeking is a burden, anything that supports rent seeking will lower steady state income and therefore growth along the path to the steady state. The case studies in Gelb (1988) and Auty (1990) lend support to these political channels of influence5. A further line of argument is that resources per se are not a problem. The problem is precisely that they tend to have more volatile world prices. The fact that natural resource prices are more unpredictable than other prices is well established. This probably translates into greater ex-ante uncertainty for primary commodity producers, and also extends through to other sectors in resource-abundant economies. It is also well known that greater uncertainty can reduce factor accumulation through greater risk or because it raises the option value of waiting. Although the magnitude of these volatility effects would be not known with accuracy, it is generally accepted that the volatility of commodity prices makes investment planning difficult and, therefore, discourages investment.
3. Exports of natural resources and economic growth
When analysing the impact of exports of natural resources on economic growth, it is imperative to consider a long-lasting time period. The main reason for this is that by looking at changes over a long time span, short-term effects such as business cycles or 5
A related view is based in argumentation that natural resources provide an easy way of receiving rents (Sachs and Warner, 1995; Gray and Kaufmann, 1998; Ascher, 1999; Leite and Weidmann, 1999, Rodriguez and Sachs, 1999; Gylfason, 2001a; Torvik, 2002) and highlight the fact that natural resource rents stimulate economic agents to corrupt the administration in order to gain access.
7
shocks that disproportionately affect particular economies will be minimized. The near three decade period utilized here allows an examination of the longer-run relationships between natural resources and GDP per capita growth rate. Although the generality of empirical studies about resources curse talk in resources abundance they only test the external specialization of countries, because they use as proxy for assessing the abundance/scarcity of natural resources the share of primary exports in GDP (Sachs and Warner, 2001; Mehlum, 2006). In this paper we follow a slightly different route: we use exports of natural resources in percent of total merchandise exports (Xprim/X) as a proxy of the resources abundance. The reason for our preference is based in the fact that the share of exports in GDP is, in some extent, endogenous to the economic growth process. In a first approach, we depict in Figure 1 the relationship between the specialization in natural resources, measured by primary exports as a percent of total exports in 1980, and the growth rate of GDP per capita in the 1980-2004 period, for a cross-section of 119 countries. Figure 1. Exports of natural resources and per capita growth y = -0.0247x + 2.8394 R 2 = 0.1836 8
Growth rate, 1980-2004
6 4 2 0 0
20
40
60
80
100
120
140
-2 -4 -6 Primary exports, 1980
Source: built with data from WDI indicators
Results depicted in figure 1, and the ones of table 1 for a sample of 119 countries show the negative relationship between primary exports and growth. In fact, among the 22 countries that have experienced a negative growth rate of GDP per capita in the 19802004 period, only one (Haiti) show a share of natural resources exports in total merchandise exports of less than 50 per cent. On the other hand, among 17 countries
8
with a rate of growth higher than 3 per cent there are 9 with a share above 50 per cent. But the results also show that the adjustment of the trend line is far from perfect with a large variability in rates of growth of the countries where primary goods are the almost exclusive source of exports. If, as Mauro (1998) argues, natural resources are associated with the emergence of politically powerful interest groups that attempt to influence politicians prone to corruption in order to adopt policies that are against the general public interest, such rent-seeking is probably easier in certain types of commodities than in others. So, the next step was to disaggregate the natural resources in 4 different categories: agricultural raw materials, food, fuels, and ores and metals. Column (2) of table 1 shows estimates for the regression of shares of exports of those 4 types of goods, at 1980, on growth rate of GDP per capita on the period 1980-2004. It is worth noting that for every category of exports the coefficient is negative and statistically significant.
Table 1. Regression of economic growth on natural resources abundance, 1980-2004. Dependent variable: Average annual growth rate of GDP per capita, 1980–2004
Intercept Xprim/X
(1) 2.839* (8.078) -0.0247* (-5.130)
Fuels
---
Food
---
Agricultural raw materials
---
Ores and metals
---
Log GDP
---
(2) 2.795* (7.983) ---0.0273* (-4.779) -0.0180* (-3.096) -0.0263** (-2.080) -0.0380* (-4.407) ---
(3) 2.904* (8.042) -0.0248* (-4.968)
(4) 4.8672* (3.157) -0.0288* (-4.941)
---
---
---
---
---
---
---
---
---
R2
-0.496 (-1.309) 0.188 13.28 107
0.177 0.198 0.183 F Test 26.32 8.262 24.69 N 119 119 107 Source: Data from World Bank (2007). Notes: t-statistics in parentheses; *Significant at 1 % level; **Significant at 5 % level.
(5) 4.865* (2.844) ---0.029* (-4.526 -0.026* (-3.516) -0.030** (-2.025) -0.039* (-3.972) -0.496 (-1.193) 0.181 5.700 107
But why should the share of primary exports in total merchandise exports be negatively related with the rate of growth? One reason is rationalized in Barro (1991) as a result of conditional convergence. So, it makes sense to introduce in the equation of regression the log of GDP per capita of the initial period. The inclusion of this variable implies the
9
decrease of the dimension of the sample from 119 to 107 countries. However, the inclusion doesn’t show log of GDP per capita as a statistically significant variable (regressions 4 and 5, table 1).
4. The consideration of institutions Following the theoretical work of North (1981) on why institutions are important, a large empirical literature has documented the huge differences in institutions across countries, and has shown that these can explain a large part of cross-country differences in output per capita. Among the empirical studies that have been done in the last years about the influence of institutions on growth and development, we find, for instance, the ones of Mauro (1995), Acemoglu et al. (2001, 2002), Easterly and Levine (2003), Rodrik et al. (2004), and Mehlum et al. (2006). All of them find a positive relation between good institutions and development. Furthermore, part of the literature on the natural resources curse relies in the role of institutions as the critical factor. For instance, in the Mehlum et al. (2006)’ study ‘Countries rich in natural resources constitute both growth losers and growth winners’ (p. 16); the final result depends on the quality of institutions6. However, in the empirical literature the term institutions encompass a wide range of indicators, including: a) institutional quality (the enforcement of property rights); b) political instability (riots, coups, civil wars); c) distinctiveness of political regimes (elections, constitutions, executive powers); d) social characteristics (differences in income and in ethnic, religious, and historical background); and e) social capital (the extent of civic activity and organizations). Economists often rely on one or several of these types of indicators to capture the features of institutions, although each one has a potentially different channel of impact on growth. However, the largest part of studies on institutional empirical approach relies on the importance of creating an institutional environment that is generally supportive of markets (e.g., protection of property rights, enforcement of contracts, and voluntary exchange at market-determined prices). Although some researchers have assumed institutions as an exogenous influence on the economy (for example, Gwartney et al., 2006), a lot of researchers have expressed concern that institutions are actually endogenous, reflecting various historical 6
These results contrast the claims of Sachs and Warner (1995, 2001) that institutions are not decisive for the resource curse.
10
or cultural influences. The econometric studies that try to deal with the endogeneity problem rely typically in the use of instrumental variable techniques. However, while the instrumental variable approach has the advantage of minimizing the endogeneity problem, the proxy usually used for that endeavor is of small usefulness for helping policy makers in its efforts for changing institutions in the present time period7. So, in our view, we need a measure of institutions that summarizes the various aspects of institutions in the recent time in a way that minimizes the statistical problem of endogeneity.
a) The EFW In this paper we’ll use the Economic Freedom of the World (EFW) index constructed by Gwartney and Lawson (2003), as a measure of institutional quality8. The EFW is a comprehensive measure that includes 38 components, which are in the origin of ratings, in a zero-to-ten scale, for five main areas: (1) size of government, (2) legal structure and security of property rights, (3) access to sound money, (4) exchange with foreigners and (5) regulation of economic activity. So, the EFW index, as a summary index, is intended to measure the degree to which a country’s institutions and policies support voluntary exchange, the protection of property rights, open markets, and minimal regulation of economic activity. A country achieves a high EFW score when it does some things and abstains from doing others. In the former case, it deserves mention the protection of the property rights, the enforcement of contracts, and the removing of barriers to access sound money. On the other hand, governments must abstain from actions that inhibit voluntary trade, or limit entry into markets. Therefore, lower EFW ratings result when government spending is large, state-owned enterprises and regulations are widespread, tariffs and quotas are high, and exchange rate, interest rate, and other forms of price controls are widely imposed.
7
For instance, Acemoglu et al. (2001) use mortality rates of colonial settlers in colonized areas, Hall and Jones (1999) use the fraction of the population speaking English and Western European languages, as an instrument for institutional quality. Acemoglu et al. find that better institutions as measured by their language proxy result in higher levels of per capita income. 8 The EFW annual report is published by a network of institutes in 59 different countries. See Berggren (2003) for a review of articles that have used the EFW data in the analysis of cross-country differences in income levels, growth rates, and related topics.
11
The attributes of the EFW index make it particularly useful as an indicator of institutional quality in our empirical tests. It summarizes many factors that economists have historically argued would facilitate economic activity and enhance growth and so it can save the effort of testing a great number of other proxies of institutions. On the other hand, because it is available at five year intervals over a period that begins in 1970 make possible to examine not only the impact of the level of institutional quality but also the effects of changes in that quality of several decades. We will focus on the 1980–2004 period. The inclusion of EFW (as level and as rate of variation) makes a new reduction in the sample dimension mandatory. But, as we may see in table 2, it allows us to show that controlling for institutions in 1980 increases not only the explanatory power of the regression but it also provides statistically significant estimates. So, table 2 shows some evidence for the fact that institutions (both level and variation) have a positive effect on the per capita growth rate. Additionally, the inclusion of level and rate of change of EFW makes Log GDP statistically significant (regression 3). Table 2 Regression of economic growth on natural resources abundance, considering institutions, 1980-2004. Dependent variable: Average annual growth rate of GDP per capita, 1980–2004 (1)
(2)
(3)
(4)
(5)
(6)
(7)
4.565* (2.677) -0.0295* (-4.530)
3.970** (2.296) -0.0272* (-4.100)
1.425 (0.718) -0.0216* (-3.159)
2.836* (7.173
4.435** (2.412)
3.973** (2.140)
1.345 (0.667)
---
---
---
---
Agricultural raw materials
---
---
---
Food
---
---
---
Ores and metals
---
---
---
Fuels
---
---
---
-0.0093 (-0.583) -0.0268* (-3.613) -0.0325* (-3.389) -0.0255* (-3.9416)
-0.420 (-1.012)
-0.723 (-1.560) 0.285 (1.612)
-0.0156 (-0.896) -0.0305* (-3.585) -0.0366* (-3.436) -0.0280* (-3.972) -0.3936 (-0.890)
-0.0187 (-1.071) -0.0272* (-3.106) -0.0348* (-3.258) -0.0260* (-3.657) -0.693 (-1.423)
-0.0147 (-0.875) -0.0234* (-2.745) -0.0341* (-3.323) -0.017** (-2.225) -1.492* (-2.723) 1.026* (3.154) 1.036* (2.796) 0.258 5.325 88
Intercept Xprim/X
-1.288* --(-2.585) 0.910* EFW 1980 --------(2.924) 0.840* 0.263 EFW growth --------(2.409) (1.426) 0.198 0.213 0.255 0.188 0.186 0.196 R2 F test 11.722 8.828 8.450 6.022 4.964 4.528 N 88 88 88 88 88 88 Source: Data from World Bank (2007) and EFW (2006). Notes: t-statistics in parentheses; *Significant at 1 % level; **Significant at 5 % level. Log GDP per capita
12
In the recent literature, there are two distinguished approaches to assess the importance of institutions and political authorities as determinants of growth and development: (i) new comparative economics, where the rights of the individual in law (including property rights), anti-corruption measures and other governance-related factors are considered to be the main causes, with the significance of these main causes often being estimated by cross-country analyses; and (ii) the diversity of authority systems approach, which recognizes differences in institutions over time and across space and examines how economic agents respond in different contexts to the specific set of rules and regulations governing markets. In this paper we have followed until now the first approach. The results obtained allow us to say that institutions and political authority matter for the growth of a country subject to the symptoms of natural resources curse. But, although the results don’t allow us to set aside the idea that the quality of institutions is crucial to surpass situations generally subject to natural resources curse, it is also noteworthy that this approach is insufficient to say what are the appropriate channels for surpassing the external specialization in natural resources.
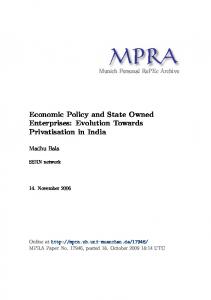
b) Can good institutions prevent the curse? Mehlum et al. (2006) argue that the resource curse only appears in countries with inferior institutions (p.3). Perhaps this is so for the 1965-1990 period, but the piece of evidence they use is not bulletproof. To show this a simple test can be made. We plot in Figures 2, 3, and 4 the average yearly economic growth from 1980 to 2004 vs. natural resources abundance measured as share in total merchandise exports splitting our sample of 88 countries in three sub samples built in accordance with the value of EFW for 1980. So, figure 2 is based on data for 21 countries with EFW below 4.5; figure 3 includes 34 countries with EFW between 4.5 and 5.5 and figure 4 clusters the other 33 countries with EFW above 5.5.
13
Figure 2. The “curse” in countries with inferior institutions y = -0.0287x + 2.5262
EFW80