Alexey Sorokin (Russian Federation), Isabel. Sousa Pinto ...... 2017. 2021. 2025. 2016. 2020. 2024. 2018. 2022. ETHANOL PRODUCTION. [MILL. L] ...... Cunningham, S. A., & Klein, A. M. (2009). ...... (2014). Europe. In V. R. Barros, C. B. Field,.
CHAPTER 1
CHAPTER 2. NATURE’S CONTRIBUTIONS TO PEOPLE AND QUALITY OF LIFE
2
CHAPTER 2
CHAPTER 2
Esra Başak Dessane (Turkey), Pam Berry (United Kingdom of Great Britain and Northern Ireland), Claire Chenu (France), Mike Christie (United Kingdom of Great Britain and Northern Ireland), Magali Gerino (France), Hans Keune (Belgium), Elisa OterosRozas (Spain), Sandrine Paillard (France), Axel G. Rossberg (United Kingdom of Great Britain and Northern Ireland/Germany), Matthias Schröter (Germany), Alexander P. E. van Oudenhoven (The Netherlands)
Review Editors:
Fellow:
Francis Turkelboom (Belgium), Mimi Urbanc (Slovenia)
Elena Osipova (Russian Federation)
This chapter should be cited as:
Contributing Authors: Armağan Aloe Karabulut (Turkey), Başak Avcıoğlu Çokçalışkan (Turkey), Adem Bilgin (Turkey), Tom Breeze (United Kingdom of Great Britain and Northern Ireland), Elena Bukvareva (Russia), Pierre Duez (Belgium), Daniel P. Faith (Australia), Ilse Geijzendorffer (The Netherlands/France), Arjan Gosal (United Kingdom of Great Britain and Northern Ireland), L. Jamila Haider (Austria/ Sweden), Conor Kretsch (United Kingdom of Great Britain and Northern Ireland), Jorge Lozano (Spain/Germany), Patrick Meire (Belgium), Jasmin Mena Sauterel (Germany),
CHAPTER 4
Lead Authors:
Markus Meyer (Germany), Marcos Moleón (Spain), Zebensui Morales-Reyes (Spain), Bram Oosterbroek (The Netherlands), Simon G. Potts (United Kingdom of Great Britain and Northern Ireland), Vitalija Povilaityte-Petri (Lithuania/Belgium), Adriana Ruiz Almeida (Spain), José A. Sánchez-Zapata (Spain), Stefanie Sievers-Glotzbach (Germany), Ewa Siwicka (Poland/United Kingdom of Great Britain and Northern Ireland), Alexey Sorokin (Russian Federation), Isabel Sousa Pinto (Portugal), Erik Stange (Norway), Pawel Szymonczk (Poland/United Kingdom of Great Britain and Northern Ireland), Marija Vugdelic (Montenegro)
CHAPTER 5
Berta Martín-López (Spain/Germany), Andrew Church (United Kingdom of Great Britain and Northern Ireland)
Martín-López, B., Church, A., Başak Dessane, E., Berry, P., Chenu, C., Christie, M., Gerino, M., Keune, H., Osipova, E., Oteros-Rozas, E., Paillard, S., Rossberg, A. G., Schröter, M. and van Oudenhoven, A. P. E. Chapter 2: Nature’s contributions to people and quality of life. In IPBES (2018): The IPBES regional assessment report on biodiversity and ecosystem services for Europe and Central Asia. Rounsevell, M., Fischer, M., Torre-Marin Rando, A. and Mader, A. (eds.). Secretariat of the Intergovernmental Science-Policy Platform on Biodiversity and Ecosystem Services, Bonn, Germany, pp. 57-185.
CHAPTER 6
Coordinating Lead Authors:
CHAPTER 3
NATURE’S CONTRIBUTIONS TO PEOPLE AND QUALITY OF LIFE
57
THE REGIONAL ASSESSMENT REPORT ON BIODIVERSITY AND ECOSYSTEM SERVICES FOR EUROPE AND CENTRAL ASIA
TABLE OF CONTENTS EXECUTIVE SUMMARY. . . . . . . . . . . . . . . . . . . . . . . . . . . . . . . . . . . . . . . . . . . . . . . . . . . . . . . . . . 60 FOREWORD TO CHAPTER 2 . . . . . . . . . . . . . . . . . . . . . . . . . . . . . . . . . . . . . . . . . . . . . . . . . . . . . 64 2.1 INTRODUCTION . . . . . . . . . . . . . . . . . . . . . . . . . . . . . . . . . . . . . . . . . . . . . . . . . . . . . . . . . . . 65 2.1.1 How this Chapter 2 relates to the IPBES conceptual framework . . . . . . . . . . . . . . 65 2.1.2 Contextual dimensions of nature’s contributions to people within the IPBES Regional Assessment for Europe and Central Asia . . . . . . . . . . . . . . . . . 65 2.2 STATUS AND TRENDS OF NATURE’S CONTRIBUTIONS TO PEOPLE IN EUROPE AND CENTRAL ASIA . . . . . . . . . . . . . . . . . . . . . . . . . . . . . . . . . . . . . . . . . . . . 68 2.2.1 Status and trends of nature’s regulating contributions to people . . . . . . . . . . . . . . 69 2.2.1.1 Habitat creation and maintenance . . . . . . . . . . . . . . . . . . . . . . . . . . . . . . 69 2.2.1.1.1 Nurseries . . . . . . . . . . . . . . . . . . . . . . . . . . . . . . . . . . . . . . . . 69 2.2.1.1.2 Breeding and overwintering areas for migratory species . . . . . 71 2.2.1.2 Pollination . . . . . . . . . . . . . . . . . . . . . . . . . . . . . . . . . . . . . . . . . . . . . . . . 71 2.2.1.3 Regulation of air quality . . . . . . . . . . . . . . . . . . . . . . . . . . . . . . . . . . . . . . 73 2.2.1.4 Regulation of climate . . . . . . . . . . . . . . . . . . . . . . . . . . . . . . . . . . . . . . . . 75 2.2.1.5 Regulation of ocean acidification . . . . . . . . . . . . . . . . . . . . . . . . . . . . . . . 79 2.2.1.6 Regulation of freshwater quantity and flow . . . . . . . . . . . . . . . . . . . . . . . . 79 2.2.1.7 Regulation of freshwater and coastal water quality . . . . . . . . . . . . . . . . . . 81 2.2.1.8 Formation and protection of soils . . . . . . . . . . . . . . . . . . . . . . . . . . . . . . . 82 2.2.1.8.1 Soil functioning: soil quality . . . . . . . . . . . . . . . . . . . . . . . . . . . 82 2.2.1.8.2 Erosion control . . . . . . . . . . . . . . . . . . . . . . . . . . . . . . . . . . . 84 2.2.1.9 Regulation of natural hazards and extreme events . . . . . . . . . . . . . . . . . . 88 2.2.1.10 Regulation of detrimental processes: removal of animal carcasses . . . . . . 89 2.2.2 Status and trends of nature’s material contributions to people . . . . . . . . . . . . . . . . 92 2.2.2.1 Food and feed . . . . . . . . . . . . . . . . . . . . . . . . . . . . . . . . . . . . . . . . . . . . . 92 2.2.2.1.1 Food and feed from terrestrial ecosystems . . . . . . . . . . . . . . 92 2.2.2.1.2 Wild capture and cultured aquatic food production . . . . . . . . 98 2.2.2.2 Energy . . . . . . . . . . . . . . . . . . . . . . . . . . . . . . . . . . . . . . . . . . . . . . . . . . 100 2.2.2.2.1 Woodfuel . . . . . . . . . . . . . . . . . . . . . . . . . . . . . . . . . . . . . . . 100 2.2.2.2.2 Provision of biofuels . . . . . . . . . . . . . . . . . . . . . . . . . . . . . . . 103 2.2.2.3 Materials and assistance . . . . . . . . . . . . . . . . . . . . . . . . . . . . . . . . . . . . 103 2.2.2.3.1 Provision of wood . . . . . . . . . . . . . . . . . . . . . . . . . . . . . . . . . 105 2.2.2.3.2 Cotton and other vegetal materials . . . . . . . . . . . . . . . . . . . . 105 2.2.2.3.3 Materials from marine ecosystems . . . . . . . . . . . . . . . . . . . . 106 2.2.2.3.4 Assistance of livestock protection and guard dogs . . . . . . . . 106 2.2.2.4 Provision of medicinal resources. . . . . . . . . . . . . . . . . . . . . . . . . . . . . . . 107 2.2.3 Status and trends of nature’s non-material contributions to people . . . . . . . . . . . 109 2.2.3.1 Learning and knowledge generation . . . . . . . . . . . . . . . . . . . . . . . . . . . . 109 2.2.3.1.1 Formal learning and knowledge generation . . . . . . . . . . . . . . 109 2.2.3.1.2 Indigenous and local knowledge . . . . . . . . . . . . . . . . . . . . . . 110 2.2.3.2 Physical and psychological experiences . . . . . . . . . . . . . . . . . . . . . . . . . 112 2.2.3.2.1 Recreational experiences . . . . . . . . . . . . . . . . . . . . . . . . . . . 112 2.2.3.2.2 Aesthetic experiences . . . . . . . . . . . . . . . . . . . . . . . . . . . . . . 115 2.2.3.3 Supporting identities . . . . . . . . . . . . . . . . . . . . . . . . . . . . . . . . . . . . . . . 115 2.2.3.3.1 Protected areas . . . . . . . . . . . . . . . . . . . . . . . . . . . . . . . . . . 115 2.2.3.3.2 Emblematic, symbolic or iconic species or ecosystems . . . . 116 2.2.3.3.3 Attitudes towards nature . . . . . . . . . . . . . . . . . . . . . . . . . . . . 117 2.2.3.3.4 Spiritual experiences . . . . . . . . . . . . . . . . . . . . . . . . . . . . . . . 117 2.2.3.4 Maintenance of options . . . . . . . . . . . . . . . . . . . . . . . . . . . . . . . . . . . . . 117
58
CHAPTER 2. NATURE’S CONTRIBUTIONS TO PEOPLE AND QUALITY OF LIFE
2.2.4 Interregional flows of nature’s contributions to people: dependency of Europe and Central Asia on ecosystems of other regions . . . . . . . . . . . . . . . . . . . 2.2.4.1 Introduction: interregional flows of nature’s contributions to people . . . . 2.2.4.2 Ecological footprint. . . . . . . . . . . . . . . . . . . . . . . . . . . . . . . . . . . . . . . . . 2.2.4.3 Status and trends of interregional flows for selected nature’s contributions to people. . . . . . . . . . . . . . . . . . . . . . . . . . . . . . . . . . . . . . 2.2.5 Summary of trends of nature’s contributions to people . . . . . . . . . . . . . . . . . . . . 2.2.6 Future trends in nature’s contributions to people. . . . . . . . . . . . . . . . . . . . . . . . . . 2.2.6.1 Regulating contributions . . . . . . . . . . . . . . . . . . . . . . . . . . . . . . . . . . . . 2.2.6.2 Material contributions from nature to people . . . . . . . . . . . . . . . . . . . . . . 2.2.6.3 Nature’s non-material contributions to people . . . . . . . . . . . . . . . . . . . .
119 119 120 120 123 125 125 126 128
2.3 EFFECTS OF TRENDS IN NATURE’S CONTRIBUTIONS ON QUALITY OF LIFE IN EUROPE AND CENTRAL ASIA . . . . . . . . . . . . . . . . . . . . . . . . . . . . . . . . . . . .129 2.3.1 Contributions to food-energy-water security . . . . . . . . . . . . . . . . . . . . . . . . . . . . 129 2.3.1.1 Food security . . . . . . . . . . . . . . . . . . . . . . . . . . . . . . . . . . . . . . . . . . . . . 129 2.3.1.2 Energy security . . . . . . . . . . . . . . . . . . . . . . . . . . . . . . . . . . . . . . . . . . . 131 2.3.1.3 Water security . . . . . . . . . . . . . . . . . . . . . . . . . . . . . . . . . . . . . . . . . . . . 134 2.3.1.4 Food-energy-water security nexus . . . . . . . . . . . . . . . . . . . . . . . . . . . . 137 2.3.2 Contributions to physical, mental and social dimensions of health . . . . . . . . . . . . 139 2.3.3 Cultural heritage, identity and stewardship . . . . . . . . . . . . . . . . . . . . . . . . . . . . . . 140 2.3.3.1 Value through use . . . . . . . . . . . . . . . . . . . . . . . . . . . . . . . . . . . . . . . . . 140 2.3.3.2 Value through protection and beyond use . . . . . . . . . . . . . . . . . . . . . . . 142 2.3.4 Environmental equity and justice. . . . . . . . . . . . . . . . . . . . . . . . . . . . . . . . . . . . . . 144 2.3.4.1 Framing equity and justice . . . . . . . . . . . . . . . . . . . . . . . . . . . . . . . . . . . 144 2.3.4.2 Intra-generational distributive equity and justice . . . . . . . . . . . . . . . . . . . 144 2.3.4.3 Intergenerational distributive equity and justice . . . . . . . . . . . . . . . . . . . . 145 2.3.4.4 Procedural equity and justice . . . . . . . . . . . . . . . . . . . . . . . . . . . . . . . . . 146 2.3.5 Valuing nature’s contributions to people . . . . . . . . . . . . . . . . . . . . . . . . . . . . . . . . 146 2.3.5.1 Market-based monetary values . . . . . . . . . . . . . . . . . . . . . . . . . . . . . . . 147 2.3.5.2 Non-market monetary values . . . . . . . . . . . . . . . . . . . . . . . . . . . . . . . . . 147 2.3.5.3 Non-monetary values . . . . . . . . . . . . . . . . . . . . . . . . . . . . . . . . . . . . . . 148 2.3.5.4 Integrating values into policy. . . . . . . . . . . . . . . . . . . . . . . . . . . . . . . . . . 148 2.4 RELEVANCE TO AICHI BIODIVERSITY TARGETS AND SUSTAINABLE DEVELOPMENT GOALS . . . . . . . . . . . . . . . . . . . . . . . . . . . . . . . . . . . . . . . . . . . . . . . . . . .151 2.5 KNOWLEDGE GAPS . . . . . . . . . . . . . . . . . . . . . . . . . . . . . . . . . . . . . . . . . . . . . . . . . . . . . . .153 2.5.1 The unevenness of knowledge of nature’s contributions to people in Europe and Central Asia . . . . . . . . . . . . . . . . . . . . . . . . . . . . . . . . . . . . . . . . . . . . 153 2.5.2 The challenges of knowledge generation on nature’s contributions to people . . . . 155 REFERENCES . . . . . . . . . . . . . . . . . . . . . . . . . . . . . . . . . . . . . . . . . . . . . . . . . . . . . . . . . . . . . . . . .155
59
THE REGIONAL ASSESSMENT REPORT ON BIODIVERSITY AND ECOSYSTEM SERVICES FOR EUROPE AND CENTRAL ASIA
CHAPTER 2
NATURE’S CONTRIBUTIONS TO PEOPLE AND QUALITY OF LIFE EXECUTIVE SUMMARY Nature’s contributions to people in Europe and Central Asia have changed markedly since the 1950s, promoting changes in the quality of life of its societies (well established). The ecosystems of Europe and Central Asia are currently delivering multiple contributions, although there is evidence of negative trends between 1960 and 2016 in the majority of regulating and some non-material contributions (well established) (2.2.1, 2.2.3, 2.2.5). Of nature’s contributions to people in Europe and Central Asia, about 44% have been assessed as declining, particularly regulating contributions and learning derived from indigenous and local knowledge (well established) (2.2.1, 2.2.3, 2.2.5). The increasing trends in the delivery of specific material contributions, such as food and biomass-based fuels, have come at the expense of the long-term deterioration of regulating contributions (well established) (2.2.1, 2.2.2, 2.2.5). Some key regulating contributions, such as habitat maintenance, pollination, regulation of freshwater quantity, regulation of freshwater quality, formation and protection of soils, and regulation of floods decreased due to intensified management practices designed to produce more crops, livestock, aquaculture, woodfuels and cotton. Furthermore, the increasing demand in Western and Central Europe for food, wood products and biofuels is causing the impairment of ecosystems and nature’s contributions to people in other regions of the world (established but incomplete) (2.2.2.3, 2.2.4, 2.3.4). Trends of nature’s contributions to people are consistent across the subregions of Europe and Central Asia. Declining trends are reported in Central Europe (61% of the scientific evidence), Western Europe (55%), Eastern Europe (54%) and Central Asia (48%). Increasing trends are mostly reported for Western Europe (35% of scientific evidence) (established but incomplete) (2.2.5). Across all subregions of Europe and Central Asia, continuing declines in nature’s capacity to provide regulating contributions to people since the 1960s are of particular concern, especially in the cases of nursery habitats of fish species and breeding and overwintering areas for migratory species, pollination, freshwater flow regulation, freshwater quality regulation, regulation of floods, soil quality and
60
erosion control (well established) (2.2.1). However, since the 1990s an improvement in some of these and other regulating contributions from nature to people (i.e. air quality regulation and removal of animal carcasses) in Western and Central Europe occurred due to the implementation of European Union policies (established but incomplete) (2.2.1). Since the 1960s, the impacts of land-use change on natural ecosystems and inappropriate management practices in agriculture and fisheries have caused declines in pollinators (2.2.1.2), in regulation of freshwater quality (2.2.1.7), in erosion control and soil quality (2.2.1.8) and in fluvial flood regulation (2.2.1.9) in the four subregions (well established). The increases in forest area since the 1960s across parts of Europe and Central Asia have increased carbon storage in those areas, contributing to climate regulation. Increased urban green infrastructure improved the regulation of air temperature in cities and air quality regulation (2.2.1.3, 2.2.1.4). The declines of seagrass beds and kelp forests due to global warming, fishing pressure and marine pollution in the Atlantic, Baltic and Mediterranean Seas have negative consequences for the provision of nursery habitats for fish (2.2.1.1) and regulation of ocean acidification (2.2.1.5) (established but incomplete). Nevertheless, these marine habitats may increase in the Arctic Ocean led by seawater warming and will possibly enhance the regulation of ocean pH in the future (2.2.1.5) (established but incomplete). After the sharp declines of vultures since the 1950s, the recent recovery of vertebrate scavengers mainly due to natural recovery of populations and also the reintroduction and conservation programmes in Western Europe, has enhanced the removal of animal carcasses (2.2.1.5) (established but incomplete). Nature’s material contributions to people in Europe and Central Asia are highly diverse, including food, energy supply, materials that enter industrial processes, and medicinal resources (well established) (2.2.2.1). There are inherent trade-offs amongst those material contributions derived from different forms of land use and management. Trends in the use of material contributions reflect socio-economic change and market forces, but also limits to natural capacity (2.2.2.1) (established but incomplete). Intensification of management practices, technology, and investment have led to higher production levels for particular material contributions with high market value, including food and
CHAPTER 2. NATURE’S CONTRIBUTIONS TO PEOPLE AND QUALITY OF LIFE
biofuels (2.2.2, 2.3.5). The production of some products has experienced substantial growth in the region, particularly in Eastern Europe and Central Asia, including maize, cereals, fruits and vegetables, and meat (well established) (2.2.2.1.1). Capture of marine wild fish in the region reached a peak in the 1990s and since then has reduced by about 30% to permit recovery of stocks (established but incomplete) (2.2.2.1.2). This reduction was compensated for by a rapid expansion of aquaculture (well established) (2.2.2.1.2). Intensive extraction of food and materials combined with policy failures has driven the decline of natural resources, particularly of wild fish and maerl (2.2.2.1.2, 2.2.2.3.3). Also, the loss of indigenous and local knowledge has affected the use of medicinal plants and guard dogs for protecting livestock (2.2.2.3.4, 2.2.2.4). As a result of management for sustainable use, wood production in Europe and Central Asia has been stable since the 2000s and currently about 23% of this production is used as woodfuel (2.2.2.2). Production of biofuel and biodiesel remains small relative to woodfuel and the potential for expansion is limited due to impacts on ecosystems (established but incomplete) (2.2.2.2). Nature’s non-material contributions to people in Europe and Central Asia have implications for quality of life by providing opportunities for learning, inspiration, identity development, and physical and psychological experiences (well established) (2.2.3). Different measures for these contributions show contrasting trends and geographical unevenness across Europe and Central Asia (well established) (2.2.3). There are contrasting trends in measures for learning and inspiration. Informal learning based on interactions with nature has expanded partly due to increases in recreation and tourism linked to sustainable environmental management that promotes knowledge of nature (well established) (2.2.3.1.1). Other forms of informal learning and knowledge are in decline and can be linked to a loss of indigenous and local knowledge and linguistic diversity which is the basis of different forms of indigenous and local knowledge relating to nature. Across Europe and Central Asia, 12% of all languages are categorized as critically endangered and 14% as vulnerable (well established) (2.2.3.1.2). The overall evidence for physical and psychological experiences indicates an increasing trend. The demand for nature-based recreation and leisure has grown in Western Europe and in 2015 31% of European Union adults surveyed indicated that nature is their main reason for going on holiday, up from under 10% in 2008 (well established) (2.2.3.2, 2.3.3). Thirtyeight per cent of the European Union is characterized by a high outdoor recreation potential, but the places that can be used for nature-based recreational and aesthetic experiences in Western Europe are becoming fewer due to land use changes including urbanization, landuse intensification, rural abandonment, disappearance
of common lands and water pollution (well established) (2.2.3.2). The support of identities relates to virtues and principles rather than to enjoyment resulting from physical and psychological experiences, but it is not possible to identify clear trends for this contribution from nature (well established) (2.2.3.3). Nevertheless, it is reflected in attitudes towards nature and, in the European Union, 76% of people agreed with the statement that “we have a responsibility to look after nature” (well established) (2.2.3.2). In support of their identities, people attribute an existence value to species and ecosystems, especially iconic and emblematic species (well established) (2.2.3.3). Species found in European and Central Asian forests, such as moose; and in marine waters, such as whales, are particularly highly valued (established but incomplete) (2.2.3.3). The maintenance of options is a contribution that depends on the existence of biodiversity, and its status and trends are reflected by those of biodiversity measures, including phylogenetic diversity. Society’s appreciation of maintenance of options is only moderate, as indicated by previous assessments of Europe and Central Asia, and by the recent call for greater appreciation of maintenance of options from conservation NGOs (established but incomplete) (2.2.3.4). Europe and Central Asia is currently food secure despite a decline in pollination; degradation of agricultural soils; decreases in water availability; increases in floods and droughts; decreases in wild fish catch; competition from agriculture with other land uses such as forests and urbanization; and loss of supporting farmer identity and food-related indigenous and local knowledge (well established) (2.3.1.1, 2.2.1.2, 2.2.1.5, 2.2.1.7, 2.2.1.8, 2.2.2.1, 2.2.3.1). This has been possible because of the mechanization and intensification of agriculture and because the region depends partly on imports of food and agricultural inputs as well as on large-scale land acquisition abroad (established but incomplete) (2.3.1.1). Food availability depends on different contributions from nature, particularly food production, protection of soils, regulation of water quantity and pollination. Food production from agriculture in Europe and Central Asia increased by 56% between the 1960s and the 1990s until the dissolution of the Soviet Union, the Yugoslav wars and the MacSharry reform of the European Union Common Agricultural Policy. Because of efforts to reduce surplus production in Western Europe between the 1960s and the 1990s, agricultural production has declined by 33% since the 1990s (well established) (2.2.2.1.1). This has been offset by an increase in imports from outside of Europe and Central Asia, primarily from South America and Africa (2.2.2.1.2, 2.2.4) and by large-scale acquisition of land in other regions of the world (0.63% of croplands worldwide, 0.57% acquired by countries from Western Europe) (2.3.1.1). There has also been a decrease in wild fish catches since the 1990s,
61
THE REGIONAL ASSESSMENT REPORT ON BIODIVERSITY AND ECOSYSTEM SERVICES FOR EUROPE AND CENTRAL ASIA
partly due to more sustainable management practices. This decrease was compensated by an increase of 2.7% in fish production from aquaculture since 2000 (established but incomplete) (2.2.2.1.2). Food quantity and quality depend upon soil quality, regulation of water flows and floods, pollination and food-related indigenous and local knowledge. Erosion of agricultural soil affects about 25% of agricultural land in Europe and Central Asia, and a decline of organic matter in agricultural soils has triggered decreased productivity in Central Asia (established but incomplete) (2.2.1.8). However, between 2000 and 2010, erosion control in the EU-27 increased by an average of 9.5%, and by 20% for arable lands, partly due to agricultural practices promoted by the Common Agricultural Policy (2.2.1.8). Since 1980, frequency and severity of floods have increased across Europe and Central Asia due to heavy precipitation events and decreased capacity to regulate fluvial floods (established but incomplete) (2.2.1.9), thus impacting crop productivity. Since 1961, Mediterranean and Central Asian countries have become more pollinator dependent due to their substantial production of highly pollinator-dependent fruits (established but incomplete) (2.2.1.2). However, the diversity, occurrence and abundance of wild insect pollinators have declined since the 1950s and severe losses of western honey bee populations have occurred in many Western European countries and former-USSR countries since 1961 (established but incomplete) (2.2.1.2). The loss of indigenous and local knowledge related to farming can affect food security by undermining intergenerational knowledge exchange within farming communities and contributing to the depopulation of rural areas (established but incomplete) (2.2.3.1.2, 2.2.3.2.1, 2.3.1.1). Nature contributes in a range of ways to safe drinking water that is currently ensured for 95% of the people in Europe and Central Asia, despite a 15% decrease in water availability per capita since 1990 (well established) (2.3.1.3). Access to clean water depends strongly on the regulation of both water quality and water quantity. These two regulating contributions have been impaired by pollution and overexploitation of freshwater bodies and the decrease in the areal extent of floodplains and wetlands (well established) (2.2.1.6, 2.2.1.7). However, the rate of decrease in water quality has lessened in the last decade in Western Europe, due to the implementation of the Water Framework Directive (established but incomplete) (2.3.1.3, 2.2.1.7). Access to drinking water is currently sufficient in Western and Central Europe (>99% of people), while Eastern Europe (95%) and Central Asia (85%) have had lower, but increasing, access to drinking water since 1995 (well established) (2.3.1.3). Water extraction as a percentage of renewable water resources decreased from 30 to 15% between 1993 and 2012 (well established)
62
(2.3.1.3). However, overall water availability per capita has decreased by 15% since 1990, while this decrease was 42% since 1960 in Western Europe (well established) (2.2.1.5). Water scarcity in most countries of the European Union has decreased slightly since the 1990s, but overexploitation still threatens freshwater resources (established but incomplete) (2.3.1.3). The Mediterranean region is facing scarcity of water (established but incomplete) (2.3.1.3). Access to sufficient quantities of clean water also depends on water quality and water flow regulation (well established) (2.2.1.6, 2.2.1.7). Water quality regulation has decreased in the region since the 1950s, due to the declining naturalness of freshwater ecosystems and areal extent of wetlands (well established) (2.2.1.7). Between 2009 and 2015, the coverage of water bodies in the European Union with a “good ecological status” decreased from 43% to 32% (2.2.1.7). However, water quality in Western Europe has improved during the last decade due to the implementation of the Nitrates and Water Framework Directives (well established) (2.2.1.7). In Central and Eastern Europe, water quality is decreasing (well established) due to increased water pollution and the conversion of natural ecosystems (2.2.1.7). Water flow regulation shows mixed, but generally decreasing trends for the region, particularly in Western and Central Europe between 2000 and 2011 (established but incomplete) (2.2.1.6). Some areas of research into linkages between nature and health have illustrated the value of biodiversity and most of nature’s contributions to people for human health (well established) (2.3.2). These linkages include the contribution of biodiversity and nature’s contributions to people to contemporary and traditional medicine, and to healthy nutrition through dietary diversity and support for food security (well established) (2.2.2.4, 2.3.2, 2.3.2). Dietary diversity, however, is not necessarily a good indicator of healthy nutrition: a relatively high diversity of unhealthy diets in Western Europe through increases in fat and protein supply can contribute to increases in obesity rates (well established) (2.3.1.1). Other linkages between nature and health include the influence of biodiversity and nature’s contributions to people on infectious disease risk (unresolved) (2.3.2.2), and the value of green spaces in promoting mental health and physical fitness (established but incomplete) (2.3.2.1). There has been a decline in indigenous and local medical knowledge across Europe and Central Asia (well established) (2.2.2.4), but medicinal plants have been increasingly used in complementary and alternative medicine outside of local and indigenous communities in recent decades (established but incomplete). Unsustainable patterns of exploitation threaten the survival of some medicinal plants (established but incomplete) (2.2.2.4).
CHAPTER 2. NATURE’S CONTRIBUTIONS TO PEOPLE AND QUALITY OF LIFE
Urban dwellers across Europe and Central Asia value green spaces for health, psychological well-being and emotional attachment (well established) (2.2.3.2). Increased urbanization poses significant challenges for human health – including a rise in non-communicable diseases associated with modern lifestyles, such as obesity, cardiovascular diseases, depression and anxiety disorders, and diabetes (2.3.2). Efforts to increase access of urban dwellers to green space and open countryside may help address some of these health issues through beneficial physical and psychological experiences (established but incomplete), though more research is needed into differentials between communities and social groups in terms of access to greenspace and the health benefits obtained from them (unresolved) (2.3.2). The value of nature’s contributions to cultural heritage, identity and stewardship is indicated through people’s engagement with nature for leisure and tourism, spiritual and aesthetic experiences, gathering of wild food, learning, developing indigenous and local knowledge and also by the desire of people, social groups and governments to protect and conserve areas and iconic species even when they do not use them (well established) (2.2.3). There has been a loss in knowledge of ecosystems and species linked to a marked general decline in indigenous and local knowledge and linguistic diversity (well established) (2.2.3.1.2). Protected areas, as indicators of valued and iconic places, have grown in number and extent so that globally the proportion of the Earth’s surface protected has risen from 8% in 1990 to 14.7% in 2016 (well established) (2.2.3.2). The designation of protected areas, however, is geographically uneven in Europe and Central Asia with relatively few areas in Central Asia (2.2.3.3, 2.3.4) (well established). Protected areas and other green spaces have increasingly been used since 1950 for tourism, leisure, formal and informal learning with outdoor learning often providing additional value for skill and knowledge development for teachers and learners (well established) (2.2.3.1, 2.3.3). In some countries interactions between material and non-material contributions to cultural practices enhance identity, such as berry and mushroom picking (well established) (2.3.3). Shepherds attach considerable identity value to guard dogs, especially to breeds associated with particular geographical areas (well established) (2.2.2.3.4). The belief systems of many peoples are strongly influenced by spiritual and religious interactions and ecosystems are viewed as alive in many indigenous and local knowledge systems in Europe and Central Asia (well established) (2.3.3). The decline in linguistic diversity weakens indigenous peoples’ stewardship, heritage and identity especially among young members of these communities as it results in a loss of knowledge of ecosystems and species (well established) (2.2.3.1.2, 2.3.3.). Indigenous and local knowledge has significant value for some local communities
in Europe and Central Asia contributing to land rights claims, fisheries management and economic development linked to visitors consuming local products and experiencing lifestyles linked to indigenous and local knowledge (established but incomplete) (2.3.3). Nature in Europe and Central Asia is important for delivering a wide range of contributions, which are valued by people. These values are expressed in multiple dimensions, including through economic markets, willingness to pay or cultural preferences (well established) (2.3.5). Integrated valuation approaches demonstrate that nature’s contributions have substantial monetary and non-monetary values that can inform policy goals (well established) (2.3.5). Regulating and non-material contributions are as important in terms of value as material contributions (established but incomplete) (2.3.5.2, 2.3.5.3). Traditionally, nature’s material contributions have been valued based on market prices and in this assessment monetary values are standardized to a common currency and base year (International $ 2017). Mean net profits of nature’s material contributions to people from agricultural production across EU-28 countries ranged from $233 / ha / yr (cereals) to $916 / ha / yr (mixed crops), while wood supply from forests was $255 / ha / yr (established but incomplete) (2.3.5.1). Evidence from Europe and Central Asia demonstrates that nature’s regulating contributions to people also have significant non-market monetary values and these are higher than non-market values for material and non-material contributions (established but incomplete) (2.3.5.2, 2.3.5.3). For example, habitat creation and maintenance is estimated to have a median value of (2017) International $ 765 / ha / yr (unresolved) and regulation of freshwater and coastal water quality is estimated at (2017) International $ 1965 / ha / yr (established but incomplete) (2.3.5.2). Nature’s non-material contributions to people, such as physical and psychological experiences have a median value of (2017) International $ 1117 / ha / yr (unresolved), while other non-material contributions were demonstrated to be the most valued contributions by people in social-cultural valuations (established but incomplete) (2.3.5.2, 2.3.5.3). The (often large) ranges in values of nature’s contributions reflect heterogeneity of preferences across regions, social groups, local contexts and methodological differences (established but incomplete) (2.3.5.2, 2.3.5.3). This assessment has demonstrated the importance of nature’s contributions to people in terms of their market, non-market monetary and socio-cultural values. Hence, there is strong evidence to support the inclusion of the plurality of values in policy goals such as the Aichi Biodiversity Targets and Sustainable Development Goals (2.3.5.4). Nature’s contributions to quality of life of societies in Europe and Central Asia are not equally experienced
63
THE REGIONAL ASSESSMENT REPORT ON BIODIVERSITY AND ECOSYSTEM SERVICES FOR EUROPE AND CENTRAL ASIA
across different locations and social groups across the region, resulting in distributional inequity (established but incomplete) (2.3.4). The benefits derived from nature’s contributions and the harm from a loss of nature’s contributions are geographically uneven, which creates distributional inequity as the impacts on quality of life of changes in ecosystems are linked to where beneficiaries live (established but incomplete) (2.3.4). There is also a time component as ecosystem service utilization today may destroy the basis for future service provision (established but incomplete) (2.2.3.4). 15% of people in Central Asia lack access to safe drinking water compared to only 1% in Western Europe (well established) (2.3.1.3, 2.3.4.2). However, intra-regional equity in the access to food and a balanced diet is increasing (well established) (2.3.1.1). Equal access to food can be threatened by large scale land-acquisition mainly by organizations from both Western European and outside the region in Central and Eastern Europe and Central Asia as it compromises the right of people in these areas to control their own food systems (established but incomplete) (2.3.1.1). In the European Union, access to green spaces is not equally distributed among the inhabitants of cities (established but incomplete) (2.2.3.2, 2.3.4.2). Public access to forests for recreational experiences is uneven across the countries of Europe and Central Asia with high levels of access to 98-100% of forest and other wooded land in Nordic and some Baltic countries as well as in several Central Europe countries including Bosnia and Herzegovina, Slovenia and Serbia. Lower levels of access are found in some Western Europe countries such as UK (46%) and France (25%) (well established) (2.3.4.2). Europe and Central Asia uses more renewable natural resources than are produced within the region, either through overuse or net import, as indicated by the negative difference (deficit) between biocapacity (production) and ecological footprint (consumption) (well established) (2.2.4). The region depends on net flow imports of renewable natural resources and material contributions from nature (well established) (2.2.4). Western and Central Europe and Central Asia have a biocapacity deficit while Eastern Europe has a reserve (well established) (2.2.4). Western Europe’s ecological footprint is 5.1 global hectares per person, while its biocapacity is 2.2 hectares. Central Europe’s footprint is 3.6 hectares (2.1 ha biocapacity); Eastern Europe’s is 4.8 hectares (5.3 ha biocapacity) and Central Asia’s is 3.4 hectares (1.7 hectares biocapacity) (well established) (2.2.4). The regions footprint negatively affects biodiversity, food security and other contributions from nature to people in other parts of the world (established but incomplete) (2.2.4, 2.3.4). Human appropriation of net primary productivity (HANPP) is a measure that assesses biomass extraction from ecosystems for food, fodder, fibres and bioenergy and for large parts of Western Europe, HANPP is lower than HANPP embodied in consumption indicating a reliance
64
on regions outside of Western Europe (well established) (2.2.4). HANPP for Central and Eastern Europe and Central Asia is similar or slightly higher than HANPP embodied in consumption, but the European Union has been increasingly importing embodied HANPP especially from South America (well established) (2.2.4). There are significant differences in interregional flows of nature’s contributions to people across subregions: Central and Western Europe import more contributions than Eastern Europe and Central Asia (well established) (2.2.4). Food availability in Central and Western Europe relies significantly on land for crop production in Brazil, Argentina, China and the United States of America (well established) (2.2.4). Central and Western Europe depends on food and feed imports equivalent to the annual harvest of 35 million hectares of cropland (2008 data), a land area the size of Germany. Western Europe became less self-sufficient in crop production between 1987 and 2008, while the rest of Europe and Central Asia has become more self-sufficient (well established) (2.2.4).
FOREWORD TO CHAPTER 2 “This is like home, you can’t tell it. It has to be felt. This is the single sentence you can say. You don’t have to add anything else. In springtime when you go out and smell the fresh air, it cannot be told, the feeling of how wonderful it is.” (Sandor Barta, cattle herder, in Kis et al., 2017). In this chapter, we provide an assessment of each of nature’s contributions to people (NCP) and to the quality of life of societies in Europe and Central Asia. We recognize that these contributions are diverse, reflecting the multiple societies that inhabit the region and the multiple interlinked dimensions of nature and society. For that reason, the present chapter seeks to respect and to represent the multiple values of nature’s contributions to people and to include the different knowledge systems that provide understanding of our relationship with nature.
CHAPTER 2. NATURE’S CONTRIBUTIONS TO PEOPLE AND QUALITY OF LIFE
2.1 INTRODUCTION 2.1.1 How this Chapter 2 relates to the IPBES conceptual framework This chapter addresses the boxes of the IPBES conceptual framework “nature’s contributions to people” (NCP) and “good quality of life” and the interactions between them. Therefore, it assesses the status, trends and future dynamics of nature’s material, regulating and non-material contributions to people (IPBES, 2017a). We use the term “ecosystem services” when referring to the literature that uses this term, and “nature’s contributions to people” when synthesizing, summarizing and assessing information. This chapter also assesses the implications of changes in nature’s contributions to people for the quality of life of people in terms of instrumental and relational values (see Section 1.5.2), including food, energy and water security, health, cultural heritage, identity and stewardship, and equity (Figure 2.1). The chapter also examines the multiple values of nature’s contributions to people by presenting an integrated valuation, including monetary and non-
Figure 2
1
monetary valuation. Assessing the link between nature’s contributions to people and quality of life requires diverse valuation methods that include market-based and nonmarket monetary methods as well as socio-cultural valuation methods (Jacobs et al., 2017; Pascual et al., 2017). In this chapter, we provide an assessment of nature’s contributions to people and their relationships with values and quality of life in Europe and Central Asia, bringing together scientific, technical and indigenous and local knowledge (ILK) systems.
2.1.2 Contextual dimensions of nature’s contributions to people within the IPBES Regional Assessment for Europe and Central Asia In this assessment, three generic social and ecological dimensions of nature’s contributions to people are distinguished –capacity, use and value-, and different indicators assigned to them. The aim was not a systematic assessment of indicators for all dimensions, but rather to provide an overview of indicators of nature’s contributions
Representation of the focus of Chapter 2: status and trends of nature’s contributions to people (NCP) (Section 2.2) and their quality of life (Section 2.3) in terms of multiple values. The grading of green and brown colours indicates whether the different contributions (regulating, material and nonmaterial) are more associated with natural or with cultural systems, respectively, and to highlight that values are intertwined with both systems. NATURE’S CONTRIBUTIONS TO PEOPLE
QUALITY OF LIFE
Habitat maintenance Learning and inspiration
Pollination
Food, energy and water security
INSTRUMENTAL
Food and feed Regulation of air quality Regulation of climate Regulation of ocean acidification Regulation of freshwater quantity Regulation of freshwater quality
Energy
Materials and assistance
Physical and psychological experiences
Supporting identities
Physical, mental and emotional health
Cultural heritage, identity and stewardship
Formation of soils Regulation of hazards
Medicinal resources Maintenance of options
Regulation of organisms detrimental to humans REGULATING
MATERIAL
NON-MATERIAL
Environmental justice and equity
RELATIONAL
65
THE REGIONAL ASSESSMENT REPORT ON BIODIVERSITY AND ECOSYSTEM SERVICES FOR EUROPE AND CENTRAL ASIA
to people that relate to one of these dimensions. Table 2.1 gives an overview of which particular dimension of nature’s contributions to people is assessed in this chapter for each contribution. The first dimension is ecosystem service capacity - the potential of a system to make a particular contribution to people. The second dimension is ecosystem service use - the
Table 2
1
actual appropriation or appreciation of nature’s contributions to people by a beneficiary. The third dimension is ecosystem service value - the importance attached to contributions by different groups of beneficiaries. While nature’s contributions to people can be valued in different ways (Jacobs et al., 2017; Pascual et al., 2017), the presence of such values determines to which elements in nature, e.g. a species, a population or an ecosystem, they are attributed.
Indication of which dimension is assessed in this chapter per contributions from nature to people.
Nature’s contributions to people
Ecosystem service capacity
Ecosystem service use
Ecosystem service value
1
Habitat creation and maintenance
• Nursery capacity of habitats • Surface of habitats with nursery function
• Breeding and overwintering areas for migratory species
• Non-market monetary values • Non-monetary values
2
Pollination
• Wild insect pollinators diversity and occurrence • IUCN red lists status for wild pollinators • Number of honey bee colonies
• Agriculture’s dependence on pollinators • % supply of honey bees relative to demand
• Annual market value of production that is directly linked with pollination services • Non-market monetary values • Non-monetary values
3
Regulation of air quality
• Reduction in concentration of the pollutant by nature • Balance between emissions and vegetation capture • NO2 and other pollutants removed by ecosystems
• Reduction in concentration of the pollutant • Premature deaths due to air pollution • Years of life lost due to air pollution
• Non-market monetary values • Non-monetary values
4
Regulation of climate
• Carbon storage and sequestration by different land uses • Temperature decrease (reduced heat stress)
• CO2 (and greenhouse gas) concentrations
• Non-market monetary values • Non-monetary values
5
Regulation of ocean acidification
• Marine vegetated habitats (e.g. seagrasses, kelp forests) surface and performance • Rates of pelagic primary production
• Increases in ocean pH • Existence of refugia for calcifying organisms
6
Regulation of freshwater quantity and flow
• • • • • •
• Freshwater extraction • Surface water extraction • Freshwater use
• Non-market monetary values • Non-monetary values
7
Regulation of freshwater quality
• Surface of floodplains and wetlands • Ecological status of water bodies • Nitrate removal rate in a river
• Concentration of nitrogen and phosphorous in inland freshwater ecosystems • Quality of drinking water and bathing water • Winter means of dissolved inorganic nitrogen (nitrate + nitrite + ammonium), oxidized nitrogen (nitrate + nitrite) and phosphate concentrations in seas
• Non-market monetary value • Non-monetary values
8
Formation and protection of soils
• Capacity of ecosystems to avoid erosion: C factor of USLE erosion model • Soil fertility • Maintenance of soil structure • Soil organic carbon content • Available nutrients, available organic contaminants
• Erosion rates
• Non-market monetary value • Non-monetary values
66
Freshwater quantity regulation Freshwater availability (for human use) Freshwater flow regulation Water retention Water regulation Stream flow, base flow
CHAPTER 2. NATURE’S CONTRIBUTIONS TO PEOPLE AND QUALITY OF LIFE
Nature’s contributions to people
Ecosystem service capacity
Ecosystem service use
Ecosystem service value
9
Regulation of hazards and extreme events
• Habitats designated for flood protection • Flood mitigation capacity of wetlands • Flood regulation
• Number and intensity of coastal and fluvial flood events • Damage caused by flood events
• Non-market monetary value • Non-monetary values
10
Removal of carcasses
• IUCN red lists status for vertebrate scavengers • Population trends of vertebrate scavengers
• Amount of animal and livestock carcasses removed by vertebrate scavengers • Emissions of CO2 resulted by the substitution of natural scavenging with artificial removal of carcasses
• Avoided costs • Non-market monetary value
11
Food and feed
• Agriculture area per capita • Cultivated area per agricultural population • Organic agricultural area
• Production of cereals, fruit, vegetables, maize • Production of crops processed: olive oil, rapeseed oil, sunflower oil, wine • Livestock primary production: eggs, meat, milk • Marine wild capture seafood • Inland wild fish captures • Aquaculture production
• Market values • Non-market monetary value • Non-monetary values
12
Energy
• Woodfuel production stocks • Annual production of biofuel • Biodiesel and ethanol production • Woodfuel consumption stocks • Trade balance of biofuels • Trade balance of biodiesel and ethanol
• Market value of woodfuel • Non-market monetary value • Non-monetary values
13
Materials and assistance
• Density of timber stocks • Surface of cork oak forests • Status of mearl bed habitats
• • • •
Production of roundwood Production of cotton Cork harvested Production of turpentine, resin and rosins • Production of kelp • Extraction of maerl
• Market value of some materials • Non-market monetary value • Non-monetary values
14
Medicinal, biochemical and genetic resources
• Number of medicinal plants • Endangered status of medicinal plants
• Use of medicinal plants
• Non-market monetary value of genetic resources • Non-monetary values
15
Learning and inspiration
• Protected areas and outdoor spaces used for learning
• Linguistic Diversity Index • Level of endangerment of languages • Transmission of indigenous and local knowledge
• Non-market monetary value • Non-monetary values
16
Physical and psychological experiences
• Surface of Protected Areas • Recreational potential index • Percentage of forest area designated or managed for recreation purposes • Richness of species collected for wild food or hunted
• Nature as the main reason for going on holidays • Number of marine and freshwater anglers • Participant rates (%) in naturebased recreation activities
• • • •
Market value of mushrooms Market value of berries Non-market monetary value Non-monetary values
67
THE REGIONAL ASSESSMENT REPORT ON BIODIVERSITY AND ECOSYSTEM SERVICES FOR EUROPE AND CENTRAL ASIA
Nature’s contributions to people
Ecosystem service capacity
Ecosystem service use
Ecosystem service value
17
Supporting Identities
• Protected Areas (IUCN categories Ia Strict Nature Reserve, Ib Wilderness Area, II National Park and IV Habitat/species management area) • Sacred Natural Sites per country • Forest area primarily designated or managed for spiritual or cultural values (Food and Agriculture Organization of the United Nations)
• Species appearance in news articles • Attitudes towards nature preservation
• Non-market monetary value • Non-monetary values
18
Maintenance of options
• Total number of endemic species • Phylogenetic diversity
• Use of genetic diversity by pharmaceutical companies • Recent and unanticipated benefits from biodiversity
• Avoided costs of unanticipated benefits from biodiversity
2.2 STATUS AND TRENDS OF NATURE’S CONTRIBUTIONS TO PEOPLE IN EUROPE AND CENTRAL ASIA This section assesses the status (from 2011 to 2016) and trends (from 1950) of nature’s contributions to people in Europe and Central Asia based on a systematic literature review conducted in three main stages: (i) generation of search strings (see supporting material Appendix 2.11); (ii) systematic search of primarily published peer-reviewed scientific articles, grey literature and indigenous and local 1. Available at https://www.ipbes.net/sites/default/files/eca_ch_2_ appendix_2.1_protocol_of_the_systematic_review_used_for_ chapter_2_of_the_eca_assessment.pdf
knowledge; and (iii) the extraction of information from 25 relevant papers per contribution in each subregion of Europe and Central Asia. The assessment also included indicators available at regional and subregional levels and indigenous and local knowledge derived from a Europe and Central Asia “ILK dialogue workshop” held in January 2016 in Paris (Roué & Molnar, 2017) (see supporting material Appendix 2.22). We report on the general status and trends in Europe and Central Asia and in its subregions of Western, Central and Eastern Europe, and Central Asia; however, a detailed list of references can be found in supporting material Appendix 2.33. It is important to point out that, across the region, there are many examples where indigenous and local knowledge is 2. Available at https://www.ipbes.net/sites/default/files/eca_ch_2_ appendix_2.2_ilk_content_of_ncp.pdf 3. Available at https://www.ipbes.net/sites/default/files/eca_ch_2_ appendix_2.3_extra-references.pdf
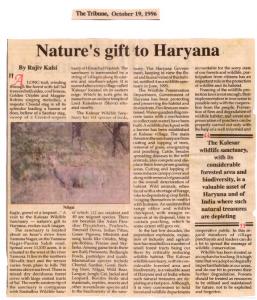
1 The role of indigenous and local knowledge of transhumance shepherds for preserving some of nature’s contributions to people.
Box 2
Transhumance is a traditional farming practice of moving livestock from one grazing ground to another in a seasonal cycle. It is based on indigenous and local knowledge that has proven to be a determinant for the provision of nature’s regulating contributions to people (seed dispersal, fire prevention or soil fertility), as well as nature’s material and nonmaterial contributions to people, such food, wood, ecotourism or local identity (Oteros-Rozas et al., 2013a; Oteros-Rozas et al., 2014). The use, conservation and transmission of transhumance-related local knowledge has been shown to be mostly linked with the practice of transhumance on foot. Transhumance on foot would not be possible without ancestral knowledge and collaborative practices. Drove roads, maintained for and by transhumant shepherds through the migration of their herds, are biodiversity reservoirs (Azcarate et al., 2013) as well as corridors contributing to landscape
68
connectivity (Galvin, 2008). Seeds can be dispersed along hundreds of kilometres by transhumant sheep on their migration (Manzano & Malo, 2006). In Spanish “dehesas” (open woodlands resulting from the clearing of original evergreen oak woodland and shrubland areas), shepherds’ seasonal management of grasslands allows for holm oak regeneration in a context where tree ageing is a major challenge for biodiversity conservation and overall sustainability (Carmona et al., 2013). Fire prevention, as a result of livestock consumption of flammable biomass has also been tightly linked with transhumance management (Oteros-Rozas et al., 2013a; Zumbrunnen et al., 2012). The customary practice of “redileo” and the enclosure of animals in changing resting areas along the drove roads, contribute to soil fertility (OterosRozas et al., 2012).
CHAPTER 2. NATURE’S CONTRIBUTIONS TO PEOPLE AND QUALITY OF LIFE
essential for preserving nature’s contributions to people, for example in the case of transhumance shepherds (see Box 2.1). Other examples of the relevance of indigenous and local knowledge to the maintenance of nature’s contributions to people, such as pollination, habitat maintenance, food and feed, medicinal resources and physical and psychological experiences are those derived from the management of cultural landscapes, such as “dehesas”, “montados” or “bocages” (Box 2.1).
2.2.1 Status and trends of nature’s regulating contributions to people 2.2.1.1 Habitat creation and maintenance 2.2.1.1.1 Nurseries Habitat as a nursery for juveniles of a particular species refers to where “its contribution per unit area to the production of individuals that recruit to adult populations is greater, on average, than production from other habitats in which juveniles occur” (Beck et al., 2001). An overview of the nursery function as a contribution from nature to people is provided by Liquete et al. (2016a) who conclude that it is a concrete benefit to people, especially through food provision or recreation. For example, a positive effect has been demonstrated between the presence of nursery habitat and fish stocks of sole (Solea solea) in the Seine estuary in France (Cordier et al., 2011). The importance of conserving nursery areas has also been demonstrated for commercially important invertebrate species, such as queen scallops (Aequipecten opercularis), soft-shell clam
Table 2
2
(Mya arenaria) and sea urchin (Psammechinus miliaris). The importance of nursery habitat for juveniles is also relevant in the cases of maerl grounds, kelp forests, Cystoseira forests, seagrass meadows and reefs, among others. Maerl beds harbour significantly higher numbers of juveniles of these species than impacted areas (Kamenos et al., 2004). However, maerl beds have been undergoing a decline in condition and extent across most of their range in European Union (Hall-Spencer et al., 2008; JNCC, 2007; OSPAR, 2010), mainly due to commercial extraction (see Section 2.2.2.3), as well as negative impacts of mussel farming, dredging for scallops and bivalves, aquaculture and eutrophication (Grall & Hall-Spencer, 2003; Hall-Spencer & Bamber, 2007; Hall-Spencer et al., 2008; JNCC, 2007). In the European Union marine environment, kelp forests also provide important habitat for a wide range of species (Araújo et al., 2016; Smale et al., 2013), including commercially important ones such as European lobster (Homarus gammarus). They also act as nurseries for invertebrates and fish, such as Atlantic cod (Gadus morhua), as well as key mating and feeding grounds for many North Atlantic fish species, such as Ballan Wrasse (Labrus bergylta) and Goldsinny Wrasse (Ctenolabrus rupestris) (Bertocci et al., 2015; Casal et al., 2011; Smale et al., 2013). While knowledge gaps exist in terms of demonstrating the actual effect of kelp forest abundance and density on associated fisheries, most studies show a positive kelp-fisheries relationship (Bertocci et al., 2015). Recent studies show a dominant decreasing trend in kelp forest distribution and abundance across parts of Western, Central and Eastern Europe due to global warming, sea urchin grazing, harvesting, pollution and fishing pressure (see Figure 2.2)
Kelp species in UK and Irish waters and their predicted change in abundance or range of each species in response to continued environmental change. Source: Smale et al. (2013).
Species
Distribution
Depth range (m)
Length (m)
Lifespan (years)
Predicted change
Laminaria hyperborea
Arctic-Portugal
0-30
1-3
5-18
Decrease
Laminaria digitata
Arctic-France
0-15
1-2
4-6
Decrease
Laminaria ochroleuca
UK-Morocco
0-30
1-3
5-18
Increase
Saccharina latissima
Arctic-France
0-30
1-3
2-4
Decrease
Alaria esculenta
Arctic-France
0-35
1-2
4-7
Decrease
Saccorhiza polyschides*
Norway-Morocco
0-35
2-3
1
Increase
Undaria pinnatifida
Global NIS
0-15
1-3
1
Increase
* S. polyschides is not a true kelp of the order Laminariales (being of the order Tilopteridales), but is included as this “pseudokelp” can perform a similar ecological role as the dominant canopy former.
69
THE REGIONAL ASSESSMENT REPORT ON BIODIVERSITY AND ECOSYSTEM SERVICES FOR EUROPE AND CENTRAL ASIA
(Araújo et al., 2016; Casal et al., 2011). Distribution and abundance of some kelp species is predicted to further change in response to ocean warming in the Atlantic (see Table 2.2) (Smale et al., 2013) (see Section 2.2.1.5). Cystoseira brown algae also provide biogenic structure, food and shelter for many organisms including fish. These habitats have, however, been declining or disappearing throughout the Mediterranean Sea due to a decrease in water quality and building development on the coast (Cheminée et al., 2013; Mangialajo et al., 2013). In Corsica, the depletion of large and continuous forests of C. balearica with a surface area of more than 2,500 m2 could result in a significant loss of Wrasse (Symphodus spp.) juveniles, which are dependent on this habitat (Cheminée et al., 2013). Also in the Mediterranean Sea, many commercial fish species rely on seagrass beds which provide permanent habitat, allowing full life cycle completion and providing temporary nurseries for juvenile development, feeding areas for various life cycle stages and refuge from predation (Jackson et al., 2001). Eelgrass (Zostera marina) meadows play a similar role in the Baltic and North Atlantic (Boström et al., 2014). Seagrasses have declined worldwide and particularly in the Mediterranean, Baltic and Atlantic Seas,
Figure 2
2
with negative consequences for the provision of nursery habitats (Boström et al., 2014; Mccloskey & Unsworth, 2015; Waycott et al., 2009). Biogenic reefs, i.e. reefs where structure is created by the animals themselves, are also important fish habitats, as their complex structures provide refuge for fish and substrate for benthic fauna and macroalgal forests which, in turn, provide refuge and feeding areas for fish species (Støttrup et al., 2014). A positive relationship between reef habitats and fish species abundance was demonstrated by a study on reef restoration in Denmark on the example of commercially important species cod and saithe (Støttrup et al., 2014). Many biogenic reef habitats on the European coasts of the Atlantic Ocean and the North Sea have been in decline due to various anthropogenic pressures (OSPAR, 2010). Other nursery and spawning habitats have also been reported in national assessments. For example, in Finland the most important nursery habitats include bladderwrack (Fucus vesiculosus) and common eelgrass (Zostera marina) meadows for fish species, wooded mires for many forest grouse species and spawning rivers for salmon (Boström et al., 2014; Jäppinen & Heliölä, 2015). The state of Atlantic salmon (Salmo salar) spawning rivers in the Baltic Sea has
Kelp abundance in parts of Western, Central and Eastern Europe. Source: TNC (n.d.).
KELP ABUNDANCE BY PROVINCE
4 — ABUNDANT
70
3 — WIDESPREAD
2 — COMMON
1 — PRESENT
0 — NONE
NO DATA
CHAPTER 2. NATURE’S CONTRIBUTIONS TO PEOPLE AND QUALITY OF LIFE
also been assessed by the Helsinki Commission, showing that the number of salmon spawners had increased since the mid-1990s in some rivers of the Bothnian Bay (ICES, 2013).
Pollinator diversity contributes to crop pollination even when managed species are abundant, and a diverse community of pollinators generally provides more effective and stable crop pollination than any single species.
2.2.1.1.2 Breeding and overwintering areas for migratory species A number of scientific publications discuss population declines in a range of migratory species, including migratory birds of Western, Central and Eastern Europe (Berthold et al., 1998; Sanderson et al., 2006). This includes European breeding birds wintering in Sub-Saharan Africa (Sanderson et al., 2006). Over half (50.4%) of fully migratory species were reported to be in decline between 1990 and 2000, falling, however, to 35.7% between 2000 and 2012 (Gilroy et al., 2016). Despite this decline in wintering populations, overall waterbirds show an increasing trend in the European Union, being higher for those listed on Annex I of the Birds Directive (Figure 2.3) (Wetlands International, 2015).
2.2.1.2 Pollination Pollination by animals plays a vital role as a regulating contribution from nature to people with the majority of wild flowering plant species (Ollerton et al., 2011) and crop types (Klein et al., 2007) benefitting from it, at least in part. Both wild and managed pollinators play significant roles in crop pollination, and crop yield or quality depend on both the abundance and diversity of pollinators (IPBES, 2016).
Figure 2
3
Pollinators provide a wide range of material contributions, such as the food, fibre, building materials, medicines and other products derived from pollinator-dependent plants (see Section 2.2.2). Other products are directly produced by some species of bees such as honey, pollen, wax, propolis, resin, royal jelly and bee venom (IPBES, 2016). These are important for nutrition, health, medicine, cosmetics, religion and cultural identity and so contribute to a good quality of life (IPBES, 2016). Since the 1950s wild insect pollinators in Europe and Central Asia have declined in diversity and occurrence, and also in abundance for some taxa where data are available (see Chapter 3). IUCN Red Lists for continental Europe (here extending from Iceland in the west to the Urals in the east) show that 37% of bee and 31% of butterfly species have declining populations (excluding data deficient species) and 9% of both taxa are classified as threatened (Nieto et al., 2014; Van Swaay et al., 2010). Severe losses of managed colonies of the western honey bee have been reported in many Western European countries and former-USSR countries since 1961 (Aizen & Harder, 2009). Agriculture in Europe and Central Asia has become more pollinator dependent since 1961, with Mediterranean and Central Asian countries being the most reliant on pollination
Trends in wintering populations of 50 waterbird species in the European Union according to their status on the Birds Directive. Source: Wetlands International (2015).
1.6
1.4
1.2
1
0.8
0.6
0.4
0.2
ALL (50 species)
ANNEX I (10 species)
ANNEX II (29 species)
2012
2011
2010
2009
2008
2007
2006
2005
2004
2003
2002
2001
2000
1999
1998
1997
1996
1995
1994
1993
1992
1991
1990
0
NOT LISTED (14 species)
71
THE REGIONAL ASSESSMENT REPORT ON BIODIVERSITY AND ECOSYSTEM SERVICES FOR EUROPE AND CENTRAL ASIA
Figure 2
Agriculture’s dependence on pollinators (i.e., the percentage of expected agriculture production volume loss in the absence of animal pollination (categories depicted in the coloured bar) in 1961 A and 2012 B . Source: Based on data from FAO (2013a) and following the methodology of Aizen et al. (2009).
4
A
B
PERCENTAGE OF EXPECTED AGRICULTURE LOSS IN THE ABSENCE OF ANIMAL POLLINATION
No data
Figure 2
0
5
2.5
5
7.5
10.0
12.5
15.0
25.0 %
A comparison of the pollination service capacity of honey bees in 2005 A and 2010 B in Western Europe (except Israel), Central Europe and parts of Eastern Europe. Source: Breeze et al. (2014).
A
B
% SUPPLY OF HONEYBEES RELATIVE TO DEMAND
> 90%
75 — 90%
50 — 75%
25 — 50%
services for crop production, due to the substantial production of highly pollinator-dependent fruits (see Figure 2.4). The potential capacity of managed honey bees in Western, Central and Eastern Europe to supply pollination services to pollinator-dependent crops is insufficient to meet demand in many countries and the shortfall has increased between 2005 and 2010 because of changes in crop markets (see Figure 2.5; Breeze et al., 2014). This suggests a high and increasing reliance on wild insects for crop pollination services. Without a systematic monitoring scheme, however, it is not possible to accurately assess the importance of wild pollinators at a local scale (e.g. April et al., 2016). Although some attempts have been made to model available pollinator natural capital (e.g. Schulp et al., 2014a), to date they have not considered pollinator behaviour. More suitable models have been developed
72
< 25%
NOT AVAILABLE
(Olsson et al., 2015; Ricketts & Lonsdorf, 2013) but have not yet been applied beyond case study or hypothetical sites. In addition, a variety of indicators have been used for mapping pollination, however, almost all are based on very indirect (e.g. land cover variables) or relative measures of pollination and lack empirical validation of reliable representation of pollination delivery. Pollination contributes to a good quality of life through: the role of pollinators underpinning the productivity of many of the world’s crops which contribute to healthy diets; beekeeping, pollinator-dependent plant products and honey which support livelihoods; and pollinator-dependent landscapes which help provide a rich and meaningful cultural and spiritual life (IPBES, 2016). Throughout Europe and Central Asia there has been a 14% increase in honey
CHAPTER 2. NATURE’S CONTRIBUTIONS TO PEOPLE AND QUALITY OF LIFE
production (from 314,874 to 358,191 tonnes per year) between 1992 and 2012. This change has, however, been uneven between regions, presenting a decline of 27% in Western Europe and 63% in Central Asia, while an increase of 29% in Eastern Europe and 31% in northern Central Europe (FAO, 2017). In addition to honey and other direct calorific value of products derived from pollinator-dependent food crops, these products also benefit human health via supply a major proportion of micronutrients such as vitamin A, Iron and Folate; the fractional dependency of these micronutrient production on pollination is particularly high in southern areas of Western and Central Europe (ChaplinKramer et al., 2014).
2.2.1.3 Regulation of air quality The regulation of air quality by ecosystems is complex, depending on the atmospheric pollutant in question, emission levels, scale, and ecosystem characteristics. The contribution of vegetation varies according to multiple plant factors including species, leaf area, height, presence of wax or hair, evergreen versus deciduous lifeform and surface roughness. This needs to be balanced against their pollution resilience, as well as their potential to decrease air quality by trapping pollutants, emitting gases including biogenic volatile organic compounds (BVOC) and methane (Janhäll, 2015; Sæbø et al., 2012), and producing allergens (Asam et al., 2015). In many countries, greenhouse gas emissions are decreasing as countries seek to comply with commitments (EEA, 2015a) and the European Union Air Quality Directive (Directive 2008/50/EC)4, but trends in air quality regulation by ecosystems vary according to the balance between emissions and capture by vegetation. Between 2000 and 2010, in the European Union, nitrogen dioxide (NO2) removal by urban green areas increased by 0.8% (European Commission, 2015b). In Spain air quality has slightly decreased overall, but air quality regulation by forests improved between 1960 and 2010 as forest area increased due to land abandonment, with mountain areas showing mixed trends of forest area and rivers, lakes and wetlands showing decreases of forest area (Spanish NEA, 2013). Three aspects of the regulation of air quality by ecosystems are briefly reviewed here: (i) the broad contribution of different ecosystems; (ii) the impacts of parks and trees at the local scale in cities; and (iii) ecosystem contributions to emissions. Forests and trees are particularly important at both the regional and local level, especially in cities, for capturing pollutants through both wet and dry deposition. A simple estimation of air pollution capture and removal, based only on dry deposition velocity5 (as a measure of capacity of removal by vegetation) shows that for nitrogen
oxides (NOx), mountains with forests and natural grassland have a high capacity (primarily due to the higher level of pollutant capture by forests), while forests in Sweden and Finland and vegetation in parts of Central and Western Europe have intermediate capacity (Figure 2.6 A). When combined with local pollution concentrations in urban and peri-urban areas, it shows that trees in southern Scandinavia and parts of Central and Southern Western Europe are particularly important (Figure 2.6 B). However, this can vary according to factors including pollutant (type and emission level), topography and location. For example, in Limburg Province, Netherlands, the vertical capture of PM106 (mean kg km−2 yr−1) was estimated as: heath 2056, forest 2001, peat 968, cropland 956 and urban 535 (Remme et al., 2014), with heaths capturing more than forests, as they are closer to the emission sources. The total net benefit of vegetation in cities for capturing pollutants can be small relative to total emissions. For example, urban forests in Barcelona in 2008 removed 305.6 t of air pollutants and 19,036 t CO2eq, representing 2.66% of PM10 (particulate matter 10 micrometers or less in diameter), 0.43% of NO2, and 0.47% of CO2eq of emissions (Baró et al., 2014). The tree canopy in Greater London is estimated to remove between 0.7% and 1.4% of PM10 from the urban boundary layer (Tallis et al., 2011). Measurements of NO2, anthropogenic volatile organic compounds (VOCs) and particle deposition in two Finnish cities suggest that urban vegetation removes little pollution in northern areas (Setälä et al., 2013). Nevertheless, the amounts locally removed can be very important. Several studies demonstrating the removal of different pollutants by trees or parks in cities of the European Union show similar patterns, although quantitative results are mostly not directly comparable since the studies use different units. Studies of different Italian cities showed that generally evergreen broadleaved forests capture more ozone (O3) than coniferous forest, followed by mixed broadleaved and coniferous forest, with deciduous broadleaved forest capturing the least (e.g. Bottalico et al., 2016; Manes et al., 2016). For PM10 the sequence decreases from mixed broadleaved and coniferous forest, to coniferous forest, evergreen broadleaved forest and deciduous broadleaved forest (Manes et al., 2016). Seasonal differences include deciduous trees capturing more PM10 and O3 in summer when in leaf (e.g. Manes et al., 2016; Marando et al., 2016), while evergreens captured more in autumn and winter (Marando et al., 2016). Research on European urban trees found that Quercus and Platanus spp. have the highest PM removal efficiency (Grote et al., 2016). Thus, the selection of species planted can affect air quality regulation. In cities, trees can also reduce the dispersion of pollutants, leading to increased local concentrations (Janhäll, 2015).
4. http://eur-lex.europa.eu/legal-content/EN/TXT/?uri=CELEX:32008L0050 5. Rate of deposition of particles and gases (in this case) on vegetation
6. PM10 is particulate matter 2.5 to 10 micrometers in diameter
73
THE REGIONAL ASSESSMENT REPORT ON BIODIVERSITY AND ECOSYSTEM SERVICES FOR EUROPE AND CENTRAL ASIA
Figure 2
6
A 0
A Velocity of dry deposition of nitrogen oxides in cm/sec in parts of Western and Central Europe. Source: European Commission (2011). B Removal of nitrogen oxides (kg/ha) by trees in urban and peri-urban areas. Source: European Commission (2011).
400 km
N
NOx DRY DEPOSITION VELOCITY cm/s High: 3.8
Low: < 0.01
B 0
250
500 km
N
NOx REMOVAL kg/ha < 0.03 0.04 — 0.21 0.22 — 1.17 1.18 — 6.47 6.48 — 35.79 NON-EU COUNTRIES
Ecosystems can be sources or precursors of gases, which affect air quality. For example ammonia and methane are involved in the photochemical formation of O3, with agricultural fertilizer application and livestock contributing to ammonia emissions and livestock and wetlands to methane emissions (Kayranli et al., 2010). Trees can emit
74
biogenic volatile organic compounds (BVOCs), especially isoprenes, as well as allergens such as pollen (Grote et al., 2016). Modelling of BVOC emissions shows particularly high levels in parts of southern parts of Western Europe due to a combination of species and high temperatures, while in Scandinavia it is a result of the forest cover (Figure 2.7).
CHAPTER 2. NATURE’S CONTRIBUTIONS TO PEOPLE AND QUALITY OF LIFE
Figure 2
7
Modelled emissions of biogenic volatile organic compounds (VOC) from terrestrial vegetation in the western parts of Europe and Central Asia in 2000. Source: Steinbrecher et al. (2009). kg/km2 Month
Total VOC 65°N
200 60°N 400 55°N 600 50°N 800 45°N 1000
40°N
1200
35°N 30°N 0°
10°E
20°E
30°E
40°E
Air pollution can also indirectly affect ecosystems, through soil and water acidification, eutrophication, or crop and vegetation damage from O3 (EEA, 2016a), which all can reduce the ability of ecosystems to cope with particulate and gaseous pollutants. For example, in forests the critical O3 level (20,000 μg/m3/h during the summer season) was exceeded in 2013 in 66% of the 33 member countries of the European Environment Agency (EEA) (except in Turkey), with more northern countries in that area falling below this level, while in southern parts of Western Europe the critical level may be exceeded by a factor of four or five (EEA, 2016a). Air quality impacts quality of life, especially human health in cities (Queenan, 2017). For example, for 40 countries of Western and Central Europe in 2012, exposure to PM2.57, O3 and NO2 was responsible for 432,000, 75,000 and 17,000 premature deaths, respectively. The highest rates of years of life lost per 100,000 inhabitants due to PM2.5 were in Central and Eastern European countries, and for O3 the Western Balkans, Hungary and Italy (EEA, 2015a). Its direct and indirect impacts on processes, such as eutrophication and acidification, affect ecosystem health and species composition (Jones et al., 2014), which can influence their ability to supply other contributions from nature to people.
2.2.1.4 Regulation of climate Ecosystems are important in climate regulation as they affect greenhouse gas fluxes, contributing both to emissions and storage, which could enhance climate warming or climate mitigation, respectively. Nearly all countries in Europe and Central Asia have submitted “intended nationally 7. PM2.5 is particulate matter 2.5 micrometers or less in diameter
determined contributions” under the Paris Agreement, with ecosystems playing a role in their mitigation plans. Ecosystems can also influence heat transfers by reflecting or absorbing incoming solar radiation and moisture transfers through modifying water flows and evapotranspiration, as well as affecting microclimate, primarily through reducing temperature extremes (Edmondson et al., 2016). There is considerable uncertainty about the changes in carbon flux and balance. It has been estimated that, between 1950 and 2007, increased carbon biomass stocks in Europe’s forests represented 10% of the EU-158 cumulated fossil fuel emissions (Ciais et al., 2008), while between 1990 and 2012 there was a net decrease in greenhouse gas emissions from land use, land-use change and forestry (LULUCF) changes due to increased carbon storage (Figure 2.8), primarily as a result of increases in forest area, with 87% of the positive balance coming from Eastern Europe, 19% from Central Europe and 9% from Western Europe. It has been estimated, based on models and observations, that in continental Europe between 2000 and 2005, the balance of greenhouse gases was –29 ± 194 TgC yr–1 for croplands, forests and grasslands, as CO2 taken up mostly by forests and grasslands nearly balanced CH4 and N2O emissions (mostly from cropland), while for the 25 member States of the European Union at that stage the balance showed emissions of 34 ± 99 TgC yr–1 (Schulze et al., 2009). In Central Asia, net removals of greenhouse gases by land use, land-use change and forestry (LULUCF) between 1992 and 2012 increased from -5.3 to -25.1 Tg CO2eq (FAO, 2017), mostly due to increased area of grasslands. 8. Austria, Belgium, Denmark, Finland, France, Germany, Greece, Ireland, Italy, Luxembourg, the Netherlands, Portugal, Spain, Sweden and the United Kingdom
75
THE REGIONAL ASSESSMENT REPORT ON BIODIVERSITY AND ECOSYSTEM SERVICES FOR EUROPE AND CENTRAL ASIA
Figure 2
8
Net annual greenhouse gas emissions and removals for the land use, land-use change and forestry (LULUCF) sector (1990–2012) for Western, Central and Eastern Europe in TgCO2 equivalent. Source: Based on reporting by the United Nations Framework Convention on Climate Change (UNFCCC, 2014). Central Asia countries are not included as they have not reported for the entire period. Note that the vertical axis for Europe (Western, Central and Eastern Europe combined) has a different scale.
CENTRAL EUROPE
EUROPE 400
400
200
Tera g CO2 eq emitted
Tera g CO2 eq emitted
200 0 -200 -400 -600 -800 -1,000
0
-200
-400
-600 -1,200
total LULUCF
Settlements
total LULUCF
Forest
total LULUCF
Other land
-800 Settlements
-800 Wetland
-600
Grassland
-600
Settlements
-400
Wetland
-400
-200
Grassland
-200
0
Cropland
0
Cropland
Other land
200
2012
Net increases in emissions and decreases in carbon storage could have several causes, including wetland drainage, loss of wetlands and forests due to urban expansion, agricultural intensification, other land use changes, and emissions from northern peatlands due to climate change. In nearly all countries of Europe and Central Asia, forests are the most important net carbon sink and carbon stocks in living forest biomass between 1990 and 2015 were increasing or stable (see Figure 2.9). For some countries, however, wetlands can be more
76
Other land
200
Tera g CO2 eq emitted
400
1990
Wetland
EASTERN EUROPE
400
Forest
Tera g CO2 eq emitted
WESTERN EUROPE
Grassland
Forest
total LULUCF
Other land
Settlements
Wetland
Grassland
Cropland
Forest
Cropland
-800
-1,400
important in regulating climate but, given the decrease in wetland area in many parts of continental Europe (Dixon et al., 2016; EEA, 2016c) (see Section 2.2.1.6), they may not be able to maintain this contribution from nature to people into the future. In Russia, vegetation (primarily boreal forests and peatlands) and soils hold 16% (336 Gt) of the world’s carbon stores, with soils making the greater contribution. With climate change, the tundra zone could become a net emitter, especially of methane (Bukvareva et al., 2015).
1
0.5
0
0
-2
-2
Uzbekistan
1.5
Turkmenistan
8
Tajikistan
10
2
Kyrgyzstan
2.5
% CHANGE
EASTERN EUROPE
Kazakhstan
Ukraine
Russian Federation (1992)
Republic of Moldova (1992)
Georgia
Former Yugoslav Republic
Slovenia
Slovakia
Serbia
Romania
Poland
Lithuania
Latvia
Hungary
Estonia
Czech Republic
Cyprus
Croatia
Bulgaria
Bosnia and Herzegovina
United Kingdom
Switzerland
Sweden
Spain
Norway
Netherlands
Luxembourg
Italy
Greece
Germany
France
Finland
Denmark
Belgium
Austria
% CHANGE
9
Belarus (1992)
Albania
% CHANGE
Figure 2
Armenia
% CHANGE
CHAPTER 2. NATURE’S CONTRIBUTIONS TO PEOPLE AND QUALITY OF LIFE
Annual rate of change (%) in carbon stock in living above-ground and belowground forest biomass in Europe and Central Asia between 1990 and 2015. Source: Own representation based on FAO (2015c). WESTERN EUROPE
3
2.5
2
1.5
1
0.5
0
3
CENTRAL EUROPE
2.5
2
1.5
1
0.5
0
CENTRAL ASIA
16
14
12
6
4
2
-4
77
THE REGIONAL ASSESSMENT REPORT ON BIODIVERSITY AND ECOSYSTEM SERVICES FOR EUROPE AND CENTRAL ASIA
In Europe and Central Asia, soils represent a large carbon stock (Jones et al., 2012; Schulze et al., 2010) but the storage capacity varies depending on land use and soil type. Peat soils are undergoing major carbon losses due to drainage and cultivation (Akker et al., 2016). Cropland soil organic carbon is also declining in many areas of Europe and Central Asia (see Section 2.2.1.7), but agricultural soils represent a large potential sink if appropriate management practices are applied (Lugato et al., 2014). Figures vary for the area of cropland abandoned following the dissolution of the USSR (Schierhorn et al., 2013), but authors agree that this led to major carbon sequestration in soils (Kurganova et al., 2015). A process-driven ecosystem model (Vuichard et al., 2008) estimated that the conversion of 20 million ha of cropland to grassland resulted in an accumulated carbon sink of 64 TgC between 1991 and 2000. Estimates vary, however, due to the use of different methods and data and allowing for the conversion to forests, with the range being from −64 to −694 TgC sequestered (Dolman et al., 2012). Schierhorn et al. (2013), using a different process-based model, estimated that between 1990 to 2009 the 31 million ha of abandoned cropland in Western Russia, Ukraine, and Belarus combined, provided a net carbon sink of 470 TgC. In Central Asia, between 1982 and 2000, there was a decrease of soil organic carbon stocks of about 828 TgC, mainly due to the conversion of native rangelands into agricultural land, and to a lesser extent (5% of carbon losses) due to rangeland degradation (Sommer & de Pauw, 2011). Nitrogen deposition can increase terrestrial carbon sequestration and its effect is greatest in Central Europe, although across all subregions of Europe this effect is decreasing due to reduced deposition (Zaehle et al., 2011). Ecosystems, especially in urban areas, can be effective in microclimate regulation, through reducing local surface
Figure 2 10
temperatures by shading, and air temperatures by evaporative cooling and albedo effects. Local climate regulation has been estimated for 301 large urban zones in the EU-27, using the amount of energy emitted by a surface (surface emissivity) and an approximation of the evaporation potential of the land surface (f-evapotranspiration) to calculate the effect of different land covers on urban air temperatures (Larondelle et al., 2014). Climate regulation was found to be low across most of Western, Central and Eastern Europe, but high in Sweden, Finland and some cities in Spain, France and Italy, with a more heterogeneous pattern elsewhere (see Figure 2.10). This primarily reflects the percentage of forest and tree cover in the core urban area and its hinterland. A global meta-analysis of the cooling potential of urban parks found an average reduction of ambient daytime temperature by 0.94°C and of nighttime temperature by 1.15°C (Bowler et al., 2010), although a few studies found small increases in temperature. The magnitude of the effects varies according to climatic region, size of park or forest (Bowler et al., 2010) and the species involved (e.g. Leuzinger et al., 2010). For example, a comparison of temperatures in a street and the National Garden in Athens, Greece, found the greatest differences at night of up to 6.3°C cooling by the park (Zoulia & Santamouris, 2008), while in Manchester, UK, tree shading was found to reduce air temperatures by 1–2°C (Armson et al., 2012) and in an intra-urban park in Moscow, winter temperatures can be 0.74°C higher and summer temperatures 1.64°C lower than in the city centre (Shahgedanova et al., 1997). Climate regulation by ecosystems contributes to other contributions from nature to people (e.g. habitat maintenance (Section 2.2.1.1), erosion control (Section
Urban heat regulation in cities in the EU-27, based on an approximation of the evaporation potential of the land surface (f-evapotranspiration). Low values indicate greater cooling. Core city areas on the left; larger urban areas on the right. Source: Larondelle et al. (2014). F-EVAPOTRANSPIRATION MEAN 0.81 — 0.86 0.87 — 0.89 0.90 — 0.92 0.93 — 0.96 0.97 — 1.02 1.03 — 1.11 N 0 390 780 1,560 2,340 km
CORE CITY AREAS
78
LARGER URBAN AREAS
CHAPTER 2. NATURE’S CONTRIBUTIONS TO PEOPLE AND QUALITY OF LIFE
2.2.1.8), water quality (Section 2.3.1.6)), while carbon sequestration in soils can increase food security (Section 2.3.1.1). Furthermore, the reduction of urban temperatures in hot weather (Section 2.3.2) can lower rates of heat-related mortality and morbidity, especially in elderly and chronically ill individuals and socially vulnerable people and those with respiratory diseases (Hajat et al., 2010). A study of 12 Western and Central European cities suggested that this is particularly important in the Mediterranean region (Michelozzi et al., 2009).
2.2.1.5 Regulation of ocean acidification Ocean acidification has been shown to affect marine organisms, having especially negative effects in calcifying organisms such as bivalves, brittle stars, sea urchins, coralline algae and corals (Cornwall et al., 2017; Cornwall et al., 2015; Kroeker et al., 2013) and on the contributions they provide to people (Lemasson et al., 2017). Some of these organisms live in or nearby coastal vegetated ecosystems, which have been shown to regulate atmospheric CO2 concentrations and seawater pH (Cornwall et al., 2013; Hendriks et al., 2014) with effects on calcification processes of marine organisms important to humans (e.g. corals, bivalves or sea urchins) (IPBES, 2017a). Marine macrophytes, such as large brown macroalgae and seagrasses, are net CO2 consumers, and their metabolism creates pH fluctuations in seagrass meadows and kelp forests where they are dominant species and very abundant. This regulation of pH can entail increases of 1 pH unit during the day (Middelboe & Hansen, 2007). This up-regulation can depend on many factors, such as plant biomass and structure, hydrodynamics, irradiance and day-length (Krause-Jensen et al., 2016). Vegetated habitats may, therefore, contribute to regulating ocean acidification and creating refugia for calcifying organisms (Hurd, 2015; Krause-Jensen et al., 2016). There is increasing evidence that pH increase can lead to an overall buffering of ocean acidification (Buapet et al., 2013; Hendriks et al., 2014; Krause-Jensen et al., 2015; Krause-Jensen et al., 2016). Nevertheless, pH in these habitats typically fluctuates, with higher pH during daytime due to CO2 uptake by photosynthesis and lower pH at night due to respiration and release of CO2. In fact, some studies postulate that macrophytes may amplify the negative effects of ocean acidification, at least for some organisms (Pettit et al., 2015; Roleda et al., 2015). The potential role of regulating ocean acidification of marine vegetated habitats may depend on the balance between positive effects in the daytime and negative effects during the night (Krause-Jensen et al., 2016). For example, long days in the Arctic vegetated habitats have been shown to promote the provision of refugia for calcifying organisms during summer (KrauseJensen et al., 2015; Krause-Jensen et al., 2016), when organisms reproduce and are most vulnerable to ocean
acidification (Kroeker et al., 2013; Lemasson et al., 2017). However, the long polar nights should result in a downregulation of pH, potentially amplifying negative effects of ocean acidification during winter. However, calcifying organisms are likely less susceptible to low pH in the later conditions (Kroeker et al., 2013). Despite the importance of marine vegetated habitats, declines of seagrass beds and kelp forests have been reported in many parts of Europe and Central Asia (Araújo et al., 2016; Boudouresque et al., 2009) (see Sections 2.2.1.1. and 3.3.2.3). For example, decline of the seagrass Posidonia oceanica has been reported across the entire Mediterranean Sea, and during the last 50 years between 11 and 52% of the documented surface area originally occupied by the species has been lost, with many existing meadows deteriorating (Telesca et al., 2015). It is predicted that this trend will continue and the functional extinction of P. oceanica meadows is foreseen by the middle of this century (Jorda et al., 2012), even if seagrasses are likely to benefit from increased CO2 worldwide (Zimmerman et al., 2017). Therefore, organisms associated with seagrass communities that are deteriorating may be exposed in the future to lower pH regimes due to the loss of pH-buffering capacity (Hendriks et al., 2014). By contrast, these marine vegetated habitats may increase in the Arctic Ocean, led by warming of seawater (Krause-Jensen & Duarte, 2014). The predicted poleward expansion of macrophytes with seawater warming and reduced sea-ice cover (Jueterbock et al., 2013) may increase the potential for pH up-regulation during summer in Arctic marine systems (Krause-Jensen et al., 2016). Similarly, increased pelagic primary production, as forecast for parts of the Arctic Ocean, may also create local niches of high pH (Arrigo et al., 2008; Popova et al., 2012).
2.2.1.6 Regulation of freshwater quantity and flow This contribution from nature to people involves the contribution of ecosystems to the regulation of the quantity and flow of surface and groundwater used for drinking, irrigation, and industrial purposes. Besides contributing to direct use, ecosystems can also regulate water flow to water-dependent natural habitats that in turn affect people downstream, including via floods and droughts. See supporting material Appendix 2.29 with quotes from indigenous and local knowledge holders describing this contribution, in relation to seasonal water flows. This section distinguishes between freshwater provision and water flow regulation. Freshwater supply describes freshwater available for human use. Water flow regulation, 9. Available at https://www.ipbes.net/sites/default/files/eca_ch_2_ appendix_2.2_ilk_content_of_ncp.pdf
79
THE REGIONAL ASSESSMENT REPORT ON BIODIVERSITY AND ECOSYSTEM SERVICES FOR EUROPE AND CENTRAL ASIA
Trend of renewable internal freshwater resources per capita (median, in cubic meters) for Europe and Central Asia (ECA) and the four subregions. Note that the trend for Europe and Central Asia until 1992 (dashed lines) is based on Western and Central Europe only. Source: Own representation based on FAO (2016).
5,000 4,500 4,000 3,500 3,000 2,500 2,000 1,500 1,000 500
2014
2012
2007
2002
1997
1992
1987
1982
1977
1972
1967
0 1962
MEDIAN FRESHWATER RESOURCES PER CAPITA FOR ECA COUNTRIES (M³)
Figure 2 11
YEAR WESTERN EUROPE
CENTRAL EUROPE
EASTERN EUROPE
on the other hand, is described in terms of supply through the indicators of water retention, stream flow and base flow. The general trend in freshwater supply in Europe and Central Asia, taking into account renewable internal freshwater resources per capita provided by the Food and Agriculture Organization of the United Nations (FAO, 2016), shows an overall decrease since 1992 (Figure 2.11). Freshwater demand, taking into account water use and water abstraction, shows a mixed but overall decrease for all subregions of Europe and Central Asia (EEA, 2015e; FAO, 2013) since the 1990s. Between 2000 and 2011, water abstraction has decreased for countries in the European Union (European Commission, 2015b). Generally mixed but mostly decreasing trends in water flow regulation were found for parts of Western, Central and Eastern Europe (Stahl et al., 2010; UNEP & UNECE, 2016). Between 2000 and 2011, water flow regulation decreased for most ecosystems in the European Union (European Commission, 2015b). Regions with increased or stable water flow regulation are characterized by large areas of natural vegetation or extensive agriculture (Sturck et al., 2014). Water supply in Western Europe, measured in freshwater availability, has been decreasing since the 1980s (FAO, 2016) (Figure 2.11). Decreased freshwater availability was also reported for Spanish riparian areas and rivers (Vidal-Abarca Gutiérrez & Suárez Alonso, 2013). Mixed trends for water availability were found for Germany and Austria (Karabulut et al., 2016). Water demand in Western
80
CENTRAL ASIA
EUROPE AND CENTRAL ASIA
Europe, taking into account water use and surface water abstraction, has decreased since the early 1990s, although current trends are mixed (EEA, 2015e; Eurostat, 2016b). Water use has remained stable in the southern part but has decreased in the western part of Western Europe (EEA, 2015e). Groundwater extraction in Mediterranean river basins in France, Greece and Spain was reported to have increased (Skoulikidis et al., 2017), while overall groundwater extraction in Spain has decreased (VidalAbarca Gutiérrez & Suárez Alonso, 2013). Mixed trends for water use were found for the Danube basins in Germany and Austria (Karabulut et al., 2016) as well as water provision in the Llobregat basin in Spain. Mixed but predominantly increasing stream flow was found for Western Europe, although large differences exist between the north and the south (Stahl et al., 2010). Decreasing stream flow in the last decades was reported for the Mediterranean countries as well as Austria and Germany (Skoulikidis et al., 2017; Stahl et al., 2012). Decreased water flow regulation was reported for Spanish riparian areas (Vidal-Abarca Gutiérrez & Suárez Alonso, 2013). Mixed trends for stream flow were found in Switzerland (Lutz et al., 2016). Increased stream flow was found for the majority of the northern countries of Western Europe (Stahl et al., 2010, 2012), as well as in the Hula Wetland, Israel. Water supply in Central Europe, measured in freshwater availability, has decreased since the 1990s, although this trend has been mixed in the past decade (FAO, 2016) (Figure 2.11). Mixed trends in water availability were discerned for Central European countries within the Danube basin (Karabulut et al., 2016). Water demand, taking into
CHAPTER 2. NATURE’S CONTRIBUTIONS TO PEOPLE AND QUALITY OF LIFE
account water use and surface water abstraction in Central Europe, has declined sharply since the early 2000s, but this trend has been mixed in the past decade (EEA, 2015e; Eurostat, 2016b). Mixed trends for water abstraction have been reported for Central European Mediterranean river basins (Karabulut et al., 2016), whereas water abstraction in Cyprus has increased (Skoulikidis et al., 2017). Mixed but predominantly increasing stream flow was found for Central Europe (Stahl et al., 2010). Decreasing water flow during recent decades was reported for Cyprus, the Czech Republic and Slovakia, as well as the Sava River in Slovenia, Croatia, Bosnia and Herzegovina, Serbia, Montenegro and Albania (Lutz et al., 2016; Skoulikidis et al., 2017; Stahl et al., 2010). Stable water flow and ground water levels in the past were found in Slovenia and Poland. Water supply in Eastern Europe, measured in freshwater availability, has increased since the 1990s and this trend has stabilized in the past decade (FAO, 2016) (Figure 2.11). Information on water demand in Eastern Europe is limited to a few countries, however, freshwater abstraction in the Republic of Belarus and the Republic of Moldova is reported to have decreased steadily over recent decades. A mixed trend for water demand was reported in the Eastern European countries of the Danube basin (Karabulut et al., 2016). Stream flow has decreased in most parts of Eastern Europe (Stahl et al., 2012). Water flow regulation in Russia was found to have increased between 1990 and 2015 (Miura et al., 2015). Water supply in Central Asia, measured in freshwater availability, shows a mixed, but generally decreasing trend since the 1990s, and has continued to decrease over the past decade (FAO, 2016; SAEPF et al., 2012) (Figure 2.11). Water availability per capita has decreased in Turkmenistan and Uzbekistan, while stable water availability was reported for the Aral Sea basin (Uzbekistan). Total water withdrawal in Central Asia has been stable in the past, while water withdrawal by agriculture, industry and cities has decreased (Alexander & West, 2011; FAO, 2013). There is some evidence of on-going stable water use in Uzbekistan (Aral Sea basin), as well as excess water use for irrigation on a local scale (Conrad et al., 2016). Mixed trends for water use were reported for Uzbekistan, due to strong regulation in response to droughts. Water extraction in the Kyrgyz Republic has decreased, although recent trends are mixed. Water use and availability have decreased in Turkmenistan and Uzbekistan (FAO, 2013). Water flow regulation throughout Central Asia shows a mixed trend, following patterns in precipitation and drought occurrences (FAO, 2013; SAEPF et al., 2012). Regulation of freshwater quantity and flow mostly contributes to quality of life by supporting water and food security (Section 2.3.1). Water security, which is furthermore underpinned by water quality regulation (Section 2.2.1.7)
and other contributions from nature to people, is mostly sufficient and has increased in Europe and Central Asia since the late 1980s. More mixed trends and insufficient water security, notably in rural areas, are reported for Eastern Europe and Central Asia. Europe and Central Asia as a whole is food secure but food security is affected by, among others, decreasing water availability and excessive water withdrawal.
2.2.1.7 Regulation of freshwater and coastal water quality This contribution from nature to people refers to nature’s ability to remove or break down excess nutrients and other pollutants. The combination of physical, chemical and ecological processes in rivers, wetlands and marine ecosystems acts as a natural filter removing substances such as sediments and nutrients linked to nitrogen and phosphorus. Water quality regulation, therefore, depends on both the emission of pollutants into the water, and on the capacity of the natural systems to process or transform these substances and physically block them by sediments. For example, natural, restored and constructed wetlands in the European Union are estimated to remove 75% of the nitrate from agricultural runoff via denitrification (Blackwell & Pilgrim, 2011). Nature-based solutions associated with artificial wetlands and restoration of riparian zones have been demonstrated as cost effective measures for water quality improvement in Estonia, Norway, Sweden, Italy, Belgium and the UK (e.g. Kumar et al., 2017; MWO, 2012; Zedler & Kercher, 2005). The capacity of ecosystems to deliver this contribution to people shows sharp local variations along the rivers inside watersheds. If upland riverbeds are well conserved and pollution is limited, water quality can be well regulated. Downstream, rivers are often impacted by land use intensification, riparian wetlands reduction, overexploitation of water resources and alteration of the river bed morphology. In the latter case, the capacity of rivers to regulate water quality is diminished. The capacity to provide this contribution in Europe and Central Asia has reduced over recent decades due to the conversion and habitat loss of rivers, wetlands and coastal systems (see Section 3.2.2.2), leading to a 60% decrease in the areal extent of floodplains and wetlands and loss of watersheds’ ecological integrity (Geijzendorffer et al., 2017). In 2017 it was estimated that 38% of rivers’ surface in the European Union have good or high ecological status, 42% moderate state and 20% poor or bad status (Grizzetti et al., 2017). In 2009, 43% of water bodies still showed a good or high ecological status (EEA10), indicating a reduction of rivers with good status over the past eight years. 10. https://www.eea.europa.eu/soer-2015/europe/freshwater
81
THE REGIONAL ASSESSMENT REPORT ON BIODIVERSITY AND ECOSYSTEM SERVICES FOR EUROPE AND CENTRAL ASIA
Despite the loss of ecological integrity and areal extent of floodplains and wetlands, the water quality of rivers in the European Union has been improving since the 1990s as a result of the reduction of pollutants (due to the Nitrates Directive (91/676/EEC) and European Union Water Framework Directive (2000/60/EEC)) or as a result of transnational efforts such as the Convention on the Protection of the Rhine. The improvement in water quality is, therefore, the consequence of reductions in pollution, rather than an enhancement of the ecosystems’ capacity to provide this contribution from nature to people. The quality of drinking water and bathing water, and the effectiveness of wastewater treatment, continue to improve across the European Union (EEA, 2016e). For example, the percentage of bathing water sites meeting the minimum water quality standards has increased to 96.1% in 2015. In Western Europe, the capacity to regulate water quality has been diminished since 1990. For example, in Spain and Germany, it is considered the most degraded regulating contribution from nature to people (Spanish NEA, 2013). In the Mediterranean basin, the regulation of water quality by wetlands has been jeopardized by the decreasing ecological integrity and scarce water availability (Geijzendorffer et al., in press; MWO, 2012). However, in other areas, water quality regulation by ecosystems has remained stable (e.g. England) (UK NEA, 2011) or has increased (e.g. Netherlands) (de Knegt, 2014). Despite this general negative trend, water quality in Western Europe has improved due to pollution reduction. After the adoption of the European Union Nitrates Directive and Water Framework Directive, water pollution showed a downward-trend. Still, many water bodies remain affected by dissolved inorganic nutrients and pesticides (EEA, 2015d). In Central Europe, the overall decreasing trend, due to increased pollution and conversion of floodplains and wetlands, is illustrated in Turkey, Austria, Hungary, Romania and the Danube floodplain (e.g. Hainz-Renetzeder et al., 2015; Karadeniz et al., 2009; Pehlivanov et al., 2014). In addition, the demand for water purification is increasing due to agriculture and urban expansion. In Eastern Europe, water quality currently displays a downward trend due to nitrogen surpluses from intensive agriculture or the conversion of natural ecosystems (e.g. Bouraoui & Grizzetti, 2014). In Russia, the capacity to regulate water quality by forests and tundra of Siberia and eastern Russia has remained stable in the past (Stolbovoi, 2002). However, in the southern regions of Russia, the Southern Urals and Western Siberia, this capacity was found to be lower (Stolbovoi, 2002). For Central Asia, published data is not available. Regarding the regulation of water quality in coastal and marine waters, the concentrations of dissolved inorganic nitrogen, oxidized nitrogen and orthophosphate have
82
remained stable between 1985 and 2012 in Seas of Europe (Figure 2.12) (EEA, 2015c). Monitoring stations in the southern area of the North Sea (historically affected by eutrophication) show a decreasing trend in nitrogen and phosphorus concentrations (Figure 2.12). The Baltic Sea, which is also affected by eutrophication, shows a decreasing trend in nitrogen concentration, but an increase in phosphate concentrations (Figure 2.12) (EEA, 2015c). The adoption of national marine strategies fostered by the Marine Strategy Framework Directive (2008/56/EC) has supported the improvement of water quality in coastal and marine waters of the European Union. The contributions of water quality regulation to quality of life are manifold, with particular interest for water security (Section 2.3.1.3), health (Section 2.3.2), and the enjoyment of recreational experiences in nature (Section 2.2.3.2). The restoration and construction of wetlands, together with the Nitrates, Water Framework the Marine Strategy Framework Directives of the European Union, are driving the decrease in water pollution. However, the loss of areal extent of wetlands and floodplains can jeopardize the future delivery of this contribution from nature to people.
2.2.1.8 Formation and protection of soils This contribution from nature to people relates to: (i) the central role of soils, which have high levels of biodiversity and which are crucial to several other contributions such as food and feed provision, freshwater quantity and quality regulation, climate regulation, hazards regulation; and (ii) the control of erosion. In addition, threats to soil such as erosion, loss of organic matter and biodiversity contamination, salinization, compaction, acidification and sealing) can severely decrease the ability of soils to deliver this contribution (FAO, 2015b).
2.2.1.8.1 Soil functioning: soil quality Soil’s essential functions are to capture, store and release carbon, nutrients and water; detoxify contaminants and purify water; degrade and recycle wastes; control pests; host a wide diversity of organisms; and create habitat for roots, fungi and invertebrates. The capacity of soil to perform these functions is called soil quality (Karlen et al., 1997). Soil’s quality depends on its inherent physical, biological and chemical properties. Soil biota play a major role in this regard (European Commission, 2016b). Several indicators are used for soil quality (Karlen et al., 1997; European Commission, 2014b), soil fertility (e.g., Burkhard et al., 2014; Mueller et al., 2014; Tóth et al., 2013), and for soil’s ability to naturally attenuate contaminants (e.g., Makó et al., 2017; Stone et al., 2016; Van Wijnen et al., 2012). Soil organic carbon content, a widely used and
CHAPTER 2. NATURE’S CONTRIBUTIONS TO PEOPLE AND QUALITY OF LIFE
Figure 2 12
Stations of European Seas (Iceland Sea, Norwegian Sea, Celtic Sea, North Sea, Baltic Sea, Bay of Biscay and the Iberian Coast, Mediterranean Sea, Adriatic Sea and Black Sea) with available data for the period reported (1985–2012) showing a statistically significant decrease (green), increase (red) or no trend (grey) of A winter dissolved inorganic nitrogen, B oxidized nitrogen and C orthophosphate concentrations. Source: EEA (2015c).
A
Observed trends in winter DIN (NH4+NO3+NO2) concentrations in European Seas, 1985-2012
C
Observed trend in winter orthophosphate (PO4) concentration in European Seas, 1985-2012)
B
Map of observed trends in winter oxidised nitrogen (nitrate+nitrite) concentrations
Decrease Increase No trend Time series ≤10 years Time series >10 years Baltic Sea NORTH EAST ATLANTIC OCEAN Barents Sea Norwegian Sea Iceland Sea Celtic Sea Greater North Sea (incl. Kattegat and the English Channel) Bay of Biscay and the Iberian Coast Macaronesia
MEDITERRANEAN SEA Western Mediterranean Sea Ionian sea and the Central Mediterranean Sea Aegean-Levantine Sea Adriatic Sea Black Sea
frequently available indicator of soil quality (Lorenz & Lal, 2016) is used here. Most cultivated soils of Europe and Central Asia are intrinsically fertile except the drylands of Central Asia and salinized soils of Central Asia and Mediterranean Europe
(FAO, 2015b; UNEP & UNECE, 2016) (Figure 2.13). The organic carbon content of soils is very variable across land uses and soil types in Europe and Central Asia, generally low in cultivated soil, and high in forest and permanent grassland. Trends also vary with land use. While most grassland soils and forest soils accumulate
83
THE REGIONAL ASSESSMENT REPORT ON BIODIVERSITY AND ECOSYSTEM SERVICES FOR EUROPE AND CENTRAL ASIA
Figure 2 13
Soil quality indicated by constraints on nutrient availability. The more fertile the soils, the fewer constraints there are on nutrient availability to plants (none or slight, moderate, severe, very severe) (Fischer et al., 2012). Source: Map extracted from Data Basin at https://databasin.org/datasets/20dcb500682c4ec891e2fc881c2ed65c.
74.40°N
35.82°W N
3.67°N
0
1,870 km (1,160 miles)
130.46°E
HARMONIZED WORLD SOIL DATABASE GLOBAL SOIL QUALITY – CONSTRAINTS ON NUTRIENT AVAILABILITY
Mainly non-soil
Moderate
None or Slight
Null
carbon, cultivated soils tend to loose carbon due to previous conversion from grassland or forest to intensive and continuous arable land and to drainage (Jones et al., 2012). This loss has been widely documented in Western Europe (e.g. Capriel, 2013; Goidts & Wesemael, 2007; Heikkinen et al., 2013), in Central Europe where about 70% of Turkish agricultural soils are losing soil organic matter (FAO, 2015b), in Eastern Europe (Sychev et al., 2016) where more than 56 million ha of agricultural mineral soils are losing organic matter (FAO, 2015b), and in Central Asia (Causarano et al., 2011; Sommer & de Pauw, 2011) where the cultivation of virgin lands in Kazakhstan between 1982 and 2000 resulted in the loss of approximately 570 million tonnes of carbon from soils (FAO, 2015b; Sommer & de Pauw, 2011). When alternative cropping practices such as conservation agriculture, organic agriculture or agroforestry are implemented, soil organic carbon loss is reversed, along with soil quality (e.g. Torralba et al., 2016). Land use changes occurring in Europe and Central Asia since 1990, such as afforestation and large-scale abandonment of cropland in the former USSR, resulted
84
Permafrost area
Severe
Very severe
Water bodies
in increases in soil carbon content (Fuchs et al., 2016; Kurganova et al., 2015). A recent trend regarding the maintenance of fertile soils in Europe and Central Asia is the net loss of soil due to urbanization and sealing that occurs predominantly in Western Europe (Montanarella et al., 2015; EEA 2015) and preferentially at the expense of cropland (Figure 2.14) (EEA, 2015b).
2.2.1.8.2 Erosion control Soil erosion is the accelerated removal of soil from the land surface by water, wind or tillage. It threatens the sustainability of agriculture and forestry because of the loss of fertile topsoil, as well as causing damages off-site to settlements and infrastructure and affects the quality of surface waters. The severity of water erosion depends mainly on slope, soil erodibility, and soil cover by plants and litter (Lal, 2001b). Wind erosion depends on soil erodibility and soil cover (Lal, 2001a). Erosion, therefore, takes place mainly on vegetationfree surfaces and, therefore, primarily affects arable land. Soil erodibility depends particularly on soil texture and soil organic matter content (Le Bissonnais & Arrouays, 1997).
CHAPTER 2. NATURE’S CONTRIBUTIONS TO PEOPLE AND QUALITY OF LIFE
Figure 2 14
Change in agricultural land use expressed as a percentage of total agricultural area (%). 2000–2006, EU-27. On average 50% of land conversion in the European Union is at the expense of agricultural land. Source: Eurostat (2017).
Administrative boundaries: @EuroGeographics © EuroGeographics © UN-FAO © Turkstat Cartography: Eurostat, European Commission Source: Joint Research Centre, European Commission
Data for EL, MT and UK not available.
1.5
Erosion control can be defined as the erosion avoided due to the vegetation cover or to a well-aggregated soil (Guerra et al., 2016). The soil cover factor (C) of the “universal soil loss equation” model for water erosion or its revised version, accounting for the effect of vegetation on water erosion, is used as an indicator of the capacity to control erosion (European Commission, 2014b; Panagos et al., 2015a). In the Mapping and Assessment of Ecosystem Services project, erosion control by vegetation was estimated as: (i) the difference of eroded soil with and without vegetation; and (ii) the capacity of ecosystems to avoid erosion (European Commission, 2015b).
85
THE REGIONAL ASSESSMENT REPORT ON BIODIVERSITY AND ECOSYSTEM SERVICES FOR EUROPE AND CENTRAL ASIA
Vegetation cover is very heterogeneous in the EU-27 (Figure 2.15) (Panagos et al., 2015a) and in Eastern Europe and Central Asia (Figure 2.16) in relation to climate. With a lower C factor, the capacity of ecosystems to avoid soil erosion is thus lower in Mediterranean areas of Europe and Central Asia (Figure 2.17) (Kulikov et al., 2016). Vegetated soil cover has decreased in many
Figure 2 15
areas of Europe and Central Asia in relation to intensive cultivation, rangeland degradation and desertification (FAO, 2015b; Gupta et al., 2009; Le et al., 2014). Management practices such as conservation agriculture, cover crops and residue return, when implemented locally, increased the C factor (Holland, 2004; Panagos et al., 2016; Panagos et al., 2015a).
Soil erosion cover management factor (C factor) for the European Union. Source: Panagos et al. (2015a). This factor, which decreases with soil cover (1 to 0) is a multiplicative factor to estimate the amount of eroded soil per unit surface using the revised universal soil loss equation (RUSLE) model.
30° W
20° W
C-factor < 0.01 0.01 - 0.03 0.03 - 0.07
60° N
0.07 - 0.1 0.10 - 0.15 0.15 - 0.19 0.19 - 0.23 0.23 - 0.27 0.27 - 0.32 > 0.32
40° N
50° N
N
86
10° W
0
10° E
20° E
30° E
40° E
50° E
CHAPTER 2. NATURE’S CONTRIBUTIONS TO PEOPLE AND QUALITY OF LIFE
Erosion control decreased on agricultural land over the last two decades in Europe and Central Asia and is still decreasing in many areas of Central Asia (FAO, 2015b; Gupta et al., 2009) and the East European plain in Eastern Europe (FAO, 2015b; Golosov et al., 2011; Sorokin et al., 2016). By contrast, erosion control has
increased in the EU-27 between 2000 and 2010 by an average of 9.5%, and by 20% for arable lands (Panagos, et al., 2015b) and in Mediterranean Europe between 2001 and 2013 (Guerra et al., 2016). Common Agricultural Policy intervention measures, promoting practices such as reduced tillage, residue return, cover crops,
Soil erosion cover management factor (C factor) for Eastern Europe and Central Asia. Source: Nachtergaele et al. (2010).
Figure 2 16
Source: F. O. Nachtergaele, M. Petri, R.Biancalani, G. van Lynden, H. van Velthuizen, 2010. Global Land Degradation Information System (GLADIS). beta version. An Information database for Land Degradation Assessment at Global Level.
Russian Federation
Ukraine
Kazakhstan
Turkey
Turkmenistan
0 — 0.1
0.1 — 0.2
Figure 2 17
0.2 — 0.3
Uzbekistan
0.3 — 0.4
Tajikistant
Kyrgystan
0.4 — 0.5
0.5 — 0.6
0.6 — 0.7
0.7 — 0.8
0.8 — 0.9
0.9 — 1
Capacity of ecosystems to avoid erosion (0= lowest capacity; 1=highest capacity). Source: European Commission (2015b).
CAPACITY TO AVOID SOIL EROSION 2010 0–1 0 – 0.9 0.9 – 0.95 0.95 – 0.97 0.97 – 0.98 0.98 – 1
87
THE REGIONAL ASSESSMENT REPORT ON BIODIVERSITY AND ECOSYSTEM SERVICES FOR EUROPE AND CENTRAL ASIA
conservation agriculture, contour farming and grass strips can explain this trend (Panagos, et al., 2015b). In Central Asia, the surface area of cropland under conservation agriculture, albeit very small, has more than doubled between 2007 and 2011 (Buhlmann et al., 2010; Nurbekov et al., 2016).
2.2.1.9 Regulation of natural hazards and extreme events The Europe and Central Asia region is exposed to a range of natural hazards, including droughts, floods, landslides and avalanches, storms and wildfires. In the European Union, floods account for 40% of the damages by natural hazards and affect 50% of the population (European Commission, 2015c). With flooding being the most damaging natural hazard, this section focuses on trends of coastal and fluvial flood regulation, while we first briefly report on the general trends in the regulation of other natural hazards. Note that information on nature’s capacity to regulate natural hazards is generally lacking for Europe and Central Asia, while information on the occurrence of natural hazards is more abundant. The severity, frequency and persistence of meteorological and hydrological droughts have increased in Europe and Central Asia since the 1960s, although there are large differences across the region (EEA, 2016d; EM-DAT, 2017). Drought frequency in south-western and central Mediterranean Europe has increased, but has decreased in northern parts of Western Europe and parts of Eastern Europe (EEA, 2016d). The continued degradation and decline of wetland area (Section 2.2.1.7) has contributed to the reduced capacity to regulate droughts (Kumar et al., 2017).
Figure 2 18
The severity and frequency of landslides and avalanches have mixed trends for the region (EM-DAT, 2017), while an increase in fatal landslides is observed for Western, Central and Eastern Europe (Haque et al., 2016). The regulation of landslides is directly related to the amount of protected forest cover, especially in mountainous areas, and their protection status has changed little in recent decades (Miura et al., 2015). The frequency and severity of wildfires has generally increased throughout Europe and Central Asia (EMDAT, 2017) and this trend continues, notably in Eastern Europe (Gauthier et al., 2015) and causing changes in Mediterranean forests (Pausas et al., 2008). The regulation of wildfires depends strongly on the plant composition of forests, protective forest management, and preservation of forest health, the latter being negatively affected by climate change. In coastal areas, floods are caused by storm surges and sea level rise, whereas fluvial flooding predominantly occurs due to intensive and enduring rainfall within a catchment (Reed, 2002). Nature’s capacity to attenuate flooding is reported in terms of the extent to which floods are regulated, whereas the occurrence and severity of floods, as well as the damage caused. The impact of natural hazards depends on the number of people affected, which is increasing as more people live in risk prone areas, such as river floodplains or coastal areas (Dawson et al., 2009). Information on nature’s capacity to regulate floods in Europe and Central Asia is limited and generally shows a mixed trend. Increasing trends are reported for some countries of the European Union and Russia since the 2000s (European Commission, 2015b), but decreasing trends are reported
Trends of flood occurrence for Europe and Central Asia. Source: Own representation based on EM-DAT (2017).
NUMBER OF FLOOD OCCURENCES
140
120
100
80
60
40
20
0
1978-1982
88
1983-1987
1988-1992
1993-1997
1998-2002
2003-2007
2008-2012
2013-2017
CHAPTER 2. NATURE’S CONTRIBUTIONS TO PEOPLE AND QUALITY OF LIFE
for densely populated areas with intense rainfall and where most floodplain landscapes and wetlands have been heavily transformed (Heintz et al., 2012; Solín et al., 2011). In addition, the frequency and intensity of floods increased significantly from the 1980s to 2000, after which the number of floods stabilized at a high occurrence and severity (EEA, 2016b; EM-DAT, 2017) (see Figure 2.18). Almost 1,500 river floods have been reported for the European Union since 1980, of which more than half have occurred since 2000 (EEA, 2016b), although this increasing trend has a large inter-annual variability (EEA, 2016b; EM-DAT, 2017). The increasing number of severe floods is related to higher frequency of heavy precipitation events and decreased capacity to regulate fluvial floods. Although there are reported increasing trends for flood regulation for some Western European countries since the 2000s (European Commission, 2015b), general trends are mixed and not well established. However, the number of coastal and river floods in Western Europe has increased since the 1980s, with a strong peak in 2000, and has remained stable but fluctuating in the last decade (EEA, 2016b; EM-DAT, 2017). The strongest increase in number of floods was reported for the southern part of Western Europe, while this number has decreased for most of the northern countries in this subregion (EM-DAT, 2017). The number of severe and very severe floods follows the same trend, with the sharpest increases reported for Spain, Germany and France (EEA, 2016b). Western European countries, such as Germany and France, are ranked among the 20 countries world-wide most affected by weatherrelated catastrophes in the past 20 years, including floods or landslides after heavy rains (Kreft et al., 2016). The most affected countries in the period 1995-2014 in terms of deaths caused by these climate-change events were Italy, Spain and France (Kreft et al., 2016). In Central Europe, increasing trends for flood regulation since the 2000s are reported (European Commission, 2015b), but general trends are mixed. Studies in Bulgaria, Hungary and Poland demonstrated decreased flood regulation over time, in addition to increases in precipitation (Acreman et al., 2007; Mrozik, 2016; Pehlivanov et al., 2014). The number of floods in Central Europe has increased significantly since the 1980s, and this trend has continued in the last decade (EEA, 2016b; EM-DAT, 2017). The number of severe river floods follows the same trend, with the sharpest increase reported for Bulgaria, Poland and Slovenia (EEA, 2016b). Periodic overload of drainage systems and local inundations were reported for Poland, as a result of transformation of areas of permeable surfaces (arable land) into impermeable areas (built-up areas) (Mrozik, 2016). Mixed trends of flood frequency were reported for Slovakia, while land cover change negatively affected the capacity to regulate floods (Solín et al., 2011). In addition, the Central European subregion, particularly Romania
and Slovenia, has suffered higher damage due to climatechange events than Western Europe (Kreft et al., 2016). No clear trends in flood regulation have been reported for Eastern Europe. However, the loss of forests and woodlands is assumed to negatively impact the capacity for natural flood mitigation (Bradshaw et al., 2007; Schmalz et al., 2016). In the Danube River Basin, the extent of floodplains has been reduced to 68% of their pre-regulation extent (Hein et al., 2016). Overall, the number and intensity of floods in Eastern Europe has increased greatly since the 1980s, with a peak in 2000, and has remained mixed in the last decade (EM-DAT, 2017). Regular severe floods have been reported throughout the subregion including for Russia (EM-DAT, 2017). Russia has also been among the most affected countries in the period 1995-2014 in terms of deaths caused by extreme climatic events (Kreft et al., 2016). No clear trends in flood regulation have been reported for Central Asia. The overall number and intensity of floods in the subregion has increased slightly since the 1990s, but has remained stable over the past decade (EM-DAT, 2017). Severe floods have been reported almost annually (EMDAT, 2017). Global warming and sea level rise are projected to increase the occurrence and frequency of flood events in large parts of continental Europe (EEA, 2016b; European Commission, 2015c). In addition, coastal flooding is expected to increase especially on the Mediterranean coast (Buyck et al., 2015; European Commission, 2015c). People and their quality of life are increasingly exposed as the capacity to regulate and mitigate floods is likely to continue to decrease with current urbanization trends (Zedler & Kercher, 2005).
2.2.1.10 Regulation of detrimental processes: removal of animal carcasses Vertebrate scavengers in Europe and Central Asia are represented by old world vultures, which are obligate scavengers that depend totally on carrion, and facultative scavengers, i.e. mostly mammalian carnivores, suids, raptors and corvids, which exploit carrion opportunistically (Moleón et al., 2014). There are five vulture species in Europe and Central Asia: griffon (Gyps fulvus), Himalayan (G. himalayensis), cinereous (Aegypius monachus), Egyptian (Neophron percnopterus) and bearded vulture (Gypaetus barbatus). Vultures and particularly griffons (the most abundant species in the region) are especially efficient in locating and consuming carcasses (Morales-Reyes et al., 2017c; Sebastián-González et al., 2015) but, within Europe and Central Asia, their range is limited to the southern parts of Western, Central and Eastern Europe and Central Asia. Other raptors, particularly eagles (Aquila spp.) and
89
THE REGIONAL ASSESSMENT REPORT ON BIODIVERSITY AND ECOSYSTEM SERVICES FOR EUROPE AND CENTRAL ASIA
kites (Milvus spp.), together with corvids (mainly Corvus spp.) are also key scavengers in Europe and Central Asia. Among mammalian facultative scavengers, canids (e.g., wolves Canis lupus, jackals C. aureus, and foxes Vulpes spp. and Alopex lagopus), bears (Ursus arctos), wolverines (Gulo gulo), and wild boars (Sus scrofa) are important for scavenging (Mateo-Tomás et al., 2015). Empirical evidence suggests that scavenging networks that include obligate scavengers are more efficient in the removal of carrion, including wild animal and livestock carcasses (Moleón et al., 2014; Morales-Reyes et al., 2017c; Sebastián-González et al., 2015). In Europe and Central Asia, vertebrate scavengers remove an important fraction of the carrion biomass available (DeVault et al., 2003; DeVault et al., 2016; Mateo-Tomás et al., 2015), contribute to pest and disease regulation (Ogada et al., 2012) and nutrient cycling (Beasley et al., 2015; Wilson & Wolkovich, 2011). Indigenous and local knowledge holders also describe the role of vertebrate scavengers in providing this contribution from nature to people: “Even beasts are made by God and have a purpose, even the bad ones like wolves, they have their own role, they eat the corpses of dead animals, and they cleanse the landscape.” (Ivascu & Rakosy, 2017) (See supporting material Appendix 2.2)11. Most scientific evidence about the role of scavengers in carcass removal is from Western Europe, coinciding with the largest populations of vultures in this subregion (Margalida et al., 2010). For example, it has been estimated that the Spanish vulture population removes between 134 and 200 tonnes of bones and between 5,551 and 8,326 tonnes of carrion from the landscape every year (Margalida & Colomer, 2012). In addition, the artificial removal of extensive livestock carcasses in Spain imposed by sanitary European Union regulations (Margalida et al., 2010) meant the emission of over 77,000 tonnes of CO2 eq. to the atmosphere per year and the annual payment of about $50 million to insurance companies by farmers and administrations (Morales-Reyes et al., 2015). In the Massif Central (France) alone, up to 33.1 tonnes of CO2 per year could be saved if vultures were allowed to access livestock carcasses (Dupont et al., 2012). In Central Europe, particularly in Serbia, jackals annually remove more than 3,700 tonnes of animal remains (Ćirović et al., 2016).
2014b). In fact, avian scavengers are the most threatened functional group of birds in Europe and Central Asia (Sekercioglu et al., 2004). However, the trends of vulture populations vary across Europe and Central Asia (see Table 2.3, supporting material Appendix 2.412). In Western Europe, where the major strongholds of vultures exist, particularly in Spain (home to >90% of European vultures; Margalida et al., 2010), vultures have recovered over recent decades after strong declines since the 1950s (Donázar et al., 2016) due to reintroduction and conservation programmes (e.g. Eliotout et al., 2007; Xirouchakis, 2010). By contrast, the situation of vultures in Central Europe is critical, although different conservation programmes seek to recover their populations (e.g. Demerdzhiev et al., 2014; Grubač et al., 2014; Kirazli & Yamac, 2013). Available information for Eastern Europe and Central Asia is very scarce for obligate scavengers, while facultative scavengers overall exhibit an increasing trend in distribution range and population size across these subregions (Chapron et al., 2014; Table 2.3, supporting material Appendix 2.412). There are several drivers that can threaten the supply of this contribution from nature to people including the conflicting policies that might change the capacity of obligate and facultative scavengers to remove animal carcasses. For example, sanitary policies might restrict the access of scavengers to the carcasses of domestic and wild ungulates (Margalida et al., 2010; Margalida & Moleón, 2016). The implementation of sanitary regulations after the outbreak of bovine spongiform encephalopathy in the European Union (Donázar et al., 2009) had a negative impact on vulture conservation (Margalida & Colomer, 2012) and the functional role of facultative scavengers such as kites and wolves (Blanco, 2014; Lagos & Bárcena, 2015). Nevertheless, recent changes in the European Union sanitary regulation have largely improved this situation (Morales-Reyes et al., 2017b). In addition, the intensification in livestock raising and the decline of traditional farming practices may threaten the removal of carcasses by scavengers (Olea & Mateo-Tomás, 2009). Finally, farmers’ perceptions and their conflicting relations with facultative scavengers due to livestock predation can influence their tolerance towards these animals (Morales-Reyes et al., 2017a).
The population of obligate and facultative scavengers determines the capacity for carcasses removal. Vultures have suffered sharp declines in Europe and Central Asia due to intended and unintended poisoning (e.g. Mateo-Tomás et al., 2012), electric infrastructures such as wind farms and electric pylons (Carrete et al., 2009; Sánchez-Zapata et al., 2016) and, occasionally, veterinary drugs such as diclofenac (Green et al., 2016; Margalida et al., 2014a; Margalida et al.,
The removal of carcasses by scavengers contributes to different dimensions of people’s quality of life. The removal of scavengers may increase the incidence of infectious diseases (Ogada et al., 2012). In addition, supplanting the ecosystem service provided by scavengers in agroecosystems with artificial removal of livestock could raise greenhouse gas emissions, with important environmental and economic costs (see above and Morales-Reyes et al., 2015, 2017b). Vulture declines
11. Available at https://www.ipbes.net/sites/default/files/eca_ch_2_ appendix_2.2_ilk_content_of_ncp.pdf
12. Available at https://www.ipbes.net/sites/default/files/eca_ch_2_ appendix_2.4_avian_scavengers_trends.pdf
90
CHAPTER 2. NATURE’S CONTRIBUTIONS TO PEOPLE AND QUALITY OF LIFE
Conservation status
Current population trend
Gypaetus barbatus
Vulture
Obligate scavenger
NT
–
mixed
mixed
mixed
?
Griffon vulture
Gyps fulvus
Vulture
Obligate scavenger
LC
+
+
mixed
mixed
?
Himalayan vulture
Gyps himalayensis
Vulture
Obligate scavenger
NT
0
NA
NA
NA
?
Egyptian vulture
Neophron percnopterus
Vulture
Obligate scavenger
EN
–
mixed
mixed
mixed
?
Cinereous vulture
Aegypius monachus
Vulture
Obligate scavenger
NT
–
+
mixed
mixed
?
Golden eagle
Aquila chrysaetos
Apex predator
Facultative scavenger
LC
0
mixed
mixed
mixed
?
Spanish imperial eagle
Aquila adalberti
Apex predator
Facultative scavenger
VU
+
+
NA
NA
NA
Black kite
Milvus migrans
Generalists
Facultative scavenger
LC
?
mixed
mixed
mixed
?
Red kite
Milvus milvus
Generalists
Facultative scavenger
NT
–
mixed
mixed
mixed
NA
Common buzzard
Buteo buteo
Generalists
Facultative scavenger
LC
0
mixed
mixed
mixed
?
Western marsh harrier
Circus aeruginosus
Predator
Facultative scavenger
LC
+
mixed
mixed
mixed
?
Raven
Corvus corax
Corvids
Facultative scavenger
LC
+
mixed
mixed
mixed
?
Common magpie
Pica pica
Corvids
Facultative scavenger
LC
0
mixed
mixed
mixed
?
Carrion crow
Corvus corone
Corvids
Facultative scavenger
LC
+
mixed
mixed
mixed
?
Eurasian jay
Garrulus glandarius
Corvids
Facultative scavenger
LC
0
mixed
mixed
mixed
?
Yellow-legged gull
Larus michahellis
Seabirds
Facultative scavenger
LC
+
mixed
mixed
?
NA
Grey wolf
Canis lupus
Apex predator
Facultative scavenger
LC
0
+
+
–
?
Brown bear
Ursus arctos
Apex predator
Facultative scavenger
LC
0
+
+
–
?
Polar bear
Ursus maritimus
Apex predator
Facultative scavenger
VU
?
–
NA
–
NA
Wolverine
Gulo gulo
Generalists
Facultative scavenger
LC
–
+
NA
–
NA
Golden jackal
Canis aureus
Generalists
Facultative scavenger
LC
+
+
+
?
?
Red fox
Vulpes vulpes
Generalists
Facultative scavenger
LC
0
0
0
0
?
Arctic fox
Vulpes lagopus
Generalists
Facultative scavenger
LC
0
0
NA
0
NA
Stone marten
Martes foina
Generalists
Facultative scavenger
LC
0
0
0
0
?
Central Asia
Central Europe
Eastern Europe
Functional group
Bearded vulture
Western Europe
Scavenger group
Conservation status (according to IUCN Red List categories) and population trend of main scavenger species (species selection based on Mateo-Tomás et al., 2015) per subregion of Europe and Central Asia. Trends are reported as: increasing (+); decreasing (–); stable (0); fluctuating (F); heterogeneous trend within the subregion (mixed; see supporting material Appendix 2.412 for additional details of avian scavengers) or unknown (?). NA: data not available (i.e., there are no populations). Conservation status: EN: endangered; VU: vulnerable; NT: near threatened; LC: least concern. Source: Own representation based on Chapron et al. (2014); Deinet et al. (2013); Wilson et al. (2009); IUCN Red List of Threatened Species. Version 2017-1. www.iucnredlist.org; BirdLife International http://datazone.birdlife.org/info/euroredlist.
Scientific name
3
Common name
Table 2
91
Scavenger group
Functional group
Conservation status
Current population trend
Martes martes
Generalists
Facultative scavenger
LC
0
+
+
+
?
Common genet
Genetta genetta
Generalists
Facultative scavenger
LC
0
0
NA
NA
NA
Eurasian badger
Meles meles
Generalists
Facultative scavenger
LC
0
0
0
0
?
Asian Badger
Meles leucurus
Generalists
Facultative scavenger
LC
?
NA
NA
?
?
Egyptian mongoose
Herpestes ichneumon
Generalists
Facultative scavenger
LC
0
0
NA
NA
NA
Wild boar
Sus scrofa
Omnivore
Facultative scavenger
LC
?
+
+
+
?
also have a negative impact on the cultural identity of farmers and the value they derive from knowing that these species exist (Morales-Reyes et al., 2017a) (see Section 2.2.3.3).
2.2.2 Status and trends of nature’s material contributions to people 2.2.2.1 Food and feed 2.2.2.1.1 Food and feed from terrestrial ecosystems Agroecosystems, including croplands, grasslands and agroforestry systems, cover an important area of Europe and Central Asia, providing crops and animal-derived products that support the region’s food security (Section 2.3.1.1) and food culture (see Box 2.1 and Box 2.2). FAOSTAT provides extensive data on the quantity of this contribution delivered by nature to people. However, other terrestrial ecosystems, such as forests and scrublands, also provide food in the form of game, fruits and mushrooms, for which little quantification is available, but see Section 2.2.3.2. Comprehensive data on food quality has not been found, but the relationships between food production and the characteristics of diet and health are explored here and in Sections 2.3.1.1 and 2.3.2. Overall the agricultural area per capita has been decreasing in Europe and Central Asia since the 1960s, particularly in Western Europe, however, the cultivated area per worker in the agriculture sector has almost tripled in Europe and Central Asia since the 1980s (Table 2.4), a process that goes hand in hand with the mechanization and intensification of agriculture (Table 2.4, Section 4.5.2). Particularly, in the Mediterranean basin, quantity and quality of food delivered by agroecosystems is severely influenced
92
Central Asia
Central Europe
Eastern Europe
Scientific name
Pine marten
Western Europe
Common name
THE REGIONAL ASSESSMENT REPORT ON BIODIVERSITY AND ECOSYSTEM SERVICES FOR EUROPE AND CENTRAL ASIA
by rural abandonment of mountainous and less productive areas and land-use intensification of fertile areas (Caraveli, 2000) (Section 4.5.2). Food production from agriculture in Europe and Central Asia increased by 56% between the 1960s and the 1990s. It then suffered a decline of 33% until 2014. The three socio-political events that have most influenced these trends are: the dissolution of the USSR in 1989, affecting mostly Central Asia and Eastern Europe (Kraemer et al., 2015); the Yugoslav Wars from 1991 to 1999 disturbing mostly Central Europe; and the Common Agricultural Policy of the European Union and its reforms (particularly since the MacSharry reform in 1992), influencing trends in Western and Central Europe. The assessment of different agricultural products shows different trends across subregions. Cereals were mostly produced in Eastern Europe, where production has suffered fluctuations in recent decades (see Figure 2.19). Among cereals, however, maize is experiencing substantial growth (see Figure 2.20) because of its use for biofuel and feed production (see Sections 2.2.2.2 and 2.3.1.4). Fruit has been produced mostly in Western Europe, but Central Asia and Eastern Europe have been increasing their production in the past decade (see Figure 2.19). Countries in Eastern Europe are the largest producers of vegetables, which has been experiencing growth (from ca. 4.5 million tonnes in 1991 to more than 7 million tonnes in 2012), as rapidly as in Central Asia (from ca. 1 million tonnes in 1991 to more 3.5 tonnes in 2012) (see Figure 2.19). Important crops in Europe are those required for oil production (with increasing trends) and wine (with decreasing trend) (see Figure 2.19). Areas for organic agriculture in Western and Central Europe have been increasing since 2005 (in Western Europe from ca. 4% of the total agricultural area to more than 5%; in Central Europe from almost 1% to more than 4%) (see Figure 2.21) (FAO, 2017).
CHAPTER 2. NATURE’S CONTRIBUTIONS TO PEOPLE AND QUALITY OF LIFE
Table 2
4
CONTRIBUTION
CROPS
Historical trends of different indicators used to assess food provision as a contribution from nature to people. Red arrows indicate decreasing, yellow arrows indicate stable, green arrows indicate increasing and black arrows indicate mixed trends. Source: Own elaboration based on different data sources: FAOSTAT (2017); OECD (2017); World Bank (2017). INDICATOR
Western Europe
Central Europe
Eastern Europe
Central Asia
Europe and Central Asia
Agricultural area (hectares per capita) Cultivated area per agricultural population (hectares per capita) Agricultural tractors per 1000 hectares of agricultural area
Permanent crops (% of agricultural area)
Production of cereals per person (kg / person) Production of fruit per person - excluding melons (kg / person) Fertilizer consumption (kilograms per hectare of arable land) Intensity of total pesticides use (tons / hectare of cultivated area) Substance use for seed treatment - fungicides and insecticides (tons / hectare of cultivated superficie) Total actual renewable water resources withdrawn by agriculture (%) Conservation agriculture area (% of cultivated area)
Organic agricultural area (% of total agricultural area) Agricultural raw materials exports (% of merchandise exports in dollars) Agricultural raw materials imports (% of merchandise imports in dollars) Cereal production (% of world production) LIVESTOCK
Domestic mammals per rural inhabitant (except pack animals) Poultry animals per rural inhabitant
Pack animals per square km of agricultural area Combine harvesters - threshers per 1000 hectares of agricultural area Milking machines per head of cattle
Meadows and permanent pasture (% of agricultural area)
Production of meat per person (kg / person)
Meat production (% of world production)
The production of livestock primary production varies. Meat production increased between 1961 and 1990, when a sharp decline occurred in Eastern and Central Europe due to the dismantling of the Soviet Union (see Figure 2.22). However, since the early 2000s the trend changed in
Eastern Europe and it is currently producing almost half of the meat in the region. Egg production follows a similar pattern, except in Eastern Europe with an increasing trend since 1996. Milk production has been decreasing since the 1990s (largely due to the introduction by the Common
93
THE REGIONAL ASSESSMENT REPORT ON BIODIVERSITY AND ECOSYSTEM SERVICES FOR EUROPE AND CENTRAL ASIA
Figure 2 19
Historical trends for average country production (tonnes) in each subregion: crop primary production of cereals, fruit (excluding melons) and vegetable crops; and crops processed for olive oil virgin, rapeseed oil, sunflower oil and wine. Note that the vertical axes are on a different scale. Source: Own representation based on data from FAO (2017). CROP PRODUCTION (TONNES) Fruit (excluding melons) production
Cereal production 4,000,000
30,000,000
3,500,000
25,000,000
3,000,000 20,000,000
2,500,000 2,000,000
15,000,000
1,500,000
10,000,000
1,000,000 5,000,000
500,000
0
2011
2006
2001
1996
1991
1986
1981
1976
1971
1966
2011 2011
1961
2006 2006
2001
1996
1991
1986
1981
1976
1971
1966
1961
0
Vegetables primary production 8,000,000 7,000,000 6,000,000 5,000,000 4,000,000 3,000,000 2,000,000 1,000,000
2001
1996
1991
1986
1981
1976
1971
1966
1961
0
CROPS PROCESSED (TONNES) Olive oil virgin
Rapeseed oil
350,000
450,000
300,000
400,000 350,000
250,000
300,000
200,000
250,000
150,000
200,000 150,000
100,000
Sunflower oil
2013
2009
2005
2001
1997
1993
1989
1985
1987
1977
1973
1969
1961
2013
2009
2005
2001
1997
1993
1989
1985
1987
1977
1973
1969
1965
0 1961
50,000
0
1965
100,000
50,000
Wine
1,400,000
2,500,000
1,200,000
2,000,000
1,000,000 800,000
1,500,000
600,000
1,000,000
400,000 500,000
200,000 0
WESTERN EUROPE
94
CENTRAL EUROPE
EASTERN EUROPE
CENTRAL ASIA
2011
2006
2001
1996
1991
1986
1981
1976
1971
1966
1961
2011
2006
2001
1996
1991
1986
1981
1976
1971
1966
1961
0
CHAPTER 2. NATURE’S CONTRIBUTIONS TO PEOPLE AND QUALITY OF LIFE
Figure 2 20
Historical trends for average country production (tonnes) of maize in each subregion. Source: Own representation based on data from FAO (2017).
7,000,000
6,000,000
5,000,000
4,000,000
3,000,000
2,000,000
1,000,000
WESTERN EUROPE
Figure 2 21
CENTRAL EUROPE
EASTERN EUROPE
2013
2009
2005
2001
1997
1993
1989
1985
1981
1977
1973
1969
1965
1961
0
CENTRAL ASIA
Historical trends of organic agriculture area (% of total agricultural area) in each subregion. Source: Own representation based on data from FAO (2017).
7
6
5
4
3
2
1
0 2004
2005
WESTERN EUROPE
2006
2007
CENTRAL EUROPE
2008
2009
EASTERN EUROPE
Agricultural Policy of the European Union of milk quotas), except in Central Asia. The countries with the largest production in the region in 2013 were Russia and Ukraine for eggs, Russia and Germany for meat, and Germany and Russia for milk. The production of livestock feed in EU-28 has experienced a sharp increase of more than 50% over the past three decades, consistent with the intra-regional trade balance of increasing import of ingredients of these feeding compounds such as soybeans, and with the above-mentioned intensification of livestock farming in the European Union.
2010
2011
2012
2013
2014
2015
CENTRAL ASIA
Cattle represent the largest share of livestock animals in Europe and Central Asia (see Figure 2.23). In Central Asia, sheep account for about 25% and goats for about 6% of livestock production. In Central Europe, pigs represent the second largest share (25% in 2013), but this has been decreasing since the early 2000s. Chicken account for almost 20% in Eastern Europe, with rapid increases in recent decades. Overall, the trend in the past decade is an increase in chicken production, maintenance of cattle production, and reduction of pigs, goats and sheep (Figure 2.23).
95
THE REGIONAL ASSESSMENT REPORT ON BIODIVERSITY AND ECOSYSTEM SERVICES FOR EUROPE AND CENTRAL ASIA
Figure 2 22
Historical trends for average country production of livestock primary production (tonnes) of eggs, meat and milk in the four subregions and total industrial compound feed in the EU-28. Source: Own representation based on data from FAO (2017) and FEFAC (2017).
LIVESTOCK PRIMARY PRODUCTION (TONNES) Eggs primary production
Meat primary production
1,000,000
3,500,000
900,000
3,000,000
800,000 2,500,000
700,000 600,000
2,000,000
500,000 1,500,000
400,000 300,000
1,000,000
200,000 500,000
100,000
20,000,000 18,000,000 16,000,000 14,000,000 12,000,000 10,000,000 8,000,000 6,000,000 4,000,000 2,000,000
WESTERN EUROPE
1996
1991
1986
1981
1976
1971
1966
1961
0
CENTRAL EUROPE
EASTERN EUROPE
CENTRAL ASIA
TOTAL INDUSTRIAL COMPOUND FEED PRODUCTION EU-28 (x1,000 TONNES) 160,000 150,000 140,000 130,000 120,000 110,000
96
2015
2013
2011
2009
2007
2005
2003
2001
1997
1999
1995
1993
1991
1989
100,000
2011
2006
2001
1996
1991
1986
1981
1971
Milk primary production
1976
2011 2011
1966
2006 2006
1961
2001 2001
1996
1991
1986
1981
1976
1966
1971
0 1961
0
CHAPTER 2. NATURE’S CONTRIBUTIONS TO PEOPLE AND QUALITY OF LIFE
Forests provide nuts, mushrooms, herbs, spices, aromatic plants and game that have been used not only as food, but also for health and cultural purposes for millennia. Yet a recent report by the Food and Agriculture Organization of
Figure 2 23
the United Nations acknowledges that there is a tendency to underestimate their role because they are poorly represented in international statistics, as in most cases their use and trade are confined to the informal sector (Sorrenti,
Historical trends in the share of total livestock represented by cattle, pigs, chicken, goats and sheep in the subregions. Source: Own representation based on data from FAO (2017). SHARE IN TOTAL LIVESTOCK (% OF TOTAL LIVESTOCK UNITS (LSU))
2005
2009
2013
2005
2013
2001 2001
2009
1993
1997
1993
1985
1997
Chickens
1989
1987
2013
1973
0 1977
0
1961
5
2009
10
2001
10
2005
20
1997
15
1989
30
1993
20
1987
40
1985
25
1973
50
1977
30
1969
60
1961
35
1965
70
1965
Pigs
1969
Cattle
Goats
20
8
18
7
16 6 14 12
5
10
4
8
3
6 2
1985
1989
1987
1973
1977
1965
1969
2009
2013
2001
2005
1997
1989
1993
1987
1985
1977
1973
1969
0 1961
1
0 1965
2
1961
4
Sheep WESTERN EUROPE
35
CENTRAL EUROPE
30
EASTERN EUROPE
25
CENTRAL ASIA 20 15 10 5
2009
2013
2001
2005
1997
1989
1993
1987
1985
1977
1973
1969
1961
1965
0
97
THE REGIONAL ASSESSMENT REPORT ON BIODIVERSITY AND ECOSYSTEM SERVICES FOR EUROPE AND CENTRAL ASIA
2017). However, recent studies show that non-timber forest products still form the basis of livelihoods and play a significant role in food, nutrition and as a source of income, particularly in times of deep economic crisis (e.g. Elbakidze et al., 2007).
2.2.2.1.2 Wild capture and cultured aquatic food production Fishing has a long, rich tradition in Europe and Central Asia (Ståhlberg & Svanberg, 2011), and is still an important source of protein for indigenous people (Demeter, 2017). Across Europe and Central Asia, aquatic ecosystems make an important contribution to people’s diets, directly as food and as feed for livestock. The largest contribution of aquatic ecosystems is wild-captured seafood, especially from the highly productive North East Atlantic. Seafood production from this area is 8.9 million tonnes per year (production data from 2014, if not otherwise stated). Wild capture of seafood from the Mediterranean and Black Sea area (restricted to Europe and Central Asian fleets) is much smaller (0.5 million tonnes per year), even when taking the smaller size of this area into account. This is largely due to lower nutrient concentrations in the Mediterranean. In relation to primary production, fisheries are similarly productive in the Mediterranean and Black Sea as, e.g., in the North Sea (Libralato et al., 2008). A decline in production since the turn of the millennium (see Figure 2.24) is due to a transition
Figure 2 24
to more sustainable management practices, after a phase of overexploitation where catch limits larger than those scientifically advised were regularly set (Carpenter et al., 2016; Hilborn & Ovando, 2014). Reported production of wild capture food from inland waters in Europe and Central Asia is dominated by freshwater (67%) and diadromous (31%) fisheries. Compared with marine production, wild capture food from inland waters is relatively small at 0.4 million tonnes per year, but it plays an important role especially in Eastern Europe and Central Asia, which are dominated by commercial fisheries (Aps et al., 2004). Data prior to 1988 are insufficient for a regional assessment, but, as Figure 2.25 shows, production of wild capture food from inland waters in Europe and Central Asia fell from 1988 to 2005, but since then has grown slightly. The decline in production in Eastern Europe since 1988 until the turn of the millennium (Figure 2.25) has been attributed to the serious depletion of many open access freshwater fishery resources caused by overfishing and “insufficient control and enforcement (illegal and unreported catches do not appear in statistics)” (Aps et al., 2004). Contrasting the situation for wild-capture fisheries, production from aquaculture has continuously increased since 1950, with the exception of a brief phase of contraction in Eastern Europe after the socioeconomic transformations around 1990 (see Figure 2.26). According
Marine wild-capture seafood production in seas surrounding Europe and Central Asia. Colouring indicates contributions from the North East Atlantic Ocean (FAO Area 27, violet) and Mediterranean and Black Sea (FAO Area 37, grey). Source: Own representation based on data from FAO (2017).
15
10
5
YEAR
98
2010
2000
1990
1980
1970
1960
0 1950
PRODUCTION (MILLIONS OF TONNES PER YEAR)
MARINE WILD CAPTURE SEAFOOD
CHAPTER 2. NATURE’S CONTRIBUTIONS TO PEOPLE AND QUALITY OF LIFE
Figure 2 25
Inland wild capture production of aquatic food in Europe and Central Asia. Colouring indicates contributions from Central Asia (violet), Eastern Europe (orange), northern parts of Central Europe (green), southern parts of Central Europe (white), and Western Europe (grey). Source: Own representation based on data from FAO (2017).
0.6
0.4
0.2
2015
2010
2005
2000
1995
0 1990
PRODUCTION (MILLIONS OF TONNES PER YEAR)
INLAND WILD CAPTURE AQUATIC FOOD 0.8
YEAR
Figure 2 26
Aquaculture production in Europe and Central Asia. Colouring indicates contributions from Central Asia (violet), Eastern Europe (orange), northern parts of Central Europe (green) and southern parts of Central Europe (white), and Western Europe (grey). Source: Own representation based on data from FAO (2017).
3
2.5
2
1.5
1
0.5
2010
2000
1990
1980
1970
1960
0 1950
PRODUCTION (MILLIONS OF TONNES PER YEAR)
MARINE AND FRESHWATER AQUACULTURE
YEAR
99
THE REGIONAL ASSESSMENT REPORT ON BIODIVERSITY AND ECOSYSTEM SERVICES FOR EUROPE AND CENTRAL ASIA
2.2.2.2.1 Woodfuel
to these data, production has grown at an average rate of 2.7% per year since 2000 and by 2014 reached 3.0 million tonnes per year. Salmon farming in northern parts of Western and Central Europe made an important contribution to this expansion. Overall, diadromous fish now contribute around 63% to total aquaculture production, followed by molluscs (21%), freshwater fish (10%) and marine (6%) fish. Despite this continuous rise in aquaculture production, Europe and Central Asia lags behind the global rate, where the proportion of aquaculture fish production now contributes 40% of production (FAO, 2014a). This indicates the potential for significant further expansion in Europe and Central Asia. However, as with wild-capture fisheries, aquaculture can have adverse environmental effects that might offset its benefits (Read & Fernandes, 2003).
Woodfuel (including logs, charcoal, chips, bark, and sawdust) has a high energy density (comparative average values in MJ/kg - woodfuel: 16; charcoal: 28; coal: 30; natural gas: 37 and fuel oil: 4) (IEA, 2004). Its availability, accessibility and renewability make it attractive, especially in rural areas. According to statistics from the Food and Agriculture Organization of the United Nations, overall woodfuel production and consumption has been largely stable since 2000 (see Figure 2.27). Within Western Europe, woodfuel use is significant especially in Scandinavia. It is unclear whether the comparatively low woodfuel production in Central Asia according to statistics from the Food and Agriculture Organization of the United Nations (see Figure 2.27) (between 2000-2013 it varied between 190,000 and 1,000,000 m3 p.a.) is due only to biogeographic and climatic differences, or also due to underreporting.
2.2.2.2 Energy Driven by the European Union’s legally binding targets in the Renewable Energy Directive (RED - 2009/28/EC), production of renewable energy within the EU-28 almost doubled between 2004 and 2013. Based on Eurostat, in 2013, total biomass (woodfuel and other biomass including municipal waste) accounted for 65% of the gross inland energy consumption of renewables in the
Various forms of biomass can serve as fuel including plants, animal dung, and agricultural residues. Plant matter is used directly or in processed forms such as charcoal and oil. Two forms of biomass-based energy are particularly relevant in Europe and Central Asia and therefore the focus of the following sections: woodfuel and biofuels.
Figure 2 27
Woodfuel production in Europe and Central Asia between 2000 and 2013. Source: Own representation based on data from FAO (2017).
160,000,000
140,000,000
PRODUCTION (M³)
120,000,000
100,000,000
80,000,000
60,000,000
40,000,000
20,000,000
WESTERN EUROPE
100
CENTRAL EUROPE
EASTERN EUROPE
CENTRAL ASIA
2013
2012
2011
2010
2009
2008
2007
2006
2005
2004
2003
2002
2001
2000
0
CHAPTER 2. NATURE’S CONTRIBUTIONS TO PEOPLE AND QUALITY OF LIFE
EU-28, of which wood and wood wastes contributed the highest share with 45%. Around 23% of the EU28’s total roundwood production of 425 million m3 in 2014 was used as woodfuel (Eurostat, 2017). Among the European Union member States, Sweden produced the most roundwood (70 million m3) in 2014, followed by Finland, Germany and France (each producing between 52 and 57 million m3). More than half of roundwood produced is used as fuel in Denmark, France and Cyprus (2013 and 2014), while Bulgaria, Croatia, Hungary and Lithuania reported proportions between 32 and 46%. However, direct woodfuel use by households is not included in these numbers, which is why they are likely to be underestimates.
Figure 2 28
In the European Union, woody biomass accounts for almost 50% of renewable energy consumption (Pelkonen et al., 2014). In some widely forested countries, large proportions of total energy consumption originate from forest biomass, for example 30% in Sweden (Hansen & Malmaeus, 2016) and 25% in Finland (Jäppinen & Heliölä, 2015). Due to a long-standing tradition of forestry and forest management in Western and Central Europe, deforestation driven by woodfuel and other wood product extraction is not currently a threat for the region (UNEP & UNECE, 2016). On the other hand, dependence on woody biomass as a source of domestic energy continues to be prominent especially in rural and economically disadvantaged communities in Europe and Central Asia. In Central Asian countries such as Tajikistan,
Biofuel production by regions in Europe and Central Asia from 2000 to 2014. Trade balance of biofuels by regions in Europe and Central Asia from 2000 to 2014. Source: Own representation based on U.S. Energy Information Administration (2017). A
B
A 2,000 1,800
PRODUCTION [TJ]
1,600 1,400 1,200 1,000 800 600 400 200
2007
2008
2009
2010
2011
2012
2013
2014
2007
2008
2009
2010
2011
2012
2013
2014
2004 2004
2006
2003 2003
2006
2002 2002
2005
2001 2001
2005
2000 2000
0
B 100
TRADE BALANCE[TJ]
0 -100 -200 -300 -400 -500 -600 -700 -800
WESTERN EUROPE
CENTRAL EUROPE
EASTERN EUROPE
CENTRAL ASIA
101
THE REGIONAL ASSESSMENT REPORT ON BIODIVERSITY AND ECOSYSTEM SERVICES FOR EUROPE AND CENTRAL ASIA
deforestation continues and overuse of forests for fuel is one of the main reasons for land degradation (Mustaeva et al., 2015). In the Balkans and the South Caucasus, wood remains an important affordable energy source (Adeishvili, 2015). In Albania, for instance, firewood meets onethird or more of the total energy demand for heating and accounts for almost 90% of wood use (Markus-Johansson et al., 2010). In certain areas of Europe and Central Asia, restraining economic conditions lead to considerable illegal woodfuel harvesting. In Turkey, for example, off-the-record logging for woodfuel (estimated 4,300,000 m3) reached more than half the permissible woodfuel harvests (7,000,000 m3) in 2010 (Pak et al., 2010). In the Ukraine, the economic
Figure 2 29
A
recession and the gas crisis caused by the RussianUkrainian conflict is reported to have significantly increased firewood thefts (Roué & Molnar, 2017). Woody biomass demand from countries with ample forest resources such as Sweden and Finland is foreseen to increase (Jonsson, 2013) and generally in Western, Central and Eastern Europe the shift towards a carbon neutral society is expected to further boost the demand for woodfuel (Bostedt et al., 2016). This intensification of biomass removals from forests may have trade-offs in forest productivity, biodiversity and soil quality (Bouget et al., 2012; Verkerk et al., 2014).
A and C Biodiesel and ethanol production in selected countries in Europe and Central Asia from 2015 to 2025. B and D Trade balances of biodiesel and ethanol in selected countries in Europe and Central Asia from 2015 to 2025. Source: Own representation based on OECD-FAO (2016).
B
14,000
500
2025
2024
2023
2022
2020
2021
2019
2020
C
2018
-2,000
2025
2024
2023
2022
2021
2020
2019
2018
2017
2016
2015
0
-1,500
2019
2,000
-1,000
2017
4,000
-500
2018
6,000
0
2015
8,000
2016
10,000
ETHANOL TRADE BALANCE [MILL. L]
ETHANOL PRODUCTION [MILL. L]
12,000
D 14,000
100
BIODIESEL TRADE BALANCE [MILL. L]
10,000
8,000
6,000
4,000
2,000
-100
-200
-300
-400
RUSSIAN FEDERATION
KAZAKHSTAN
NORWAY
UKRAINE
TURKEY
SWITZERLAND
ISRAEL
2025
2024
2023
2022
2021
2017
2025
2024
2023
2022
2021
2020
2019
2018
2017
2016
2015 EUROPEAN UNION-28
2016
-500
0
102
0
2015
BIODIESEL PRODUCTION [MILL. L]
12,000
CHAPTER 2. NATURE’S CONTRIBUTIONS TO PEOPLE AND QUALITY OF LIFE
Historically, woodfuel collection is among the earliest uses of forests by humans (Pelkonen et al., 2014). Local ecological knowledge related to forest management is just as rooted in Europe and Central Asia as woodfuel utilization. An example from the communities inhabiting the lowland landscapes of Transcarpathian region Zakarpats’ka oblast’ in western Ukraine points to a tradition of accessing firewood as dry wood and during forest logging (Roué & Molnar, 2017). The locals state the need for young forest stands in addition to old, diverse structured forests: “For firewood we went only here, on the Lapos. That was the closest, and there was thin, dry wood, which could be broken by hand.” (ibid) (See supporting material Appendix 2.213).
2.2.2.2.2 Provision of biofuels The term “biofuel” generally refers to liquid transportation fuels made from biomass materials, such as ethanol and biodiesel. Biofuel production rose by a factor of ten between 2000 and 2014 in Western Europe (Figure 2.28). Simultaneously, imports increased both in Central and Western Europe, but the import dependence was much higher in Central Europe. Central Asia and Eastern Europe had only a negligible share (Figure 2.28). In terms of energy content, current annual production of biofuel (Figure 2.28) remains small compared to that of woodfuel (140,000,000 m3 correspond to 1,000,000 – 2,400,000 tJ energy). 13. Available at https://www.ipbes.net/sites/default/files/eca_ch_2_ appendix_2.2_ilk_content_of_ncp.pdf
Figure 2 30
An outlook for Europe and Central Asia shows a slight increase in ethanol production until 2020, which is expected to become stable by 2025 (Figure 2.29). For biodiesel, production is expected to peak by 2019 and to decline until 2025. The EU-28 as major producer is equally a major consumer with a strongly negative trade balance for both ethanol and biodiesel production. It is expected to roughly equalize until 2025. Only for Kazakhstan, a continuously negative trade balance for ethanol is expected. However, impacts of the production of energy crops on the environment and on other contributions from nature to people limit their use (Meyer & Leckert, 2017). Major concerns exist concerning the potential of GHG emission offset, regulation of soil quality, water quality and quantity, biodiversity, and indirect land-use change that displaces ecological impacts outside of the biofuel production region (Efroymson et al., 2013; McBride et al., 2011). These trade-offs could be considered in policy by implementing, for instance, stricter rules for biofuel certification that consider the environmental and social impacts within and beyond the feedstock production region (Meyer et al., 2016). In the future, agricultural residues, as one example of second-generation biofuel feedstocks, can also contribute substantially to energy production. Studies for the European Union consider that around 25 to 60% of agricultural residues could be available for this purpose (Bentsen & Felby, 2012).
Annual production of roundwood in Europe and Central Asia, 1961–2014 in cubic metres. Source: FAO (2017).
850,000,000
800,000,000
700,000,000
650,000,000
600,000,000
550,000,000
500,000,000
450,000,000
2011
2001
1991
1981
1971
400,000,000 1961
PRODUCTION (M³)
750,000,000
103
THE REGIONAL ASSESSMENT REPORT ON BIODIVERSITY AND ECOSYSTEM SERVICES FOR EUROPE AND CENTRAL ASIA
Figure 2 31
Annual roundwood removal in Western, Central and Eastern Europe (for Eastern Europe only data for the Russian Federation is available) in 1,000 m3. Source: Own representation based on Eurostat (2017).
400,000 350,000 300,000 250,000 200,000 150,000 100,000 50,000
WESTERN EUROPE
Figure 2 32
CENTRAL EUROPE
2014
2013
2012
2011
2010
2009
2008
2007
2006
2005
0
EASTERN EUROPE
Density of timber stock (all uses) in European Union (EU) countries. Source: European Commission (2011). N
0
250
500 km
TIMBER STANDING STOCK m3/ha
NO DATA
104
1 — 13
14 — 25
26 — 43
44 — 72
73 — 214
NON EU COUNTRIES
CHAPTER 2. NATURE’S CONTRIBUTIONS TO PEOPLE AND QUALITY OF LIFE
2.2.2.3 Materials and assistance
masking marked technological, economic and political transformations of the cotton industry (Kandiyoti, 2007).
Nature contributes to people’s quality of life by providing materials for construction, clothing, ornamental purposes, or assistance for herding, guidance and guarding (IPBES, 2017a). For most of these materials, comprehensive national or sub-national level data do not exist, with the exception of wood. Here, we present the status and trends of this contribution from nature to people in Europe and Central Asia associated with the provision of wood, cotton, and other vegetal materials, materials from marine systems and the assistance of dogs in guarding and protecting livestock.
Reed has traditionally been used in many regions for thatching, but it can be also be utilized in a number of other ways, including in construction and gardening, in paper, textile and plastic production, and as fodder and fertilizer (Köbbing et al., 2013). Reed is grown and harvested throughout the subregions (Köbbing et al., 2013). Mediterranean countries of Europe play an important role in the provision of cork, as they produce 87% of cork globally, especially the Iberian Peninsula, which is home to the majority of cork oak (Quercus suber) forests in the world (Acácio & Holmgren, 2014; APCOR, 2011) and, therefore, also cork extraction (Figure 2.34). About 70% of harvested cork is used for the production of bottle stoppers. Other products include flooring, insulation material, clothes and accessories, and decorative objects (Bugalho et al., 2011).
2.2.2.3.1 Provision of wood Roundwood is defined as all wood removed with or without bark, including wood removed in its round form or in other forms (FAO, 2015a). Roundwood can be subdivided into industrial roundwood, used mainly for construction and in processed timber products, and woodfuel (see Section 2.2.2.2.1). Total production of roundwood has remained stable in Europe and Central Asia (FAO, 2015a), with a major impact by the fall of the iron curtain (Figure 2.30) and a slight decline for the period 2005-2014 in Western Europe (Figure 2.31). Timber standing stock, regardless of use or degree of management, are largest in some regions of Western and Central Europe: forests of Central Europe, Scandinavia and the Alps (Figure 2.32).
Rosins are solid forms of resins obtained from pine trees and some other conifers. They are extracted by tapping the tree (Mitchell et al., 2016). Historically used to waterproof ships, they are now used in the production of chemicals, paints, inks, varnishes, floor coverings and soaps. Sources of rosins in Europe and Central Asia are Pinus pinaster (Portugal), P. sylvestris (former Soviet Union), P. halepensis (Greece) and P. brutia (Turkey) (FAO, 1995). Only a few countries in Europe and Central Asia produce turpentine and resin, with decreasing trends due to the high costs of labour. Portugal accounts for the majority of world trade in gum turpentine, but production fell from an average of 110,000 tonnes per year during 1978-1987 to 30,000 tonnes by 1992 (FAO, 1995). Minor production is
2.2.2.3.2 Cotton and other vegetal materials During the period 1961-2014 cotton lint was mostly produced in Central Asia and Turkey. Production in Central Asia has fluctuated without a clear trend (Figure 2.33),
Figure 2 33
Annual production of cotton lint in Central Asia, 1992–2014, in tonnes. Source: FAO (2017).
2,200,000
2,000,000
1,600,000
1,400,000
1,200,000
2012
2007
2002
1997
1,000,000 1992
TONNES
1,800,000
CENTRAL ASIA
105
THE REGIONAL ASSESSMENT REPORT ON BIODIVERSITY AND ECOSYSTEM SERVICES FOR EUROPE AND CENTRAL ASIA
Cork oak distribution and production in the western Mediterranean. Source: APCOR (2009).
Figure 2 34
WORLD CORK OAK SURFACE (ha)
4%
WORLD CORK YEARLY PRODUCTION (tonnes)
1% 4% 2%
4% 5%
4% 33%
6%
15%
52%
30% 18% 22%
PORTUGAL
SPAIN
ALGERIA
MOROCCO
FRANCE
also reported in Central and Eastern Europe (FAO, 1995). Recently, new uses of pine resin in polymers have emerged (Wilbon et al., 2013).
TUNISIA
ITALY
600,000 tonnes per year in France14; however, due to their very slow growth, maerl beds have declined throughout the North East Atlantic and are classified as vulnerable on the European Union Red List (Gubbay et al., 2016a).
2.2.2.3.3 Materials from marine ecosystems Marine ecosystems provide a wide range of materials for different uses, including algae maerl, seaweed fishmeal, fish oil (used in textile production, metallurgy, production of detergents, paints and resins), shellfish and molluscs for ornamental purposes (Murillas-Maza et al., 2011). Seaweed and kelp species are used in various ways in Western Europe (Figure 2.35). Kelp is now particularly used for extraction of alginates, which are used in the food processing industry, as well as in the production of textiles and pharmaceuticals (Netalgae, 2012; Smale et al., 2013). France and Norway are the main producers of kelp in Western Europe with annual production of about 50,000 tonnes of Laminaria digitata in France and about 200,000 tonnes of L. hyperborea in Norway (Smale et al., 2013). In Western Europe, production of macroalgae has decreased in the last 10 years (Bioforsk, 2012). Maerl is a collective term for various species of non-jointed coralline red algae (family Corallinophycidae) that live unattached to the seabed. Maerl has been dredged in the European Union for use as an agricultural soil conditioner and for use in animal and human food additives, water filtration systems, and pharmaceutical and cosmetic products. By the 1970s extraction peaked with about
106
2.2.2.3.4 Assistance of livestock protection and guard dogs For centuries guard dogs have helped shepherds protect their livestock from predators, specifically brown bears (Ursus arctos) and wolves (Canis lupus), in Central Europe and Central Asia (Gehring et al., 2010; Linnell & Lescureux, 2015). With the decimation of these predators in Western Europe and the collectivization of agricultural policy under communist regimes, much of the indigenous and local knowledge about the use of guard dogs was lost (Gehring et al., 2010; Linnell & Lescureux, 2015). However, with the recent recovery of large carnivores in continental Europe (Chapron et al., 2014), guard dog use is being suggested as a means of facilitating human-carnivore coexistence (Linnell & Lescureux, 2015). Indeed, more than 1,000 dogs are now used in the Alps for this purpose (Gehring et al., 2010). Indigenous peoples and local communities value them, as a herder explains: “No, the beasts are no real problem for us, we have our dogs and sticks, we are not afraid of wolves and bears” (herder; Ivascu & Rakosy, 2017) (see supporting material Appendix 2.215). Guard dogs in Europe and Central Asia hold substantial 14. http://forum.eionet.europa.eu/european-red-list-habitats/ 15. Available at https://www.ipbes.net/sites/default/files/eca_ch_2_ appendix_2.2_ilk_content_of_ncp.pdf
CHAPTER 2. NATURE’S CONTRIBUTIONS TO PEOPLE AND QUALITY OF LIFE
Figure 2 35
Main uses of macroalgae in Europe. Source: Netalagae (2012).
SPECIES
USES
Alaria esculenta
AGRICULTURAL SUPPLIES
Ascophyllum nodosum
SEAWEED VEGETABLE
Asparagopsis armata
HEALTH AND WELL-BEING
Chondrus crispus
FOOD PROCESSING, CHEMISTRY
Codium sp. Corallina officinalis Delesseria sanguinea Dilsea carnosa Fucus ssp. Gelidium corneum Gelidium sesquipedale Gigartina pistillata Gracilaria spp. Himanthalia elongata Laminaria digitata Laminaria hyperborea Laminaria ochroleuca Laurencia pinnatifida Mastocarpus stellatus Palmaria palmata Pelvetia canaliculata Porphyra umbilicalis Saccharina latissima Ulva sp. Undaria pinnatifida
identity value among shepherds and breeds are closely linked to specific areas (Figure 2.36) (Linnell & Lescureux, 2015).
2.2.2.4 Provision of medicinal resources The value of biodiversity as a resource for the production of medicines is one of the clearest examples of the relationships between nature and human health. Numerous species of plants, animals and fungi have been used to produce traditional therapies since ancient times, and wild flora and fauna continue to support the development of modern pharmaceutical products. This section considers medicinal plants in Europe and Central Asia, which form part of traditional and local medicinal practices, as well as medicinal plant products, which are sold commercially, and their use in modern pharmaceutical development. It covers plants, which are harvested directly from the wild, as well as those that are grown in home gardens or cultivated commercially. For the assessment of this contribution
from nature to people, in addition to the literature review undertaken in this chapter (supporting material Appendix 2.116), we also conducted an expert17 elicitation on the basis of several key messages. The original key messages and the results of the expert elicitation are provided in supporting material Appendix 2.518. Nature’s capacity to provide medicinal plant resources depends on the species richness of medicinal plants. Several areas in Europe and Central Asia are characterized by high medicinal plant species richness, including the 16. Available at https://www.ipbes.net/sites/default/files/eca_ch_2_ appendix_2.1_protocol_of_the_systematic_review_used_for_ chapter_2_of_the_eca_assessment.pdf 17. Eighteen experts from the different biodiversity and health networks (such as the Belgian Community of Practice Biodiversity & Health (COPBH) and its international connections, Co-operation on Health and Biodiversity (COHAB), ESP thematic working group on health, Network for Evaluation of One Health (NEOH) and contact authors of publications found in the literature review conducted for this contribution from nature to people). 18. Available at https://www.ipbes.net/sites/default/files/eca_ch_2_ appendix_2.5_medicinal_plants.pdf
107
THE REGIONAL ASSESSMENT REPORT ON BIODIVERSITY AND ECOSYSTEM SERVICES FOR EUROPE AND CENTRAL ASIA
Figure 2 36
Breeds of guard dogs identified in Europe and Central Asia. Source: Linnell & Lescureux (2015).
Figure 2 37
Species richness of selected medicinal plants in the European Union. Source: Allen et al. (2014). NUMBER OF SPECIES
Source: IUCN European Medicinal Plant Assessment
per 865 km2 hexagon 0 1 — 37
A
B
38 — 74 75 — 111 112 — 147 148 — 184 185 — 221 222 — 258
Inset B
Inset A
Mediterranean region, the Alps and the Pyrenees, the Massif Central in France, the Balkan Peninsula, the Crimean Peninsula and the Carpathian Mountains (Figure 2.37) (Allen et al., 2014). However, some of these medicinal plants are threatened due to unsustainable patterns of exploitation (Allen et al., 2014). Land development and land use change are the next greatest threats, with residential and commercial development and agricultural practices also having important impacts. In Central Asia, intensified
108
agricultural practices, loss of indigenous knowledge, and climate change have also been identified as significant threats to medicinal plant diversity (e.g. Bocharnikov et al., 2012; Breckle & Wucherer, 2006; Haslinger et al., 2007) (see supporting material Appendix 2.519). Consequently, collection of plants from the wild and loss of habitat due to 19. Available at https://www.ipbes.net/sites/default/files/eca_ch_2_ appendix_2.5_medicinal_plants.pdf
CHAPTER 2. NATURE’S CONTRIBUTIONS TO PEOPLE AND QUALITY OF LIFE
physical development and land use change are the most significant threats affecting medicinal plants in the region. Indigenous and local knowledge plays an essential role in creating greater understanding of the potential contributions of many plant species to human health. The importance of biodiversity-derived medicines has been widely noted, with a significant number of commercially available pharmaceutical products being derived from compounds identified in biodiversity (e.g. Bernstein, 2015). The World Health Organization estimates that 70-80% of the global population depend on some form of indigenous and local medicinal knowledge for their primary health care (Ekor, 2014). In addition, indigenous and local knowledge has been a source of interest and inspiration for modern drug development for several decades (see also Section 2.2.3.4); at the same time, various ethical issues associated with bioprospecting and biopiracy have been raised. These issues appear to be less significant in Europe (Efferth et al., 2016) (supporting material Appendix 2.519). Despite the importance of indigenous and local knowledge, there is a rapid rate of decline of traditional medical knowledge in Europe and Central Asia. In our fast-changing environment, especially related to increasing urbanization and changing agricultural practices, many traditions are disappearing from rural areas, with a profound loss of indigenous and local knowledge, particularly among the younger generations (see Section 2.2.3.1). This decline has been highlighted by several scientific studies (e.g. Quave et al., 2012; Sánchez-Mata et al., 2016). In some regions of Western and Central Europe, direct links have been identified between disappearing traditional farming systems and the decline in biodiversity of medicinal plants. On the other hand, there has been renewed interest in preserving traditional forms of knowledge about medicinal plants in the face of societal change and globalization as a form of cultural heritage (Pardo-de-Santayana et al., 2010). Recent decades have also seen an increase in the use of medicinal plants as complementary, non-conventional or alternative forms of medicine (Barata et al., 2016; Roberti di Sarsina, 2007). Reasons cited for this increased attention have included public desire for affordable health remedies, and a perception that “natural” products are somehow safer and more effective than mainstream medicines. These factors have stimulated a rapid expansion of commercial markets for these remedies (FAO, 2005; Leonti & Verpoorte, 2017). The commercialization of traditional medicines and medicinal indigenous and local knowledge has seen many of these remedies moving from traditional practices to health and other markets. Migrant populations moving into Europe and Central Asia from other regions have also brought their own traditional knowledge and related medicinal practices with them.
Evidence suggests that these communities rely largely on plants and plant products imported from their home countries rather than alternatives that occur naturally in their new home regions (Pieroni et al., 2013; Quave et al., 2012) (supporting material Appendix 2.519). This raises a number of further issues for conservation and public health, including those related to the collection, importation, sale and use of plants across borders outside of normal regulatory frameworks. While it appears that migrants prefer medicinal plants and related products imported from their home regions to local native alternatives, increasing demand may see alternative plant species being sought in migrants’ new home environments, presenting a further challenge for the sustainable exploitation of living resources. Therefore, because of increasing migration into Europe and Central Asia from other regions, there is an urgent need to increase the understanding of traditional medicinal practices within national public health care systems. In addition to their potential role in supporting public health, traditional medicines may provide other social and economic benefits. Research in Tajikistan and Afghanistan has indicated that the use of medicinal plant species contributed significantly to local health sovereignty and security (see Section 2.3.2), which was particularly important during a period of social and political instability (Kassam et al., 2010). From a public health perspective, it appears important to ensure that traditional medicinal practices, which do not use marketed products but instead rely directly on harvested plants, are recorded and assessed, and to engage with practitioners to explore and communicate on issues of safety and efficacy.
2.2.3 Status and trends of nature’s non-material contributions to people 2.2.3.1 Learning and knowledge generation 2.2.3.1.1 Formal learning and knowledge generation Nature benefits people by contributing to learning processes that inspire people and allow them to acquire knowledge and to develop skills. These benefits can occur through formal institutions, informal learning and at all levels of education (Angelstam et al., 2013; Anić et al., 2012; Mocior & Kruse, 2016). There are contrasting trends across these benefits. Formal learning linked to nature has increased recently, partly as a result of new learning and knowledge development processes linked to sustainable environmental management. Informal learning that draws on nature has also expanded due to the increases in recreation
109
THE REGIONAL ASSESSMENT REPORT ON BIODIVERSITY AND ECOSYSTEM SERVICES FOR EUROPE AND CENTRAL ASIA
and tourism (see Section 2.2.3.2), especially in protected areas promoting education and learning (Angelstam et al., 2013; Smrekar et al., 2016; Zedler, 2017). Some informal forms of learning and knowledge generation based on nature are in decline, particularly linguistic diversity which has traditionally been shaped by biodiversity and features of the natural environment (Section 2.1.1.1.2 Gorenflo et al., 2012; Maffi, 2005). The interactions between language and nature mean that a decline in linguistic diversity will be accompanied by a reduction in the variety of ways people communicate about aspects of nature and biodiversity (Harmon & Loh, 2010). Formal learning in outdoor spaces has grown as national education systems have expanded. Formal learning provides additional benefits for learners and teachers in terms of cognitive outcomes, critical thinking, inspiration, observation skills and engagement with nature (Bizikova et al., 2012; Mocior & Kruse, 2016; Schlegel et al., 2015). Adults who have learned about sustainable development at school, or informally through activities such as gardening, may perceive their living space in a manner that is conducive to more sustainable lifestyles (Bendt et al., 2013; Breuste & Artmann, 2015; Fridl et al., 2009). People using natural environments for recreational experiences also learn from each other. For example, a survey of 1,300 marine divers and recreational anglers in the UK showed that the sharing of knowledge and experience with others was a valued cultural ecosystem service (Jobstvogt et al., 2014). Learning benefits linked to inspiration from nature were also found in a survey of 291 people in Turkey (Fletcher et al., 2014). In Spain a survey of 1,400 people revealed that environmental education was a preferred ecosystem service for a large proportion of respondents and environmental education was viewed as a more important cultural ecosystem service than aesthetic values and recreational hunting (Martin-Lopez et al., 2012). Also in Spain, a survey of 198 beneficiaries of the largest park in Barcelona found that environmental learning was a perceived benefit of the park of low monetary value, but of high non-monetary value (Langemeyer et al., 2015).
2.2.3.1.2 Indigenous and local knowledge Local ecological knowledge has been increasingly documented in Western, Central and Eastern Europe, particularly around its role in sustainable management of nature’s contributions to people, its contribution to ecosystem restoration and its role in building socialecological resilience (Carvalho & Frazão-Moreira, 2011; Hernández-Morcillo et al., 2014; Molnár et al., 2016). Overall, local ecological knowledge in Western, Central and Eastern Europe has eroded in recent decades, something acknowledged in the scientific literature as well as by the indigenous and local knowledge holders (see supporting
110
material Appendix 2.220). Significant losses of indigenous and local knowledge were found in Western Europe in agrobiodiversity management (Iniesta-Arandia et al., 2014; Kizos et al., 2013; Reyes-García et al., 2015), in forest management (Johann, 2007; Rotherham, 2007), and in pastoralist systems (Fernández-Giménez & Fillat Estaque, 2012; Oteros-Rozas et al., 2013b). Evidence of erosion of indigenous and local knowledge was also found in Central Europe, associated with agrobiodiversity management (Šmid Hribar & Urbanc, 2016), pastoralism (Lozej, 2013; Otčenášek, 2013) and medicinal plants and wild food plants (Łuczaj et al., 2012; Pardo-de-Santayana et al., 2010; Pieroni et al., 2013). However, some research has found stable patterns in indigenous and local knowledge associated with wild food plants and mushrooms in Central Europe (Łuczaj et al., 2015; Pieroni et al., 2013). In Eastern Europe, a decline in indigenous and local knowledge has been found in wood-pastures (Varga & Molnár, 2014), pastoralist systems (Kikvidze & Tevzadze, 2015; Lavrillier et al., 2016), and the indigenous and local knowledge associated with wild food (Łuczaj et al., 2013). The erosion of indigenous and local knowledge also involves the loss of linguistic diversity as indigenous and local languages represent the reservoirs of considerable knowledge about non-human species and their relationships with the environment (Nabhan, 2001). The endangerment level of indigenous and local languages in Europe and Central Asia is critical (see Figure 2.38). While a large number of these languages are extinct21 (12% of total languages) or critically endangered22 (11%), 14% still remain alive as most children speak the language (vulnerable category). The level of endangerment varies across subregions (see Figure 2.38). While Central Asia has no languages under the categories of extinct and critically endangered, 31% and 24% of languages in Eastern Europe and Central Europe, respectively, are classified as extinct or critically endangered. Despite this level of threat, it is noticeable that the trends of the Index of Linguistic Diversity for indigenous languages in Eurasia between 1970 and 2005 is rather stable (with a slight decline from 1990) (see Figure 2.39) because Western and Central Europe might have lost the majority of its linguistic diversity prior to 1970 (Harmon & Loh, 2010). The general loss of indigenous and local knowledge is mainly attributed to the transition from an agriculturallybased and subsistence-oriented economy to a marketoriented economy (Carvalho & Morales, 2010; HernándezMorcillo et al., 2014; Pardo-de-Santayana et al., 2010). Changes in culture that affect shared beliefs, meanings 20. Available at https://www.ipbes.net/sites/default/files/eca_ch_2_ appendix_2.2_ilk_content_of_ncp.pdf 21. Extinct: There are not speakers 22. Critically endangered: The youngest speakers are grandparents and older, and they speak the language partially and infrequently
CHAPTER 2. NATURE’S CONTRIBUTIONS TO PEOPLE AND QUALITY OF LIFE
and practices regarding plants and animals or other contributions from nature to people, are also responsible for the lack of value associated with indigenous and local knowledge among younger generations, which consider these traditional practices and knowledge as symbols of poverty or backwardness (Christanell et al., 2010; Hernández-Morcillo et al., 2014; Pardo-de-Santayana et al., 2010). Gender relations are of special interest in Western Europe, where women and men have had differentiated roles in preserving indigenous and local knowledge (Pardode-Santayana et al., 2010; Reyes-García et al., 2010). Demographic changes, such as ageing of indigenous and local knowledge holders, rural abandonment and outmigration of women and younger generations from rural areas, have also led to a marked decline in generational transmission of indigenous and local knowledge (FernándezGiménez & Fillat Estaque, 2012; Molnár, 2014; OterosRozas et al., 2013b). These factors are also acknowledged by indigenous and local knowledge holders as powerful
Some governmental policies can also support the maintenance of indigenous and local knowledge. For example, the Common Agricultural Policy reform legislation offers support for “high nature value” farming, which is characterized by long-established, low-intensity and holistic farming systems highly adapted to local environmental conditions (Keenleyside et al., 2014). In this sense, high natural value farming is not only essential if the European Union is to meet its 2020 biodiversity targets, but also to counteract the decline in indigenous and local knowledge. There is a proven gap in documentation of indigenous and local knowledge in Central Asia and therefore more studies are needed on how traditional practices and indigenous and local knowledge associated with nature could bring important insights into biocultural diversity conservation in
Level of endangerment of languages in Europe and Central Asia A and level of endangerment by subregion B Source: Own representation based on Moseley (2010); UNESCO (n.d.). Overseas territories in other regions are not included.
Figure 2 38
A
drivers of erosion of their knowledge (see also supporting material Appendix 2.220).
12%
14%
EXTINCT CRITICALLY ENDANGERED SEVERELY ENDANGERED 11%
DEFINITELY ENDANGERED VULNERABLE
34%
29%
B Central Asia (n=15)
Eastern Europe (n=159)
Central Europe (n=45)
Western Europe (n=109) 0%
10%
20%
30%
40%
50%
60%
70%
80%
90%
100%
PERCENTAGE OF LANGUAGES BY LEVEL OF ENDANGERMENT
111
THE REGIONAL ASSESSMENT REPORT ON BIODIVERSITY AND ECOSYSTEM SERVICES FOR EUROPE AND CENTRAL ASIA
Figure 2 39
Trends of the Index of Linguistic Diversity (ILD) in Eurasia regions of the world B Source: Harmon & Loh (2010).
A
A
and in the different
ILD EURASIA INDIGENOUS 1970–2005
1.2
1.0
0.8
0.6
0.4
0.2
0.0 1970
1975
1980
B
1985
1990
1995
2000
2005
1995
2000
2005
ILD REGIONAL INDIGENOUS 1970–2005
1.2
1.0
0.8
0.6
0.4
0.2
0.0 1970
EURASIA
1975
AFRICA
1980
1985
PACIFIC (INCLUDING AUSTRALIA AND PAPUA NEW GUINEA)
the subregion (Pawera et al., 2016). In addition, although there is some evidence about the role of indigenous and local knowledge in marine systems (Maynou et al., 2011; Moore, 2003), more research is needed to report on the status and trends of this knowledge in that context.
2.2.3.2 Physical and psychological experiences 2.2.3.2.1 Recreational experiences Nature in Europe and Central Asia provides opportunities for recreation such as hiking, trekking, climbing, running, mountain biking, horseback riding, camping, picnicking, sailing, boating, swimming, snorkeling or diving, skiing and green care, as well as activities related to species, such
112
1990
AMERICAS
as wildlife-watching, particularly birdwatching. Nature also provides opportunities to perform extractive recreational activities, such as hunting, fishing and angling, mushroom gathering, berry and fruit picking (Bell et al., 2007; Schulp et al., 2014a; Seeland & Staniszewski, 2007). Thirtyeight per cent of the European Union is characterized by high outdoor recreation potential (Paracchini et al., 2014), particularly coastal and freshwater systems and broadleaved woodlands (Hornigold et al., 2016). Recreation is a well-recognized contribution from nature to people in broadleaved forests of Western and Central Europe (e.g. Grilli et al., 2015; Mavsar et al., 2013; Sténs et al., 2016). In freshwater ecosystems, recreation is more common in rivers with clear water and high flows than rivers with mud, algae and litter (Eder & Arnberger, 2016; Vesterinen et al., 2010). Marine and coastal systems also provide the basis for recreational activities, such as recreational
CHAPTER 2. NATURE’S CONTRIBUTIONS TO PEOPLE AND QUALITY OF LIFE
fishing, birdwatching, whale-watching, swimming, diving and snorkeling or other water sports (Ahtiainen et al., 2013; Beaumont et al., 2007). In the last decades, the capacity for nature-based recreation in the aforementioned ecosystems has decreased because of land-use change (e.g. Liquete et al., 2016b; Pietilä & Fagerholm, 2016; Roberge et al., 2016).
1999; Kabisch et al., 2016), such as sense of peacefulness and tranquility (Chiesura, 2004) or hiking and walking (Baró et al., 2016; Smrekar et al., 2016). While an overall increase in urban green spaces was identified in Western Europe from 2000 to 2006, most of the cities of Central and Eastern Europe experienced a decline in the same period (Kabisch & Haase, 2013). The recreational experience in urban green spaces depends on different elements, such as the presence of forests
Green spaces in urban areas provide multiple physical and psychological experiences (Bolund & Hunhammar,
Figure 2 40
Demand for nature-based recreation in the European Union.
70
60
50
40
30
20
10
OTHER NATURE-RELATED
Figure 2 41
2016
2015
2014
2013
2012
2011
2010
2009
2008
0
2007
PERCENTAGE OF PEOPLE (%) WITH NATURE AS MAIN REASON FOR GOING ON HOLIDAYS
Trends of percentage of people in the European Union with nature (i.e. ecosystems or landscapes) and other related-nature (beach and sport-related activities, e.g. scuba-diving, cycling, etc.) motivations as the main reasons for going on holiday. Source: Own representation based on European Commission (2016b).
NATURE
Distribution of recreational options in Europe and Central Asia: Temporal trends of the forest surface managed or designated for recreational purposes in the four subregions. Source: Own representation based on http://www.fao.org/forestresources-assessment/en/.
% OF FOREST AREA DESIGNATED OR MANAGED FOR PUBLIC RECREATION
10
8
6
4
2
0 1990
WESTERN EUROPE
2000
CENTRAL EUROPE
2005
EASTERN EUROPE (RUSSIA)
2010
2015
CENTRAL ASIA
113
THE REGIONAL ASSESSMENT REPORT ON BIODIVERSITY AND ECOSYSTEM SERVICES FOR EUROPE AND CENTRAL ASIA
and wetlands or riparian systems (Baró et al., 2016) or high species richness (Fuller et al., 2007). Urban gardens are increasingly recognized among these elements in Western and Central Europe (Bell, 2016; Breuste & Artmann, 2015; Camps-Calvet et al., 2015).
richness of game species is reported in Central Europe, southern Scandinavia and the Baltic countries, while for edible mushroom and plant species it is the forested and mountainous areas of Western Europe (Figure 2.42) (Schulp et al., 2014a).
Nature-based recreation is in high demand in Europe and Central Asia (e.g. Agbenyega et al., 2009; García-Llorente et al., 2012; Sténs et al., 2016). For example, 31% of people surveyed in the European Union gave nature as their main reason for going on holiday. Other reasons were nature related, such as beach and sport-related activities (e.g. cycling, boating or diving), which were mentioned by 51% of people surveyed in the European Union (European Commission, 2016a). In the last decade, nature as the main reason for holidays has increased in the European Union (Figure 2.40). Participation in nature-based recreation is not equally distributed between countries due to differences in the number of protected areas (Table 2.5), forest areas designated for recreational purposes (Figure 2.41), or accessibility to natural areas (Bell et al., 2007).
Hunters as a percentage of the European Union population in 2010 varied between 0.17% (Netherlands) and 12.4% (Italy) (Schulp et al., 2014a). In Central Asia, the flourishing of sport hunting (Kronenberg, 2014) and the presence of body parts of particular animals (e.g. snow leopard (Uncia uncia), Asiatic Bear (Ursus arctos isabellinus)) in markets suggest both legal and illegal hunting (Cunha, 1997; Haslinger et al., 2007). Recreational fishing is a growing phenomenon in Western Europe (Toivonen et al., 2004). Collection of mushrooms, truffles, berries, fruits and edible nuts is more prevalent in Western Europe than Central Europe and Eastern Europe (Figure 2.43) (MCPFE et al., 2007). However, the diversity of wild plants collected has suffered a decline in recent decades in Western and Central Europe (Łuczaj et al., 2012; ReyesGarcía et al., 2015; Rzadkowski & Kalinowski, 2013). This decline coincides with urbanization and loss of natural habitats, rural abandonment, cultural change, the erosion of indigenous and local knowledge, and industrialization of food production (Łuczaj et al., 2012; Reyes-García et al., 2015). By contrast, some uses of wild edible plants are preserved due to a revival of traditions linked with “traditional” cuisine (Reyes-García et al., 2015; Schulp, et al., 2014b).
Nature’s capacity to provide extractive outdoor experiences relies on a variety of species. In the European Union, 97 species are hunted, while 152 species and 12 genera of mushrooms and 592 edible plant species are reported as being collected (Schulp et al., 2014b). However, this estimation is incomplete because studies in Turkey showed that at least 2,000 species of mushrooms are edible (Çağlarirmak, 2011; Kizmaz, 2003). The highest
Figure 2 42
A
114
Species richness of the 38 common game species in the European Union A , 27 common edible mushroom species in the European Union B , and 81 common wild food vascular plant species in the European Union C . Source: Schulp et al. (2014b). B
C
1–4
1–4
< 12
33 – 36
5–8
5–8
13 – 16
> 36
9 – 12
9 – 12
17 – 20
0
13 – 16
13 – 16
21 – 24
> 16
> 16
25 – 28
0
0
29 – 32
CHAPTER 2. NATURE’S CONTRIBUTIONS TO PEOPLE AND QUALITY OF LIFE
Figure 2 43
Distribution of the amount and market value of A mushrooms and B berries, fruits and edible nuts picked in forests in Western, Central and Eastern Europe. Source: Own representation based on MCPFE et al. (2007). B
350,000
160,000
300,000
140,000 120,000
250,000
100,000 200,000 80,000 150,000
60,000
100,000
40,000
50,000
20,000
0
0 Western Europe
Central Europe
300,000
Eastern Europe
350,000 300,000
250,000
250,000 200,000 200,000 150,000 150,000 100,000
100,000
50,000
50,000
0
0 Western Europe
Central Europe
Eastern Europe
MUSHROOMS AND TRUFFLES (TONNES)
FRUITS, BERRIES AND EDIBLE NUTS (TONNES)
MUSHROOMS AND TRUFFLES (1,000€)
FRUITS, BERRIES AND EDIBLE NUTS (1,000€)
2.2.3.2.2 Aesthetic experiences Nature is a source of aesthetic experiences for people in Europe and Central Asia (e.g. Daniel, 2001; Kaplan & Kaplan, 1989; Ode et al., 2009; Schirpke et al., 2013). Aesthetic enjoyment is dependent on perceived naturalness (e.g. Arriaza, 2004; Van den Berg & Koole, 2006), landscape heterogeneity (e.g. Dramstad et al., 2006; Frank et al., 2013; Schirpke et al., 2013; Sevenant & Antrop, 2009), and high levels of biodiversity (e.g. Casalegno et al., 2013; Lindemann-Matthies et al., 2010; Tribot et al., 2016). People in Western and Central Europe prefer natural areas with verdant vegetation over arid landscapes and urban landscapes (García-Llorente et al., 2012; Sevenant & Antrop, 2009). Landscape configurations like open forests (Gundersen & Frivold, 2008; Hansen & Malmaeus, 2016) or wood-pastures are most preferred among verdant natural areas (e.g. Plieninger et al., 2015; Surová et al., 2013; Van Zanten et al., 2014). However, mosaic landscapes were considered to have higher aesthetic value than landscapes dominated by forest in Western and Central Europe (e.g. García-Llorente et al., 2012; Howley, 2011; Howley et al., 2012; Schirpke et al., 2013). Mountains and coastal systems also provide aesthetic enjoyment, expressed by high numbers of related geotagged photographs (Oteros-Rozas et al., in press; Van Zanten et al., 2016). Water features also contribute to aesthetic pleasure (e.g. Kaltenborn & Bjerke, 2002; Tveit et al., 2006; Van Zanten et al., 2016). The capacity of landscapes to provide aesthetic experience has declined because of urbanization, land-
MARKET VALUE (1,000€)
180,000
WILD FRUITS (TONNES)
400,000
MARKET VALUE (1,000€)
MUSHROOMS AND TRUFFLES (TONNES)
A
use intensification, rural abandonment, disappearance of common lands and water pollution (see Chapter 4) (Šmid Hribar et al., 2015; Hunziker et al., 2008; Ruskule et al., 2013).
2.2.3.3 Supporting identities Individuals derive a good quality of life from knowing of the mere existence of particular species, ecosystems or a landscapes, independent of their actual use (Krutilla, 1967; Reyers et al., 2012), but also from their sense of place, cultural heritage, and from spiritual experiences. In contrast to physical and experiential values (see Section 2.2.3.2), this contribution from nature to people relates to virtues and principles (Chan et al., 2012).
2.2.3.3.1 Protected areas Protected areas indicate where societies have expressed their will to protect species and ecosystems. Protected areas can take many forms, as distinguished by (IUCN, 2017). Some categories of protected areas contain core zones, where natural dynamics can take place and which are largely inaccessible to the public. These categories are: “Ia Strict Nature Reserve”, “Ib Wilderness Area”, “II National Park” and “IV Habitat/species management area”. The status of these protected areas in Europe and Central Asia, as reported in the World Database on Protected Areas (UNEP-WCMC & IUCN, 2016), was used as an indicator for “supporting identities” (see Figure 2.44 and Table 2.5). Globally, there has been an increase in protected areas
115
THE REGIONAL ASSESSMENT REPORT ON BIODIVERSITY AND ECOSYSTEM SERVICES FOR EUROPE AND CENTRAL ASIA
Figure 2 44
Terrestrial and marine protected areas in Europe and Central Asia. The map displays strong protection categories (Ia, Ib, II and IV). Source: World Database on Protected Areas (UNEP-WCMC & IUCN, 2016).
N
IUCN CATEGORY 0
Table 2
5
Ia
II
Countries of Europe and Central Asia
Ib
IV
Countries outside Europe and Central Asia
1,250
2,500
5,000 km
Proportion of protected areas in Europe and Central Asia. The table displays strong protection categories (Ia, Ib, II and IV) in the four subregions. Source: World Database on Protected Areas (UNEP-WCMC & IUCN, 2016).
Region
Ia Strict nature reserve [% of land area]
Ib Wilderness area [% of land area]
II National Park [% of land area]
IV Habitat/species management area [% of land area]
Total area (in km2) of categories Ia, Ib, II and IV
Central Europe
0.00
0.27
0.87
0.93
92,284
Western Europe
0.48
2.70
3.16
1.60
1,077,634
Eastern Europe
1.91
0.00
1.02
5.20
6,930,197
Central Asia
0.68
0.00
0.65
1.04
196,475
(all IUCN categories) from about 8% in 1990 to 14.7% in 2016 (UNEP-WCMC & IUCN, 2016). It should be noted that motivations to establish a protected area differ, so the chosen indicator does not necessarily reflect particularly important species and ecosystems (Joppa & Pfaff, 2009).
2.2.3.3.2 Emblematic, symbolic or iconic species or ecosystems An existence value can be attributed to emblematic, symbolic or iconic species or ecosystems that are particularly appreciated for their existence, independent of their actual use for recreation (e.g., bird watching, game viewing). Certain so-called “flagship species” have drawn wide public interest (Barua, 2011). Many of these species’ habitats occur outside Europe and Central Asia,
116
for example the tiger (Panthera tigris), gorilla (Gorilla gorilla), giant panda (Ailuropoda melanoleuca), orangutan (Pongo abelii), as well as elephants and seahorses (Barua, 2011). The contribution from nature to people in these cases is not provided by ecosystems in Europe and Central Asia, but is valued by people within the region. There is currently a knowledge gap on how iconic and emblematic species that are native to Europe and Central Asia are perceived across the region. The wolf (Canis lupus), brown bear (Ursus arctos), wolverine (Gulo gulo), lynx (Lynx lynx) and wisent (Bison bonasus) have been framed as “Europe’s big five” in collaboration with conservation experts (IUCN, 2014). A global meta-analysis found that species in forest and marine inland waters are particularly highly valued. Of these species, the moose (Alces alces) and the humpback whale (Megaptera novaeangliae) (Martín-López et al., 2008)
CHAPTER 2. NATURE’S CONTRIBUTIONS TO PEOPLE AND QUALITY OF LIFE
occur in Europe and Central Asia. Furthermore, there is country-specific evidence of people assigning particular existence values to species. For instance, people in Sweden value large carnivores, irrespective of having the possibility to view them (Karlsson & Sjöström, 2008). In Spain, the imperial eagle (Aquila adalberti) and the Iberian lynx (Lynx pardinus) were among the species for which people showed the highest preference and willingness-to-pay for their conservation (Martín-López et al., 2007). In the UK, White et al. (2001) found high conservation interest for the otter (Lutra lutra), measured through high willingness-to-pay for their conservation. Preferences for the existence of species, such as willingness-to-pay for marine biodiversity, can differ across the region (Ressurreição et al., 2012). Willingnessto-pay for conservation has also been shown to be more strongly influenced by certain marine iconic species that are actively experienced (seals, octopus, birds) than by species that do not directly have a use value (i.e. are only protected for their existence) (Jobstvogt, 2014).
2.2.3.3.4 Spiritual experiences Ecosystems have traditionally served as areas for spiritual or religious rituals and experiences derived from nature (Groot et al., 2005). Natural areas of special spiritual significance include areas recognized as sacred by indigenous and traditional peoples as well as by institutionalized religions or faiths as places for worship and remembrance (Verschuuren et al., 2010). Sacred or holy natural places occur at a variety of scales in Europe and Central Asia, varying from rock formations or forest patches to mountains and islands. Supporting material Appendix 2.624 shows a selected list of natural areas considered as “sacred natural sites” based on IUCN’s Task Force on Cultural and Spiritual Values of Protected Areas (Wild & McLeod, 2008) and the Delos Initiative (Mallarch & Papayannis, 2012). Five sites on this list are located in Central Europe, three in Eastern Europe, 17 in Western Europe and one in Central Asia. The importance of these sites and other natural areas of spiritual and cultural significance to the quality of life in Europe and Central Asia is elaborated on in Section 2.3.3.
2.2.3.3.3 Attitudes towards nature Another indication of this contribution from nature to people is attitudes towards nature conservation. In the EU-28, 76% of the people totally agree with the statement “We have a responsibility to look after nature”. This percentage differs regionally, ranging from 65% in Italy to 94% in Cyprus and Sweden (European Commission, 2015a). See also supporting material Appendix 2.223 with quotes recognizing a decreasing trend of appreciation of nature by young holders of indigenous and local knowledge. 23. Available at https://www.ipbes.net/sites/default/files/eca_ch_2_ appendix_2.2_ilk_content_of_ncp.pdf
Table 2
6
2.2.3.4 Maintenance of options The desire to maintain potential options or benefits provided by nature for future generations is an expression of how people value inter-generational justice (see Section 2.3.4). The capacity of supply of this contribution from nature to people is indicated by overall patterns in species-level biodiversity (see Table 2.6, Section 3.2.3). One measure of the unique contribution to this contribution is given by total number of endemic species, which is low for Europe and 24. Available at https://www.ipbes.net/sites/default/files/eca_ch_2_ appendix_2.6_list_of_sacred_natural_sites.pdf
Numbers of classified, endemic and threatened species as proxy for the status of the maintenance of options of nature’s contributions to people in Europe and Central Asia relative to the other three IPBES regions (the Americas, Asia and the Pacific, and Africa). Source: Brooks et al. (2016), data for taxonomic groups that have been comprehensively assessed using IUCN red list criteria. Total global number of assessed species, over all these assessed groups, = 32,790. Total number of these assessed species that are threatened = 6,539. Europe and Central Asia
Number of assessed species, over all assessed groups, that are found in nominated IPBES region
Average value over the other 3 IPBES regions
2,487
11,840
Number of those species endemic to the region
332
9,681
Number of assessed species that are threatened and are found in nominated region
302
2,251
83
2,036
Number of those threatened species that are endemic to the region
117
THE REGIONAL ASSESSMENT REPORT ON BIODIVERSITY AND ECOSYSTEM SERVICES FOR EUROPE AND CENTRAL ASIA
Figure 2 45
Status of protection of phylogenetic diversity shown on the phylogenetic trees for birds and mammals. Tree diagrams on the left show current protection levels, and tree diagrams on the right use colours to show potential conservation gains for a 5 per cent increase in protected areas. For each branch of each tree, degree of protection is defined as the percentage of the total branch occurrences that is protected (percentage of “range protected”). Source: Pollock et al. (2017). Reprinted by permission from Macmillan Publishers Ltd. EXPAND PROTECTED AREAS 5%
CURRENTLY PROTECTED LOCAL
GLOBAL
BIRDS
100
35% 27%
PHYLOGENETIC
11% 0
MAMMALS
100
35%
28%
9% 0
RANGE PROTECTED
50%
Central Asia relatively to Africa, Asia and Pacific and America regions (see Table 2.6). Phylogenetic diversity (Faith, 1992) over multiple taxonomic groups is also an informative metric of the capacity of biodiversity to deliver maintenance of options (Faith, 2016) (also see Chapter 3). An assessment of the phylogenetic diversity of birds and mammals (see Figure 2.45) (Pollock et al., 2017) identified many high priority areas, such as in southern Croatia, the Odessa region of Ukraine, and north-western Kazakhstan, for their better conservation. The maintenance of options from biodiversity in Europe and Central Asia (and from outside the region) can be assessed through the valuation of genetic diversity by pharmaceutical companies (see Section 2.2.2.4). After a period of reduced interest there is a shift back towards natural products, supported by improved methods to explore species’ DNA to search for useful compounds (Piper, 2017). The appreciation for this contribution from nature to people is also found in the greater awareness of recent unanticipated benefits from biodiversity. The State of the World’s Plants (Willis, 2017) provides examples of benefits from genetic variation. For example, the ash tree (Fraxinus excelsior) is
118
suffering dieback across northern parts of Western Europe from a fungus; however, whole genome sequencing has helped characterize the genetic diversity, so that resistant individuals can be identified. Medicines derived from medicinal plants (see Section 2.2.2.4) and from marine organisms also raise awareness of biodiversity option values. However, benefits of this contribution from nature to people also may include other products. For example, it has been found that honeycomb moth caterpillars can eat through plastic (Bombelli et al., 2017). The caterpillars are beewaxeating pests, but enzymes from the caterpillars provide an un-expected global benefit. Another example is the recent published role of golden jackals (C. aureus), long regarded as a pest, as a remover of domestic animal carcasses, which is saving about two million euros in those countries west of Black Sea with estimated jackal population size >100 individuals –i.e. Bosnia and Herzegovina, Bulgaria, Croatia, Greece, Hungary, Romania and Serbia- (Ćirović et al., 2016). The appreciation and value of this contribution from nature to people can also be estimated through the ongoing
CHAPTER 2. NATURE’S CONTRIBUTIONS TO PEOPLE AND QUALITY OF LIFE
reporting of surprising discoveries in the popular press. For example, the golden jackals’ example was widely communicated through a New Scientist article25. Such examples can reinforce people’s relational value, linking biodiversity to future generations’ quality of life (Faith, 2016). The Millennium Ecosystem Assessment (2005) concluded that “the value individuals place on keeping biodiversity for future generations— the option value— can be significant”. Recently, a consortium of IUCN and global conservation NGOs argued for the value of biodiversity in maintaining options, providing many examples of past surprising benefits from biodiversity (Gascon et al., 2015).
2.2.4 Interregional flows of nature’s contributions to people: dependency of Europe and Central Asia on ecosystems of other regions 2.2.4.1 Introduction: interregional flows of nature’s contributions to people Nature’s contributions to people being used in Europe and Central Asia are provided by ecosystems both within and 25. https://www.newscientist.com/article/2090451-invasive-trash-eatingjackals-save-europe-e2-million-a-year/
Figure 2 46
outside the region. Through interregional flows of nature’s contributions to people, i.e. the active or passive transport of energy, matter or information, differences between the provision and actual consumption of ecosystem services can be balanced (Liu et al., 2016). Flows of nature’s contributions to people happen both between subregions of Europe and Central Asia, and between the region and other parts of the world. Interregional flows of nature’s contributions to people involve telecoupling, i.e. socioeconomic and environmental interactions over distances (Liu et al., 2016), and have several consequences. Ecosystem service use in one location can have impacts on ecosystems in other locations, such as degradation and connected loss of biodiversity (Mayer et al., 2005). For example, deforestation embodied in final consumption of the EU-27 equated to 732,000 ha (2004). In other words, 10% of the world’s annual deforestation (7,290,000 ha per year) was the result of consumption by the EU-27 (see Figure 2.46) (European Commission, 2013). Furthermore, interregional flows can have effects on quality of life, such as distributional equity, as discussed in the context of land grabbing (see Section 2.3.1.1) (Rulli et al., 2013). On the other hand, interregional flows of nature’s material contributions to people can lead to overall lower costs of food (Schmitz et al., 2012). Additionally, access to goods from outside the region through trade contributes to food security (see Section 2.3.1.1) as well as supporting livelihoods in the producing country.
Consumption of nature’s contributions to people associated with global deforestation allocated by sector for the EU-27 (2004). Brazil, Argentina, Paraguay, Indonesia and Malaysia, among others, have been identified as important sources of embodied deforestation. Source: European Commission (2013b).
Other sectors, 176 kha, 24% Leather products, 22 kha, 3% Construction, 23 kha, 3% Vegetables, fruit, nuts, 37 kha, 5% Meat products nec, 38 kha, 5% Beverages and tobacco, 43 kha, 6% Vegetable oils and fat, 48 kha, 7% PubAdmin/Defence/Health/Educat, 49 kha, 7% Trade, 76 kha, 10% Meat: cattle, sheep, goats, horse, 93 kha, 13% Food products nec, 128 kha, 17%
119
THE REGIONAL ASSESSMENT REPORT ON BIODIVERSITY AND ECOSYSTEM SERVICES FOR EUROPE AND CENTRAL ASIA
Figure 2 47
Difference between biocapacity and ecological footprint (consumption) in global hectares per person for Europe and Central Asia (ECA). A positive value (green) indicates a biocapacity reserve; a negative value (red) indicates a deficit. A deficit derives from the overuse of local renewable resources or the net import of renewable resources for consumption. Countries shaded in green have high biocapacity, so they have a reserve despite having a higher ecological footprint than many other countries. Source: Own representation based on Global Footprint Network (2017).
0
1,000 2,000
4,000 km
DIFFERENCE BETWEEN BIOCAPACITY AND ECOLOGICAL FOOTPRINT OF CONSUMPTION FOR EUROPE AND CENTRAL ASIA (ECA) GLOBAL HECTARES PER PERSON
–11.5
–9.2
–6.9
–4.6
–2.4
–0.1
2.2
4.4
6.6
2.2.4.2 Ecological footprint Ecological footprint is a composite indicator for use of nature’s contributions to people (Borucke et al., 2013; Kitzes & Wackernagel, 2009) that quantifies the area needed to provide certain material or regulating contributions and expresses consumption in an area in terms of the area needed to renewably provide those contributions (Kitzes & Wackernagel, 2009). Ecological footprint includes proxies for nature’s contributions to people such as crops, grazing land, fish, timber, and carbon sequestration (Borucke et al., 2013). Biocapacity is another proxy for ecosystem productivity. Specifically, biocapacity refers to the capacity of a certain area to generate an ongoing supply of renewable resources and thus is a proxy for ecosystem productivity. Data on the ecological footprint of consumption and on biocapacity (in global hectares per person) are available for most of the countries within Europe and Central Asia (missing: Andorra, Iceland, Liechtenstein, Monaco, San Marino). For Europe and Central Asia in 2013, the ecological footprint (consumption) was 4.6 ha and biocapacity only 2.9 ha (based on 49 countries) (Global Footprint Network, 2017). This indicates that the region either overuses or net imports renewable natural resources. Both ecological footprint and biocapacity differ regionally, and so does the difference between the two measures (Figure 2.47). For Western Europe (data for 19 of 24 countries), the footprint was 5.1 ha, vs. 2.2 ha biocapacity; for Central Europe (all 18 countries) the footprint was 3.6 ha, vs. 2.1 ha biocapacity, for Eastern Europe (all seven countries) the footprint was 4.8 ha, vs. 5.3 ha biocapacity; and for Central Asia (all five countries) the
120
COUNTRIES IN ECA WITHOUT DATA
COUNTRIES OUTSIDE ECA
footprint was 3.4 ha, vs. 1.7 ha biocapacity. This means that Western and Central Europe and Central Asia have a deficit, while Eastern Europe has a reserve, in terms of biocapacity. A deficit can be ascribed to overuse of local renewable resources or net import (interregional flows) of renewable resources for consumption. In Figure 2.47 countries shaded green have high biocapacity, so they have a reserve despite some also having large ecological footprints.
2.2.4.3 Status and trends of interregional flows for selected nature’s contributions to people Human appropriation of net primary productivity (HANPP) is a measure that includes biomass extraction from ecosystems for food, fodder, fibres and bioenergy. For large parts of Western Europe, HANPP appropriated is lower than HANPP embodied in consumption. For Central and Eastern Europe and Central Asia, HANPP of the region is about the same as or slightly higher than HANPP embodied in consumption (Erb et al., 2009a, 2009b). European Union imports embodied HANPP to an increasing extent, in particular from South America (Kastner et al., 2015) (see Figure 2.48). Central and Western Europe depend on land elsewhere for crop production to a large degree; Eastern Europe and Central Asia to a lesser degree. Main sources are Brazil, Argentina, China and the USA (Yu et al., 2013). In 2008 Western Europe showed relatively low levels of selfsufficiency in terms of crop production and consumption,
CHAPTER 2. NATURE’S CONTRIBUTIONS TO PEOPLE AND QUALITY OF LIFE
Figure 2 48
Human appropriation of net primary productivity (HANPP) (Mt dm/yr) embodied in trade between the European Union and ten world regions. Arrows indicate the largest flows (red=import, black=export). Source: Kastner et al. (2015).
1987
1997
2007
-50 – -25
-25 – 0
0 – 25
25 – 50
50 – 75
75 – 100
100 – 150
150 – 300
121
THE REGIONAL ASSESSMENT REPORT ON BIODIVERSITY AND ECOSYSTEM SERVICES FOR EUROPE AND CENTRAL ASIA
Figure 2 49
Croplands (million ha harvested per year) related to import and export of crops. Source: Kastner et al. (2014).
1987
2008
SELF-SUFFICIENCY RATIO (PRODUCTION / CONSUMPTION)
0.6
0.7
Figure 2 50
0.8
0.9
1.0
1.1
1.2
1.3
1.4
1.5
1.6
Flows of traded wood and wood products (million tonnes of C), within, to and from Europe and Central Asia for 1997 and 2012. Only flows above 1 million t C are indicated with arrows. Source: Based on data from Henders et al. (2015); Kastner et al. (2011).
1997 Western Europe Central Europe 3.4
2.3
5.4
4.2
Eastern Europe Central Asia
1.2 1.6
Northern America 1.0 Latin America North Africa-West Asia Sub-Saharan Africa East Asia Oceania South Asia South-East Asia
2012
Other / unclassified
2.9 1.3 5.6 1.9
2.5 2.1 2.9
122
1.7 2.1
5.2
Flows within Europe and Central Asia Flows to Europe and Central Asia Flows from Europe and Central Asia
CHAPTER 2. NATURE’S CONTRIBUTIONS TO PEOPLE AND QUALITY OF LIFE
while Central and Eastern Europe as well as Central Asia showed higher production than consumption levels (i.e. self-sufficiency ratio larger than 1) (see Figure 2.49) (Kastner et al., 2014). Figure 2.49 indicates Central and Western Europe depended in 2008 on food and feed imports equivalent to the annual harvest of 35 million hectares of cropland, a land area the size of Germany. See Section 2.3.1.1 on food security. Worldwide median minimum distance from fishing source to place of consumption has increased from about 500 km in 1950 to about 2,500 km in 2011 (Watson et al., 2015b). Seafood exports from Europe and Central Asia increased over the period 1976-2009, with Russia, Norway and Spain being the main exporters. Per capita consumption also increased, with Norway, Iceland, Spain, Portugal and Lithuania being the countries with the highest per capita consumption (Watson et al., 2015a) (See Section 2.2.2.1). Interregional flows of roundwood and wood products (t C per year) have changed patterns between 1997 and 2012 (Figure 2.50). The largest flows within Europe and Central Asia are exports from Central and Eastern Europe to Western Europe (stable between 1997 and 2012). Eastern Europe increased exports to South Asia. Flows from North America to Western Europe decreased, flows from Latin America to Western Europe increased. Interregional flows take place also for carbon sequestration. There is evidence that terrestrial ecosystems only sequester a small fraction of anthropogenic carbon emissions in Europe (defined here as the landmass between the Atlantic Ocean and the Urals, excluding Turkey and the Mediterranean isles) (Janssens et al., 2003). The rest is sequestered by terrestrial ecosystems in other parts of the world, by oceans, or adds to the atmospheric carbon stock.
2.2.5 Summary of trends of nature’s contributions to people
constant, decreasing and mixed trends per contribution). This pattern, however, is not consistent across contributions: while 59% and 66% of the scientific publications reviewed provide evidence of declining trends in regulating and nonmaterial contributions, respectively, only 39% of the studies show negative trends in the delivery of material contributions (Figure 2.51). In fact, of the range of nature’s contributions to people delivered in Europe and Central Asia, about 44% have been assessed as declining, particularly regulating and some non-material contributions, such as learning derived from indigenous and local knowledge. The decreasing trends of learning derived from indigenous and local knowledge also have consequences for other contributions from nature to people, such as the use of medicinal plants (Section 2.2.2.4), wild food gathering (Section 2.2.3.2.1), the use of guard dogs for protecting livestock (Section 2.2.2.3.4) and the cultural identity of peasants, herders and shepherds (Section 2.3.3, supporting material Appendix 2.227), which have also declined over the assessed period. Intensification of management practices, technology, manufactured capital and market forces have promoted increasing trends in the provision of particular material contributions from nature to people, including food, biomass-based energy and materials (Figure 2.51). The increasing trends in the delivery of specific material contributions have come at the expense of the longterm deterioration of regulating contributions. Some key regulating contributions, such as habitat maintenance, pollination, regulation of freshwater quantity and quality, formation and protection of soils, and regulation of floods, have been negatively affected since the 1960s by intensified management practices that seek to increase production of crops, livestock, aquaculture, woodfuels and cotton. In addition, the increasing demand in Western and Central Europe for nature’s material contributions to people, such as food and biofuels, is straining the capacity of ecosystems and nature’s contributions to people in other regions of the world (Sections 2.2.2.3 and 2.2.4).
The contributions to people from ecosystems in Europe and Central Asia have changed markedly since the 1950s, promoting changes in the quality of life of its societies (see Section 2.3). Although the ecosystems of the region are currently delivering multiple contributions to people, there has been evidence of negative trends in the provision of regulating and some non-material contributions since the 1960s (see Figure 2.51). Overall, 58% of publications provide evidence of negative trends of nature’s contributions to people provided between 1960 and 2016, while 28% reported positive trends (see supporting material Appendix 2.726 for the whole list of references reporting increasing,
The improvement found for some of nature’s regulating contributions to people in the last decade in Western and Central Europe (see Figure 2.51), such as regulation of water quality, protection of soils and removal of animal carcasses by scavengers, can be explained by the successful implementation of European Union policies, such as the Nitrates and Water Framework Directives (see Section 2.2.1.7) and the Common Agricultural Policy (see Section 2.2.1.8), the implementation of different nature-based solutions for water quality (see Section 2.2.1.7), as well as different conservation programmes for vertebrates (see Section 2.2.1.10). In addition, it is worth noting that water-based regulating contributions from
26. Available at https://www.ipbes.net/sites/default/files/eca_ch_2_ appendix_2.7_assessment_references_synthetic_table.pdf
27. Available at https://www.ipbes.net/sites/default/files/eca_ch_2_ appendix_2.2_ilk_content_of_ncp.pdf
123
THE REGIONAL ASSESSMENT REPORT ON BIODIVERSITY AND ECOSYSTEM SERVICES FOR EUROPE AND CENTRAL ASIA
Figure 2 51
Assessment of each of nature’s contributions to people (NCP) based on published literature for each subregion and for Europe and Central Asia as a whole. The bottom row of the panel shows the trends of all contributions. The bar indicates the proportion of papers that provide evidence of decreasing, constant, increasing or mixed trends for each contribution, representing the level of agreement. The intensity of the colour represents the total number of publications identified and used in this assessment (i.e., solid colours indicate many papers, whereas faded colours indicate few, and blank space indicates zero studies), thus, representing the quantity of evidence. The degree of confidence is also represented by indicating the level of agreement (i.e. the strongest agreement is presented when only one colour is shown) and the quantity of evidence (i.e. the most robust evidence is presented when the assessment is validated by more than 31 multiple independent papers, which is represented by dark solid colours). Colours can also vary for the same contribution when trends of contribution subtypes differ. See supporting material Appendix 2.7* for the list of references reporting trends in contributions across subregions of Europe and Central Asia. Source: Own representation. 1
NUMBER OF PUBLICATIONS
2—5
6 — 15
16 — 30
> 31 MIXED DECREASED CONSTANT INCREASED
Western Europe
Central Europe
Eastern Europe
Central Asia
Europe and Central Asia
Habitat creation Regulation of air quality Regulation of climate Reg. of ocean acidification Reg. freshwater quantity Reg. freshwater quality Formation of soils Regulation of floods Removal of carcasses REGULATING NCP Food and feed Biomass-based fuels Materials MATERIAL NCP Learning (ILK) Physical experiences Supporting identities NON-MATERIAL NCP All NCP * Available at https://www.ipbes.net/sites/default/files/eca_ch_2_appendix_2.7_assessment_references_synthetic_table.pdf
nature to people have improved in Western Europe since the 1990s due to changing patterns in societal behaviour driven by European Union policies, but not because of an enhancement in ecosystems’ capacity to provide them. For example, although water quality is improving due to the aforementioned Union policies and pollution reduction, ecosystems’ capacity to regulate water quality has been jeopardized by a reduction in the areal extent of wetlands and floodplains (see Section 2.2.1.7). The abstraction and use of freshwater have decreased since the 1990s; however, water availability per capita has also decreased by 15% since 1990 (see Sections 2.2.1.6, 2.3.1.3). Similarly, the increasing trends of physical and psychological experiences
124
(see Figure 2.51) can be explained by the fact that people in the European Union have increasingly demanded nature for recreational activities, although land-use change has threatened the ecosystems highly valued by people for these experiences (see Section 2.2.3.2.1). The pattern of trends in nature’s contributions to people is consistent across the subregions of Europe and Central Asia (Figure 2.51). Declining trends of these contributions are reported in Central Europe (61% of the scientific evidence), Western Europe (55%), Eastern Europe (54%) and Central Asia (48%); while increasing trends are mostly reported for Western Europe (35% of scientific evidence). Nevertheless,
CHAPTER 2. NATURE’S CONTRIBUTIONS TO PEOPLE AND QUALITY OF LIFE
it should be noted that more scientific research (in English language-journals) on nature’s contributions to people has been conducted in Western and Central Europe than in Eastern Europe and Central Asia (Boerema et al., 2017), with implications for the levels of confidence about status and trends of nature’s contributions to people across subregions (Figure 2.51).
2.2.6 Future trends in nature’s contributions to people This section examines the potential impacts of individual drivers on future trends in nature’s contributions to people, with trends in direct and indirect drivers covered in Chapter 4 and the impacts of combined drivers and trade-offs between contributions discussed in Chapter 5, Sections 5.2 and 5.3. A semi-structured literature review (see Section 2.2) was undertaken, with information extracted into a template to enable comparison across nature’s contributions to people and to facilitate integration with Chapter 5’s analysis of the impacts of multiple drivers on the status and trends of contributions (see Section 5.3.3 and 5.3.4). In the allotted time, this search process could only be fully applied to food and feed, air and climate regulation, and learning and inspiration. Even the targeted semi-structured literature review yielded comparatively few articles, except for Western Europe. Thus, it was not possible to estimate robustly future trends in nature’s contributions to people in Europe and Central Asia. As in Chapter 4, the most frequently identified driver of trends in contributions was climate change, followed by land use, land-use change and forestry (LULCC).
2.2.6.1 Regulating contributions Nature’s regulating contributions to people are likely to show mixed responses to climate change across Europe and Central Asia (Kovats et al., 2014). Few studies have examined future trends in pollination or pollinators, but both qualitative and quantitative modelling studies suggest that climate change is likely to lead to pollinator decline. Modelling shifts in bumblebee distribution showed that, by 2100, up to 36% are projected to be at high risk from climate change (losing >80% of their current range), with 41% at risk (losing 50-80% of their current range), depending on the scenario (Kerr et al., 2015). Little literature was found for the air regulation as a contribution from nature to people. Tallis et al. (2011) estimated that the planned increase in tree cover, from 20% to 30% in the Greater London Authority area, could increase particulate matter (PM10) removal by 18% by 2050, assuming no change in tree cover types. Papers on past and present trends in urban air quality comment on the importance of trees and green space in the future (e.g., Baró et al., 2014).
Climate regulation may become more important as countries seek to meet their greenhouse gas commitments under the Paris Agreement. For example, the Tajikistan government has a national programme on carbon sequestration (2014-2024), which includes plans for afforestation and reforestation (Mustaeva et al., 2015). For future carbon budgets, climate and land use, land-use change and forestry (LULCC) were the most frequently analyzed drivers, with the net balance of their effects depending on their impact on vegetation, soil storage and decomposition. In the Arctic, global mean temperature increases could decrease carbon storage in permafrost soils by 2100, despite increased uptake of carbon by vegetation. In northern parts of Western and Eastern Europe, warming could increase tree carbon storage (Olchev et al., 2009; Shanin et al., 2011), although it would decrease if precipitation declines (Olchev et al., 2009), especially in southern areas of the European Union (Lavalle et al., 2009). Also, forest disturbance from wind, bark beetles and wildfires are projected to decrease the carbon storage potential of forests in Western and Central Europe by 503.4 TgC between 2021–2030 (Seidl, 2014). Land use change and fire could have mixed effects on future carbon budgets (Kuemmerle et al., 2011; Verkerk et al., 2014). Unmanaged woodlands in Western Europe should continue to be a carbon sink (Allen et al., 2016), while in central Russian forests, fire and management could have a greater influence than climate on future vegetation and soil carbon stocks, with forests becoming a carbon source rather than a sink (Shanin et al., 2011). There are similar mixed responses to land use change and management on formerly abandoned lands in Eastern Europe and Central Asia (Causarano et al., 2011), with afforestation increasing carbon storage, while for biofuel production, using low intensity/high density grass-legume pastures, it depends on the timing of cultivation, tillage and climate change, and soil carbon sequestration would increase unless climate change were to decrease vegetation net primary productivity (Vuichard et al., 2008). Artificialization and soil sealing are rapidly increasing in the European Union (FAO, 2015b; Jones et al., 2012) and might affect the formation and protection of soils as a contribution from nature to people in the near future, while this is not yet a problem in Central Asia due to the vast extent of land (UNEP & UNECE, 2016). Hence, the supply of erosion control in the coming decades will mainly depend on the farming practices and land-use policies implemented. Changes in climate will affect the demand for, and supply of, hazard regulation. Greater demand could result from increased glacier melt (Hagg et al., 2006; Sorg et al., 2012; Stoffel & Huggel, 2012); flooding due to heavy precipitation events in parts of Western and Central Europe (Kovats et al., 2014); and fire frequency and severity, especially in parts of
125
THE REGIONAL ASSESSMENT REPORT ON BIODIVERSITY AND ECOSYSTEM SERVICES FOR EUROPE AND CENTRAL ASIA
Russia (Gauthier et al., 2015) and southern Western Europe, where the annual burned area could increase by a factor of three to five by 2100 under the IPCC A2 emission scenario (Dury et al., 2011).
2.2.6.2 Material contributions from nature to people Changes in seasonal, and extremes of, temperature and precipitation, as well as CO2, can affect food and feed provision, which show mixed trends in yield, depending on the scenario, region and crop. Global modelling of cereal production in 2050 shows increases in countries in the Organization for Economic Co-operation and Development and in countries emerging from the former Soviet Union, partly as a result of an enhanced CO2 fertilization effect, with cereal consumption possibly increasing in the former, and increasing in the latter depending on scenario (Alcamo et al., 2005). Zabel et al. (2014) also suggest that climate change will increase the extent of agriculturally suitable land and food production in Russia. Food, livestock and fibre production, however, are projected to decrease in parts of
Figure 2 52
Western and Central Europe, but to increase in the northern parts of these regions (Kovats et al., 2014). Climate change is projected to cause increased yields of rainfed maize, while rainfed wheat shows a mixed response across Europe and Central Asia, depending on the climate scenario (Nelson et al., 2010). It could lead to an overall decrease in daily per capita calories available (Nelson et al., 2009) and in fodder quality (Quetier et al., 2007). In Eastern Europe and Central Asia, by 2050, yields of many irrigated crops show a mixed response, but water shortages mean that irrigation is unlikely to be able to continue at current levels, so yields could decrease by 50% or more (Sutton et al., 2013). Other studies project decreases in agricultural production from combined effects of climate change and deteriorating land use practices in the Czech Republic (Lorencova et al., 2013) and across Western Europe (Haines-Young et al., 2012). Timber production may decrease in many parts of Central Europe, but with increases predicted in northern parts of Western Europe. In Finland, forest stand models, in which tree growth is converted into site and then regional forest growth, calculate that, under an Intergovernmental Platform on Climate Change SRES B2 scenario (based on
Projected changes in maximum catch potential by 2050 relative to 2005 under the SRES A1B scenario, with assumptions about sensitivity to ocean acidification (OA). Projections are made using a dynamic bioclimatic envelope model with physical and biogeochemical outputs from the National Oceanic and Atmospheric Administration’s Geophysical Fluid Dynamics Laboratory Earth System model (TOPAZ). Source: Cheung et al. (2012). % CHANGE IN CATCH POTENTIAL FROM 2005 TO 2050
Others (>70 N)
Barent Sea
Greenland Sea
Norweglan Sea
Iceland
Celtic-Biscay Shelf
Iberian Coast
Others (50oN), with an average yield increase of 30-70% (Figure 2.52), depending on assumptions about the effects of ocean acidification on fish ecophysiology (Cheung et al., 2012).
Figure 2 53
Biodiesel and ethanol production in the European Union (EU-27) by 2030 under different scenarios combining drivers such as globalization and regionalization, import levels, processing facilities and infrastructural arrangements, subsidy levels, and nature conservation policies. Source: Hellmann & Verburg (2011). GLOBAL ECONOMY
GLOBAL COOPERATION N
CONTINENTAL MARKETS
REGIONAL COMMUNITIES
PERCENTAGE BIOFUELS
0%
5%
10%
15%
20%
127
THE REGIONAL ASSESSMENT REPORT ON BIODIVERSITY AND ECOSYSTEM SERVICES FOR EUROPE AND CENTRAL ASIA
Within Europe and Central Asia, the main biodiesel and bioethanol producers and consumers are within the European Union. Based on the Special Report on Emission Scenarios (Nakicenovic & Swart, 2000), the scenarios for the spatial allocation of biofuel crops within the EU-27 region showed that by 2030, for different storylines with various political and economic circumstances, some regions are projected to have a higher share of biofuel crops (Hellmann & Verburg, 2010) (Figure 2.53). For 2050 under a business-as-usual scenario, biofuel potential amounts annually to 3.6 EJ (Western Europe), 6.3 EJ (Central Europe), and 7.9 EJ (Central Asia and Russian Federation) (Haberl et al., 2011). Figure 2.53 shows that current biofuel production in the subregions is strongly below the future potential. Western Europe has the lowest potential, but the significantly highest biofuel production. However, these biofuel potentials do not take changes in population, diets, and climate into account. The highest unused potentials for biofuels are in Central Asia and Russia.
Verkerk et al. (2014) showed that recreational attractiveness (an expert-based index (1–10) of the preference value for different forest stands for recreation) did not change in Western or Central Europe in either a reference (business-as-usual) scenario or wood energy scenario (see above). The biodiversity scenario, however, could lead to an improvement in the recreational attractiveness index by 0.5 points (+ 9.4%; range between countries: + 0.2 to +1.0 points). Overall, the changes were quite small as the index depends on broad age classes of people, which changed relatively slowly between 2010 and 2030. No clear evidence of future trends in learning and inspiration from nature can be identified, but knowledge of urban habitats can contribute to future urban greening policy and scenario development (Camps-Calvet et al., 2015; Colding et al., 2013; Mortberg et al., 2013). Scientific and indigenous and local knowledge of a range of nature’s contributions to
2.2.6.3 Nature’s non-material contributions to people There are fewer studies on the future of nature’s nonmaterial contributions to people and most of them relate
Figure 2 54
to learning and inspiration and physical and psychological experiences linked to outdoor recreation and tourism. In northern Scandinavia and north-western Russia, tourism and recreation could decrease in winter due to climate change, but increase in summer, while cultural ties to the landscape and species unique to northern areas could decline (Forsius et al., 2013; Jansson et al., 2015).
A comparison of changes in nature’s contributions to people in different landscape types under a no net loss scenario with better implementation of existing biodiversity conservation measures (NNL1) and a no net loss scenario with offsetting of residual impacts on areas of high biodiversity and ecosystem service value (NNL3), compared to business-as-usual.
Bundle (Reg & Cult services)
EU27
Urban cores Peri-Urban landscapes Forest/nature landscapes Agricultural landscapes Mosaic landscapes
128
IMPACT OF NNL1 SCENARIO Adverse < 1% change Positive
Adverse
Natura 2000 areas
Positive
IMPACT OF NNL3 SCENARIO
HNV Farmland
< 1% change
Recreation
Pollination
Flood regulation
Erosion prevention
Carbon stock
Carbon sequestration
REGION
Crop production
• Indicates no net loss of the contributions from nature to people compared to baseline under the NNL3 scenario. Source: Schulp et al. (2016).
CHAPTER 2. NATURE’S CONTRIBUTIONS TO PEOPLE AND QUALITY OF LIFE
people is a key component of scenario development used to consider future strategies and options for environmental and conservation management, such as for transhumance networks in Spain (Oteros-Rozas et al., 2013a), forests in Poland and Sweden (Carlsson et al., 2015; Chmura et al., 2010) and protected areas in Europe (Mattsson & Vacik, 2017). Emerging forms of learning, using virtual tools to develop environmental awareness amongst adults and young people will also rely on knowledge of biodiversity and drivers of change (Harwood et al., 2015; Ulbrich et al., 2015). For many of nature’s contributions to people, policies can also affect the future demand and supply. Simulations of how land use changes in the EU-27 could affect a range of contributions under a business-as-usual scenario and three biodiversity no net loss scenarios were undertaken by Schulp et al. (2016). The simulations found that while no net loss policies generally led to an improvement in most of nature’s contributions to people, especially climate regulation and pollination, such policies would not totally address the loss of biodiversity and of nature’s contributions to people because of the continued demand for land for human use (Figure 2.54). Food provisioning could also be negatively affected under no net loss policies, while some of nature’s regulating contributions to people and recreation could be little affected. This, and other studies which consider a number of nature’s contributions to people together (e.g. Kain et al., 2016), highlight that trade-offs between contributions need to be taken into account when considering both current and future trends (Section 2.3.4.2).
2.3 EFFECTS OF TRENDS IN NATURE’S CONTRIBUTIONS ON QUALITY OF LIFE IN EUROPE AND CENTRAL ASIA 2.3.1 Contributions to foodenergy-water security Food, energy and water are essential for human well-being, poverty alleviation and sustainable development (FAO, 2014b). Food security, water security and energy security represent Sustainable Development Goals number 2, 6 and 7, respectively (see Section 2.4).
2.3.1.1 Food security Food security is achieved when all people, at all times, have physical and economic access to sufficient, safe and nutritious food to meet their dietary needs and food preferences for an active and healthy life (FAO, 2014b). A condition for the full realization of the right to food is “food sovereignty” (De Schutter, 2014), defined as “the right of nations and peoples to control their own food systems, including their own markets, production modes, food cultures and environments” (Wittman et al., 2010). The situation and trends of food security and sovereignty in Europe and Central Asia have been mixed in the last century and vary greatly between and within subregions, with the best situation in Western Europe, and Central Asia showing the largest challenges (all data retrieved from FAOSTAT). Food availability is adequate across Europe and Central Asia, where the average dietary energy supply adequacy ranges from 137% in Western Europe to 121% in Central Asia (see Figure 2.55). Food accessibility and utilization varies between subregions. The domestic food price level showed stability between 2001 and 2014, but also large inequalities within the region with the lowest price levels in Western Europe, intermediate levels and decreasing in Central Europe, and three times higher levels and increasing in Eastern Europe. Undernourishment has been very low in recent decades in Central and Western Europe; in Eastern Europe, although currently stable around 7%, it reached almost 45% in the early 1990s; and in Central Asia, it has fluctuated and currently reaches 20%. The percentage of adults who are underweight increased to almost 4% in Central and Western Europe from the late 1990s to the end of the century. During the recession of 2007-2009 daily nutritional intake and the consumption of nutritious food declined in Eastern and Central Europe, so that after 2008 the percentage of households with children unable to afford a meal with meat, chicken, fish, or a vegetable equivalent every second day more than doubled in some countries reaching up to 18% in Greece in 2012 (UNICEF, 2014). Overall food stability is improving: domestic food price volatility is quite low and relatively stable in the last decades, except for a peak in Eastern Europe in 2005. However, the food production variability per capita is increasing since 2010, particularly in Eastern Europe, which might be considered a threat to food security. A global nutrition transition is affecting the quality of diet in Europe and Central Asia (see Figure 2.56), with rapid increases in the rates of obesity and overweight (Popkin et al., 2011), which is linked to inefficiencies and waste in the global food system. In fact, the average fat supply and protein supply are increasing and the former is almost double in Western Europe than in Central Asia and Eastern Europe, which instead show the largest index of diet diversification (see Figure 2.56). The prevalence of food over-acquisition is almost 50% in Western Europe and, although it is lower in the other subregions, it is increasing for these.
129
THE REGIONAL ASSESSMENT REPORT ON BIODIVERSITY AND ECOSYSTEM SERVICES FOR EUROPE AND CENTRAL ASIA
Figure 2 55
Trends in indicators of food security for Europe and Central Asia. Source: Own representation based on data from FAO (2017). Average dietary energy supply adequacy (%)
Domestic food price volatility (index)
140
35
135
30
130
25
125 20 120 15 115
Prevalence of undernourishment (%)
2014
2013
2012
2011
2010
2009
2008
2007
2006
2005
2000
2004
0 2003
100
2002
5
1990—92 1991—93 1992—94 1993—95 1994—96 1995—97 1996—98 1997—99 1998—00 1999—01 2000—02 2001—03 2002—04 2003—05 2004—06 2005—07 2006—08 2007—09 2008—10 2009—11 2010—12 2011—13 2012—14* 2013—15* 2014—16*
105
2001
10
110
Average fat supply (gr/caput/day)
50
160
45
140
40 120 35 30
100
25
80
20
60
15 40
Per capita food production variability (constant 2004–2006 thousand international $ per capita)
2008—10
2006—08
2004—06
2002—04
2000—02
1998—00
1996—98
1992—94
1990—92
2014—16*
2010—12
2012—14*
2006—08
2008—10
2002—04
2004—06
1998—00
2000—02
1994—96
0 1996—98
0 1992—94
20
1990—92
5
1994—96
10
Prevalence of food over-acquisition (%)
45
50
40
45
35
40 35
30
30
25
25 20
20
15
WESTERN EUROPE
130
EASTERN EUROPE
CENTRAL ASIA
2014—16*
2012—14*
2010—12
2008—10
2006—08
2004—06
2002—04
2000—02
1998—00
1996—98
1994—96
1992—94
2012
2010
2008
2004
CENTRAL EUROPE
2006
2002
2000
1998
1996
1994
0 1992
5
0 1990
10
5
1990—92
15
10
*Figures for those years are based on projections.
CHAPTER 2. NATURE’S CONTRIBUTIONS TO PEOPLE AND QUALITY OF LIFE
Figure 2 56
Average indices of the quality of the diet and its impacts on health in subregions of Europe and Central Asia. Source: Own representation based on data from WHO (2008a, 2008b) and FAO (2017).
60
50
40
30
20
10
0
Average diet diversification index (FAO, 2008-2011)
WESTERN EUROPE
CENTRAL EUROPE
Average index of diabetes (WHO, 2008)
EASTERN EUROPE
Food security and food sovereignty are threatened by largescale control of extended tracts of land by large investment companies (land deals or land grabs) (van der Ploeg et al., 2015). In 2012 there were 51 documented cases in Europe and Central Asia occupying a total area of 4.4 million ha (see Figure 2.57): Russia, Ukraine and Romania are the countries with the largest land-grabbed areas (GRAIN, 2016). Countries from the region are also grabbing land abroad (0.63% of worldwide croplands), particularly Western Europe countries (0.57% of worldwide croplands). However, official statistics do not capture the real dimensions of the phenomenon, which leads to crop production being intensified and oriented to distant markets other than local needs (TNI, 2016). Finally, both food security and sovereignty are challenged by the loss of agri-food related indigenous and local knowledge and agrobiodiversity (see Chapter 3 and Box 2.2).
2.3.1.2 Energy security Energy security has been defined by the United Nations as “access to clean, reliable and affordable energy services for cooking and heating, lighting, communications and productive uses” and by the International Energy Agency as “uninterrupted physical availability (of energy) at a price which is affordable, while respecting environment concerns”. Energy production was highest in Eastern Europe and lowest in Central Europe in 2014 (see Figure 2.58). For heating, “energy poverty” affects at least 10% of the population and is more likely for low-income groups in the European Union (see Figure 2.60). Energy poverty is more pronounced in Eastern Europe (Dubois & Meier, 2016).
Average index of obesity (WHO, 2008)
CENTRAL ASIA
The highest share of bioenergy (biofuels and waste) relative to the total production in the region is produced in Western and Central Europe. The highest share of hydropower relative to total production is produced in Western and Eastern Europe. Western Europe is a net importer of fossil energy carriers (coal, oil products, and natural gas), whereas Eastern Europe is the largest, and Central Asia the second largest exporter in the region. The net imports or exports by subregion are negligible for bioenergy (biofuels and waste) and other renewables compared with other energy carriers (see Figure 2.59). At the country levels, the trade balance for biofuels in Central Asia and Eastern Europe are mostly equalized. Net exporters are mostly found in Western and Central Europe, the biggest being The Netherlands, Latvia and Germany. Similarly, Western European countries also strongly depend on imports (Italy, the United Kingdom, Denmark, Austria, and Belgium) (see Figure 2.61). Currently, biomass supplies in the European Union are mostly based on domestic sources (4% of the biomass for bioenergy imported) (European Commission, 2014a). In scenarios for 2020 and 2030, biomass for bioenergy may even fill other supply shortages for industry, replacing coal power plants (Dafnomilis et al., 2017). In total, the actual contribution of bioenergy to energy security is weakly captured in existing research (Popp et al., 2014) as the multitude of biomass sources, energy carriers, and conversion pathways impede tracking of this renewable energy source. In addition, there are not
131
THE REGIONAL ASSESSMENT REPORT ON BIODIVERSITY AND ECOSYSTEM SERVICES FOR EUROPE AND CENTRAL ASIA
Figure 2 57
A A global map of the large-scale acquisitions of land (also known as landgrabbing) network: land-grabbed countries (green disks) are connected to their grabbers (red triangles) by a network link. Source: Rulli et al. (2013). B Percentage of surface grabbed by Western Europe in each subregion in Europe and Central Asia and world regions.
A
Grabber GRABBED AREA (100,000 ha) 3–6 6 – 10 10 – 20 20 – 30 30 – 80
B
5% 9% CENTRAL EUROPE EASTERN EUROPE OCEANIA SOUTH AMERICA NORTH AMERICA
49% 24%
ASIA AFRICA
5% 8%
Custodians of food, seeds and traditions: biocultural diversity – the diversity exhibited collectively by natural and cultural systems - of people in the Pamir mountains of Tajikistan.
Box 2
2
“Lonely, desolate, and inhospitable as these mountains for the most part are, one may still find secluded valleys cut deep down into the mountain masses where some hardy hill-men till the ground and form villages.”
132
The remote plains of the Pamir mountains are a challenging place to transform rock into life-giving soil, primarily rain-fed. Yet, that is what Pamiri people have done over millennia at between 2,000 and 4,000 metres, nurturing a centre of origin for grain and fruit varieties which have become staple crops all
CHAPTER 2. NATURE’S CONTRIBUTIONS TO PEOPLE AND QUALITY OF LIFE
around the world, along with domesticated varieties of walnuts,
exemplifies these interconnections. The isolated Bartang Valley
apples, pears, apricots and mulberries.
is well-known for the sweetest tasting Baht, because of a variety of wheat called rush-kakht, which is grown only in the
The rich agrobiodiversity of the Pamirs co-evolved with
upper reaches of the valley with the sole purpose to make baht.
language, culture and spirituality, and as a result of local
Women use small amounts of the flour of rush-kakht to bless
cooking traditions. Food embodies the interconnectedness
the pillars of the house for a productive new year.
of sustenance, health, spirituality, and ecosystem structure and function. Baht, a sweet festive porridge of flour and ice
This text box is based on van Oudenhoven & Haider (2015).
water, that is made in celebration of the new year, Nawruz,
Red wheat growing in Bartang valley. Photo: Judith Quax.
During Nawruz, little animals made of bread (Nazrak) are covered in Baht and provided as offerings. Photo: Judith Quax.
133
THE REGIONAL ASSESSMENT REPORT ON BIODIVERSITY AND ECOSYSTEM SERVICES FOR EUROPE AND CENTRAL ASIA
Figure 2 58
Energy production (in exajoule) by energy source and region in Europe and Central Asia (2014). Source: Own representation based on IEA/OECD (2016).
70
PRODUCTION[EJ]
60
50
40
30
20
10
0
Western Europe
Central Europe
Coal
Crude Oil
Oil products
Natural Gas
Nuclear
Hydro
Geotherm., solar, etc.
Biofuels & Waste
Heat
only rather novel bioenergy carriers such as biofuels, but also woodfuels, which are extensively used, but roughly estimated in statistics of the United Nations Food and Agriculture Organization. This is especially a problem for the numerous countries analyzed in Eastern Europe and Central Asia. The countries of Central Asia have a negligible share of bioenergy in their energy supply (see Figure 2.58). However, given the difficulties of affordable and reliable access, the use of biomass from traditional sources such as charcoal is weakly accounted for, which might be an indication that the figures underestimated nature’s contributions to people from bioenergy (biofuels and waste) in this region (IEA/ OECD, 2015).
2.3.1.3 Water security Water security is assessed here as people’s capacity to safeguard sustainable access to adequate quantities of water of acceptable quality (UN-Water, 2013). The indicators “percentage of population with access to improved drinking water sources” and “freshwater withdrawal as percentage of total renewable water resources” are used to describe general trends for water security in Europe and Central Asia. The former identifies adequate water availability of improved quality (World Bank, 2016), the latter reveals the extent to which long-term available water resources are exploited (FAO, 2016). Overall, water security has increased in the region since the late 1980s (Animesh et al., 2016; FAO, 2016; World Bank,
134
Eastern Europe
Central Asia
2016). Safe drinking water is secured for 95% of the Europe and Central Asian population, with higher percentages in Western Europe and Central Europe, while Eastern Europe (95%) and Central Asia (85%) have lower, but increasing access to improved drinking water since 1995 (see Figure 2.62). The trend in per capita water consumption has increased in all regions, due to increased population, except in Eastern Europe and Central Asia (Kummu et al., 2016). On-going water pollution, especially in Eastern Europe and Central Asia, continues to threaten the availability of safe drinking water, while decreased water levels in natural reservoirs have led to increased water pollution (UN-Water, 2011). Freshwater extraction as a percentage of total renewable water resources decreased between 1993 and 2012 for the Europe and Central Asia region, most notably for Western Europe and Central Asia (see Figure 2.62). It coincides with a 15% decrease in water availability per capita since 1990 (see Section 2.2.1.5). Although water is generally abundant in the European Union, droughts and over-exploitation have led to seasonal water scarcity in some water basins, especially in densely populated and agricultural areas (EEA, 2015e, 2016f; Karabulut et al., 2016). Water stress in most countries of the European Union has decreased slightly since the 1990s, but many areas are considered close to being water scarce (EEA, 2011). In winter, around 6% of the European Union’s population live under waterstressed conditions, while the figure is 14% in summer (EEA, 2016f). Around 20 river basin districts, including the Danube basin but mainly in the Mediterranean region, face structural water stress issues
CHAPTER 2. NATURE’S CONTRIBUTIONS TO PEOPLE AND QUALITY OF LIFE
Figure 2 59
Net energy imports (in exajoules) by energy carrier and region in Europe and Central Asia (2014) (uncorrected for intra-regional trade). Source: Own representation based on IEA/OECD (2016).
20
15
NET IMPORTS [EJ]
10
5
0
-5
-10
-15
Coal
WESTERN EUROPE
Figure 2 60
Crude Oil
Oil products
Natural Gas
CENTRAL EUROPE
Nuclear
Hydro
EASTERN EUROPE
Geotherm., solar, etc.
Biofuels & Waste
Electricity
Heat
CENTRAL ASIA
Inequality in access to heating in the EU-27. Source: Dubois & Meier (2016). 1
% - NUMBER INDICATES THE AVERAGE POPULATION UNABLE TO KEEP HOME ADEQUATELY WARM IN EU 27
11
2
1: Total 2: One adult < 65 years 3: One adult ≥ 65 years 4: Single with dependent children
10
3
5: 2 adults < 65 years 6: 2 adults, at least one aged 65 years + 7: 2 adults with 1 dependent child 8: 2 adults with 2 dependent children 9: 2 adults with ≥ 3 dependent children
9
4 0.5
10: 3 or more adults 11: 3 or more adults with dependent children
1 1.5
TOTAL POPULATION
LOW-INCOME
2 8
5 2.5 3 7
6
(EEA, 2016g), due to climate change and unsustainable water extraction (Skoulikidis et al., 2017). The spatial coverage of freshwater ecosystems in the European Union with a good ecological quality, which are crucial for providing clean water, has decreased from 42% to 32% (see Section 2.2.1.6).
EU 27 (2008-2013) 10.1%
Water security in Western Europe and Central Europe has remained stable since the late 1980s, despite a 40% and 5% decrease, respectively, in per capita freshwater availability since the 1960s (see Section 2.2.1.5) and a slight increase in water quality but on-going decrease in water quality regulation (see Section 2.2.1.6). Water security in
135
THE REGIONAL ASSESSMENT REPORT ON BIODIVERSITY AND ECOSYSTEM SERVICES FOR EUROPE AND CENTRAL ASIA
Figure 2 61
Net imports of biofuels and waste by country (2014) (uncorrected for intraregional trade). Source: Own representation based on IEA/OECD (2016).
120
NET IMPORTS [PJ]
100 80 60 40 20 0 -20 -40
WESTERN EUROPE
Czech Republic
Cyprus
Croatia
Bulgaria
Bosnia and Herzegovina
Albania
Switzerland
United Kingdom
Sweden
Spain
Portugal
Norway
Netherlands
Malta
Luxembourg
Italy
Israel
Ireland
Iceland
Greece
France
Germany
Finland
Denmark
Austria
Belgium
-60
CENTRAL EUROPE
140 120
NET IMPORTS [PJ]
100 80 60 40 20 0 -20 -40
Eastern Europe shows mixed but generally increasing trends since the late 1980s, while per capita freshwater availability has increased by 10% since the 1990s. Several Danube river sub-basins in Eastern Europe were highlighted as being at risk of becoming waterscarce (Karabulut et al., 2016). Central Asia is considered to be facing water scarcity and shows mixed trends since the early 1990s (Animesh et al.,
136
EASTERN EUROPE
Uzbekistan
Turkmenistan
Tajikistan
Kyrgyzstan
Kazakhstan
Russian Federation
Republic of Moldova
Belarus
Georgia
Armenia
Azerbaijan
Turkey
CENTRAL EUROPE
Ukraine
Slovenia
Macedonia
Serbia
Slovakia
Poland
Romania
Montenegro
Lithuania
Latvia
Estonia
Hungary
-60
CENTRAL ASIA
2016; UNEP & UNECE, 2016). Access to safe drinking water has increased since 1994-2007, while recent trends for freshwater extraction as a percentage of available water are mixed and even decreasing (Alexander & West, 2011). This coincides with a mixed, but recent decrease in per capita freshwater availability since the 1990s (see Section 2.2.1.5). Ensuring water security in Central Asia depends on the distribution of, and access to, water resources,
CHAPTER 2. NATURE’S CONTRIBUTIONS TO PEOPLE AND QUALITY OF LIFE
Figure 2 62
Temporal trends in water security in Europe and Central Asia according to: A access to safe drinking water. Source: Own representation based on World Bank (2016); and B freshwater withdrawal as percentage of total renewable water resources. Source: Own representation based on FAO (2016). Note that information for 2013-2017 is incomplete.
100
90
80
2014
2013
2012
2011
2010
2009
2008
2007
2006
2005
2004
2003
2002
2001
2000
1999
1998
1997
1996
1995
1994
1993
1992
1991
70 1990
PERCENTAGE OF POPULATION WITH ACCESS TO IMPROVED DRINKING WATER SOURCES (%)
A
AVERAGE FRESHWATER WITHDRAWAL AS % OF TOTAL RENEWABLE WATER RESOURCES (%)
B 140
120
100
80
60
40
20
0 1988-1992
WESTERN EUROPE
1993-1997
CENTRAL EUROPE
1998-2002
EASTERN EUROPE
especially between different countries (Abdolvand et al., 2014; Conrad et al., 2016; FLERMONECA, 2015).
2.3.1.4 Food-energy-water security nexus Water, food and energy systems are characterized by complex interrelations. Energy is required to process and distribute water; water is central to nearly all forms of energy production; and both energy and water are key to any food enterprise (Harvey & Pilgrim, 2011; Hussey & Pittock, 2012; Karabulut et al., 2016). Pursuing one particular
2003-2007
2008-2012
2013-2017
CENTRAL ASIA
security objective (either food or water or energy security) is sometimes achieved to the detriment of another, reflecting competing claims over limited natural resources and nature’s contributions to people. Agriculture intensification in Europe and Central Asia since the early 1950s has contributed significantly to an increase in the provision of food and feed (see Section 2.2.2.1) and to enhancing food security (see Section 2.3.1.1). However, it has had severe adverse effects on water security in many parts of the region (see the example of the Aral Sea in Box 2.3). Intensive agriculture has been one of the main causes of the pollution (eutrophication and contamination) and
137
THE REGIONAL ASSESSMENT REPORT ON BIODIVERSITY AND ECOSYSTEM SERVICES FOR EUROPE AND CENTRAL ASIA
Box 2
3
The Aral Sea disaster.
The Aral Sea provides clear evidence of how the pursuit of one security objective can be to the detriment of others. During the Soviet era, pressure on the water resource in the Aral Sea region was mainly due to the massive development of irrigation for rice and cotton production. After the dissolution of the Soviet Union, cotton production was reduced but remained key for generating currency revenues. Besides, irrigated winter wheat production grew rapidly to gain grain self-sufficiency (Jalilov et al., 2016). In Central Asia as a whole, the areas under irrigation increased from 4.51 million ha in 1960 to 6.92 million ha in 1980, and to 7.85 million ha in 2000 (Rakhmatullaev et al., 2010). Irrigation systems in the region are highly inefficient with almost half of the water diverted for irrigation lost before reaching the field. Over 50% of the irrigated soils of the region are salinized and waterlogged, due to long-term surface irrigation practices (Qi et al., 2012). Changes in the hydrological cycle caused by the massive
overexploitation of freshwater bodies and the decrease in the extent of floodplains and wetlands (UNEP & UNECE, 2016). These trends have impaired water quality and quantity regulation (see Sections 2.2.1.6 and 2.2.1.7). In addition, many of nature’s other regulating contributions to people, especially pollination, erosion, soil formation and functioning, regulation of flood control; and non-material contributions, such as traditional farming knowledge, have been negatively impacted by agriculture intensification. Another major trade-off associated with agricultural intensification concerns climate. Intensive agriculture is characterized by a loss of carbon in agricultural soil, which impairs its climate regulation capacity and other contributions from nature to people associated with soil (see Section 2.2.1.4 and Section 2.2.1.8). It also entails increasing emissions of fossil carbon used for mechanization and fertilizer production, and of greenhouse gases from cattle and nitrogenous fertilizers (see Section 2.2.1.3 and Section 2.2.1.4). However, over the last 25 years, agricultural intensification has triggered the abandonment, reforestation and afforestation of former agricultural land, especially in Western Europe (see Chapter 4). An increase in forest areas was the main cause of a net increase in greenhouse gas storage in ecosystems in Western, Eastern and Central Europe between 1990 and 2012 (see Section 2.2.1.4). Biofuels also pose major potential trade-offs between security objectives. Over the past 15 years, the European Union policy for renewable energy and its biofuels blending target for transportation fuel (set at 10% by 2020 in the European Union Renewable Energy Directive (2009/28/ EC)), have fostered the production and consumption of biofuel in Western and Central Europe (Sections
138
irrigation led to a significant decrease of river runoff, changes in the area of lakes, and rise of groundwater levels. Hydrological changes, including desiccation of the Aral Sea, basin-wide land-use and land-cover changes, as well as the degradation of the Aral Sea have strongly contributed to climate change in the region (Lioubimtseva, 2015; Micklin, 2007). Dust storms, with dust contaminated by fertilizers, pesticides, heavy metals, and other chemicals; water and wind erosion; widespread land degradation; water pollution; and frequent droughts have negatively impacted populations’ health (Jensena et al., 1997; Wiggs et al., 2003), agricultural productivity and economic development in the area (Cai et al., 2003; Lioubimtseva, 2015). In Central Asia as a whole, access to improved drinking water declined from 57% in 1990 to 50% in 2013 (Abdullaev & Rakhmatullaev, 2016). Cai and co-authors (2003) estimate that thirty-five million people have lost access to the lake’s water, fish, reed beds, and transport functions.
2.2.2.2.2 and 2.3.1.2). Biofuel production carries the risk of competing with food production, increasing food prices, intensifying agricultural land and water use, and harming biodiversity and other contributions from nature to people (De Fraiture et al., 2008; Gerbens-Leenes et al., 2012; Rulli et al., 2013; Rulli et al., 2016). Moreover, the potential of biofuels to reduce greenhouse gas emissions may be offset by the contribution of their production to emissions arising from fertilizers, machinery, and especially land conversion. Projected change in cropland area within the EU-28 caused by compliance with the 10% blending target mainly takes the form of less land abandonment (Valin et al., 2015). Nevertheless, the adverse effects of biofuels vary spatially and depend on the choice of biofuel crop (de Vries et al., 2010; Eggers et al., 2009; Valin et al., 2015). Biofuel derived from properly managed feedstocks with much lower life cycle greenhouse gas emissions than fossil fuels, and which do not compete with food production (mainly biofuel produced from ligno-cellulosic materials), do not entail negative impacts on land and water use, biodiversity, or greenhouse gas emissions (Havlík et al., 2011; Tilman et al., 2009). However, biofuel production in north-western Europe is currently mainly produced from wheat and maize (for bioethanol), and sugar beet and rapeseed (for biodiesel), which perform rather poorly for nearly all environmental indicators, as well as for greenhouse gas emissions (de Vries et al., 2010). Moreover, the European Union 2020 biofuel mandate impacts ecosystems, water and food security globally through European Union imports. In the scenarios developed by Valin et al. (2015), most of the land use change resulting from the European Union 10% blending target occurs outside the EU-28, especially through conversion to oil palm in Southeast Asia.
CHAPTER 2. NATURE’S CONTRIBUTIONS TO PEOPLE AND QUALITY OF LIFE
2.3.2 Contributions to physical, mental and social dimensions of health The recent state of knowledge review coordinated by the World Health Organization and the Convention on Biological Diversity (WHO & CBD, 2015) provides a detailed global assessment of the interlinkages between biodiversity and human health. The review explores the evidence base across three broad areas of human health outcomes – noncommunicable diseases, communicable (i.e. infectious) diseases, and injury – and considers the value of biodiversity to medical science (WHO & CBD, 2015). The role of biodiversity and ecosystem services in supporting human health, and the health risks arising as a result of loss of biodiversity and ecosystem degradation are also highlighted by the review.
and bushmeat) help to support good nutrition, with many communities relying heavily on wild biodiversity as a primary source of energy, protein and micronutrients; for Europe and Central Asia data are limited, but some work has highlighted the cultural and economic significance of wild foods (Fuchs et al., 2016; Łuczaj et al., 2012; Schulp et al., 2014b). Schulp et al. (2014b) identified 38 species of game, 27 species of mushrooms, and 81 species of vascular plants that are regularly hunted, collected and consumed in the European Union, with over 100 million European Union citizens consuming wild food each year, and argue for greater attention to be given to wild foods in ecosystem service assessments. There is evidence that dietary diversity may help to reduce the risks associated with certain noncommunicable diseases, though this is moderated by effects of lifestyle and other socio-economic factors (HunterBurlingame-Remans, 2015; Johnston et al., 2014).
The linkages between nature and health are of increasing research and policy interest. While research efforts are increasingly interdisciplinary, there is still a need for greater integration of different fields of expertise and recognition of the importance of accounting for different forms of knowledge, as with other aspects of biodiversity policy (Pullin et al., 2016). With this perspective in mind, in addition to following the literature review methodology of this chapter we also engaged in a process of IPBES-approved expert elicitation to strengthen the quality of the assessment and literature review. This also supports a key aim of IPBES, which is to build capacity in this rapidly growing field. The expert elicitation was based on the consideration of the World Health Organization and Convention on Biological Diversity literature review and key messages by an expert panel. Further details are provided in the supporting material Appendix 2.828.
Ecosystem change and degradation of natural habitats are identified as risk factors for disease emergence, though the precise contribution of biodiversity, or its loss, to risk of infectious disease outbreaks in wildlife, livestock or humans is generally less certain (Ostfeld & Keesing, 2012; Wood et al., 2017). Biodiversity may reduce disease rise through a phenomenon known as the “dilution effect”, whereby, in ecosystems where hosts of an infectious agent vary in their ability to transmit an infection, increased diversity of potential hosts may reduce the risk of disease outbreak. This concept remains controversial, and any such effect is likely to be highly specific to pathogen, location or geographic scale (e.g. Randolph & Dobson, 2012; Wood & Lafferty, 2013). Some evidence for the dilution effect in at least some local contexts has been presented from several studies, mostly from Western Europe (e.g. Bolzoni et al., 2012; Kedem et al., 2014; Khalil, 2016; Ruyts et al., 2016).
The importance of biodiversity and ecosystem services to human health is well established in some areas of health research, for example with regards to the contribution of biodiversity to contemporary and traditional medicine (Heinrichs & Jäger, 2015; Payyappallimana & Subramanian, 2015), to food and nutrition security (Hillel & Rosenzweig, 2008; Hodgkin-Hunter, 2015), and through linkages to infectious disease risk (Karesh & Formenty, 2015). Traditional medicinal practice has long been based on preparations derived from wild or domesticated species, and the value of biodiversity is recognized in contemporary medicinal research, with the development of new pharmaceuticals supported by bioprospecting and often based on lessons from traditional knowledge (Newman & Cragg, 2016). The evidence regarding the contribution of biodiversity to food and nutrition security is also well established. Globally, diets rich in biodiversity (cultivated varieties as well as wild sources such as fish, fruit, fungi, invertebrates
Another area where the relationship between biodiversity and ecosystems and health may be highly variable is the impact which exposure to nature can have on mental and physical well-being (Horwitz & Kretsch, 2015; Lee & Maheswaran, 2011; Van Den Berg et al., 2015). The ways in which health is affected by biodiversity and nature’s contributions to people is determined by the nature of specific social-ecological systems, including the degree and types of interactions between people or their communities and the natural environment. This highlights the importance of social, economic and cultural factors in determining the strength and direction of linkages between health and biodiversity (Clark et al., 2014; WHO, 2017; European Commission, 2016b).
28. Available at https://www.ipbes.net/sites/default/files/eca_ch_2_ appendix_2.8_assessment_of_health.pdf
Increased urbanization in Europe and Central Asia poses significant challenges for human health including a rise in non-communicable diseases associated with modern lifestyles, including obesity and diabetes, cardiovascular diseases, depression and anxiety disorders, and diseases
139
THE REGIONAL ASSESSMENT REPORT ON BIODIVERSITY AND ECOSYSTEM SERVICES FOR EUROPE AND CENTRAL ASIA
associated with pollution (Benziger et al., 2016). Efforts to increase access of urban dwellers to green space and open countryside may help to address some of these health issues. Scientific review literature shows there are many potential pathways between exposure to nature or natural spaces and positive health status. However, these pathways do not necessarily exist for all persons within any given community, even where different social groups (differentiated by, for example, age, gender, ethnicity, income level, or education) have access to, or utilize, common areas of natural space (Hartig et al., 2014; Jackson et al., 2013; Myers & Patz, 2009). Again, several social, cultural and economic factors are likely to be at play, and more research is needed in this regard (Clark et al., 2014). Differentials in the ways in which some communities or groups within wider society (e.g., indigenous groups, refugees, women, the elderly or poor) experience and interact with biodiversity and ecosystems may result in differences in the influence of biodiversity and ecosystems on their health status. There is, thus, potential for groupspecific or community-specific dependencies and risks (WHO, 2017; Horwitz & Kretsch, 2015; Jay et al., 2012). Individual groups within a community (defined by, for example, gender, age, ethnicity, infirmity, engagement in cultural practices) may experience greater or lesser health benefits from biodiversity and ecosystem services, or be at greater or lesser risk of ill health associated with biodiversity loss and ecosystem change, than others, as a result of a range of moderating social, economic and cultural factors. Any relationships which can be drawn between health outcomes and biodiversity or ecosystem services are, therefore, likely to be dependent upon the ways in which groups or individuals understand, acknowledge or experience their relationship with the natural environment (Clark et al., 2014). There is well established evidence from multiple studies that a healthy immune system is supported by exposure to biodiversity (Rook & Knight, 2015). Exposure to environmental microbiota has been associated with reduced risks of allergy, chronic inflammation and certain other autoimmune diseases. A growing body of evidence suggests that interactions between wild microbes and the human microbiome – the diverse community of microbes present in the intestinal, respiratory and urogenital tracts, and on our skin – may be key to healthy immune function. Conversely, loss of diversity in human microbiota, which may be associated with decreased exposure to wild microbes, has been linked to increased risk of a range of non-communicable diseases, including inflammatory diseases, diabetes and allergies (Hanski et al., 2012; Ruokolainen et al., 2017). With so many significant linkages identified between health and biodiversity, and with increased knowledge of the health risks posed by ecosystem change and biodiversity loss,
140
numerous opportunities exist for development of integrated policies and practical strategies to realize benefits for both biodiversity and human health and well-being. Biodiversity conservation provides opportunities to secure and enhance those ecosystems and ecosystem services that are of particular relevance to human health outcomes (Romagosa et al., 2015; ten Brink et al., 2016). A review of national reports to the Convention on Biological Diversity (see supporting material Appendix 2.829) examined the extent to which countries in Europe and Central Asia consider nature–human health linkages. Almost all countries involved in the analysis (covering 93% of those in the region) explicitly recognized the importance of nature–human health linkages. Only 8% mentioned these linkages in general terms, while the majority considered key details such as the diversity of linkages, local specificities, challenges, opportunities and actions. Some countries also mentioned local practice examples regarding application of health-relevant insights. Most (63%) mentioned both human health benefits and risks of nature-human linkages, while 6% mentioned only risks and 27.5% only benefits.
2.3.3 Cultural heritage, identity and stewardship 2.3.3.1 Value through use For different social groups in Europe and Central Asia, nature contributes to cultural heritage, identity and stewardship through providing opportunities for good quality of life beyond mere survival. It offers opportunities for leisure and tourism, maintaining indigenous and local knowledge, and being exposed to learning, inspiration and spiritual experiences. Evidence suggests that these contributions from nature to people show increasing trends (see Section 2.2.3). Nature is in high demand for nature-based recreation activities by people in many parts of the region (see Section 2.2.3.2.1) (Hausner et al., 2014; Martín-Lopez et al., 2012; Rall et al., 2017) and preferences for holidays of people in the European Union in the last decade, show an increasing interest in nature-based tourism (European Commission, 2016a). In addition, the number of visitors to protected areas increased between 1995 and 2009 in some Western European countries, such as Spain, Finland and the UK (Figure 2.63). Recreation and leisure are recognized by urban people as the most important benefits derived from urban green spaces. Other motivations to visit urban greenspaces 29. Available at https://www.ipbes.net/sites/default/files/eca_ch_2_ appendix_2.8_assessment_of_health.pdf
CHAPTER 2. NATURE’S CONTRIBUTIONS TO PEOPLE AND QUALITY OF LIFE
Number of visitors to protected areas in the United Kingdom and Finland (measured as average annual visit rate per protected area) and Spain (measured as millions of visitors). Source: Own representation based on Balmford et al. (2015); Santos-Martín et al. (2013).
AVERAGE ANNUAL VISIT RATE PER PROTECTED AREA (PA)
600,000
124 122
500,000 120 118
400,000
116 300,000 114 112
200,000
110 100,000 108
MILLION OF VISITORS TO PROTECTED AREAS (PAs)
Figure 2 63
106
0 1995-1999
UK (Average annual visit rate per PA)
2000-2004
FINLAND (Average annual visit rate per PA)
include health, psychological well-being and emotional attachment to the site (Bolund & Hunhammar, 1999; Casado-Arzuaga et al., 2013; Haase et al., 2012). Green spaces and ecosystems are also used for formal learning by schools and universities in many countries in Europe and Central Asia, where outdoor learning provides additional value for learners and teachers in terms of knowledge and skill acquisition (Mocior & Kruse, 2016). Indigenous and local knowledge has significant value for some local communities in Europe and Central Asia. A review of studies in Arctic regions argues that this knowledge plays an important role in land rights claims (Davis & Wagner, 2003). An in-depth study of resource-users and local organizations involved in a local fishery in Sweden shows how indigenous and local knowledge can contribute to fish management and conservation (Olsson & Folke, 2001). Co-production of knowledge by traditional herders and national park rangers for adaptive nature conservation management of wood-pastures and salt steppes can also lead to new occupations, like the so-called “conservation herders” (Molnár et al. 2016). Furthermore, the conservation of indigenous and local knowledge and related landscapes can support the economic development of rural areas by fostering tourism and consumption of local products, and contributing to the quality of life of people (FernándezGiménez & Fillat Estaque, 2012; Parrotta & Agnoletti, 2007). However, in many areas of Europe and Central Asia the value of local ecological knowledge has been eroded with a decline in indigenous and local knowledge. Studies comparing the UK to developing countries have argued that indigenous and local knowledge declines as nations
2005-2009
SPAIN (Million of people)
become wealthier and ecological knowledge becomes less valued (Pilgrim et al., 2008). Changes in culture are partly responsible for the devaluation of indigenous and local knowledge among younger generations, which consider these traditional practices and knowledge as symbols of poverty or backwardness. The use of some of nature’s material contributions to people is also strongly connected to values arising from nonmaterial contributions, which contribute to cultural practices that enhance identity (see Sections 2.2.3.2 and 2.2.3.3). For example, in many Central and Western European countries, mushroom collecting is a part of culture and tradition (Hansen & Malmaeus, 2016; Martínez de Aragón et al., 2011; Stoyneva-Gärtner, 2015). Recreational berry picking is also often a family and cultural tradition, which has been kept alive during recent decades (Schulp et al., 2014b), mostly in Scandinavian countries (Kangas & Markkanen, 2001). It has been estimated that 56-58% of households in Scandinavian countries collect berries for domestic purposes (Jonsson et al., 2002). Belief systems are a fundamental aspect of people’s culture that strongly influence their engagement with nature (Groot et al., 2005). Religious or spiritual interactions with nature have been shaped over decades or centuries, and influence human endeavour directly or indirectly (IPBES, 2015). Many traditional knowledge systems in Europe and Central Asia depict ecosystems as fully alive, incorporating spirits of animals and other natural objects and spirits of human ancestors (Berkes et al., 1998). Pre-monotheistic belief systems integrated elements of nature to give meaning to the world and humans’ place in it (Verschuuren, 2006).
141
THE REGIONAL ASSESSMENT REPORT ON BIODIVERSITY AND ECOSYSTEM SERVICES FOR EUROPE AND CENTRAL ASIA
Similarly, myths and related rites have existed in Europe and Central Asia since the dawn of humanity (see Box 2.4). For a number of local and indigenous communities in Europe and Central Asia, especially those that have pagan, animistic or shamanistic roots, land is alive and full of various kinds of energies or life forces and nature’s organizing principles are depicted as entities, spirits or natural law (UNEP, 1999).
2.3.3.2 Value through protection and beyond use Different social groups indicate the value of their relationship with nature by expressing their desire to conserve and
Box 2
4
protect areas and iconic species that they do not use directly. People can express this form of value through willingness-to-pay and indications of other preferences for the protection of species irrespective of actual aesthetic or recreational use (see Section 2.2.3.4). Protected areas are increasingly valued for their use and recreation potential. European Union people increasingly acknowledge their importance for eco-tourism and naturerelated recreational experiences and 43% of European Union citizens identified this role of protected areas as very important (European Commission, 2015a). In addition, visitors to protected areas and UNESCO World Cultural Heritage Sites around Western and Central Europe have
The Cult of Hızır as an Expression of Revering Nature’s cycles.
Seasonal changes are important components of folk calendars throughout the world. In the Turkic world (including Yakuts, Mongols, Kalmyks, Buryats and Tungusic people in Central Asia), Hıdrellez (known as Ruz-ı Hızır or day of Hızır) is one of the most important seasonal celebrations and represents the revival of the warm and productive summer days (Uca, 2007). Based on folk calendar traditions, the year is divided into two, the summer known as “Days of Hızır” and the winter, known as “Days of Kasım”. Hıdrellez Day falls on May 6 and is the day on which Prophets Hızır and Ilyas met on the seashore between dry land and water (Artun, 1990).
The awakening of nature is actively celebrated throughout the Turkic world on Hıdrellez day with rites that are dependent on water (Walker & Uysal, 1973). These ceremonies generally take place in nature, near sources of water, or near tombs and shrines. In rituals before sunrise on that day, Turks construct, in their gardens, models of the things they wish for most such as good health, or write their wishes on pieces of paper which are then either released into rivers and other water bodies or hung on trees (Walker & Uysal, 1973).
Tahtacı Turkmen villagers in the northern Aegean Kaz Mountains line up to wash their face in the early morning of Hıdrellez to receive health and bounty from the river waters. Photo: Solmaz Karabaşa
142
CHAPTER 2. NATURE’S CONTRIBUTIONS TO PEOPLE AND QUALITY OF LIFE
expressed substantial willingness to pay to enjoy the recreational services provided (Martín-Lopez et al., 2009), including in Turkey (Gürlük & Rehber, 2008) and Albania (Seidl, 2014). A further value of tangible and intangible protected heritage associated with nature is that it helps to maintain cultural
Figure 2 64
meanings and a sense of identity (Klinar & Geršič, 2014; Tengberg et al., 2012). This can be based on the tangible material outcomes of cultural activities on landscapes (e.g., wood pastures, viticulture terraces) as well as individual species that are linked to intangible heritage such as through myths, legends, and religious practices (Daniel et al., 2012).
Distribution of the different types of protected areas among Europe and Central Asia subregions. Source: Own representation.
100% 90% 80% 70% 60% 50% 40% 30% 20% 10% 0%
Strict Protected Areas WESTERN EUROPE
Figure 2 65
Sacred Natural Areas
CENTRAL EUROPE
UNESCO Intagible Heritage
EASTERN EUROPE
Cultural Landscapes
World Nature Heritage list
CENTRAL ASIA
Cultural Landscape Index (CLI) of Western and Central European A agricultural land and B forest that characterizes rural landscapes according to landscape structure, management intensity, and value and meaning. Source: Tieskens et al. (2017).
A
B
0 — 0.25
0.25 — 0.3
0.3 — 0.35
0 — 0.2
0.2 — 0.4
0.35 — 0.4
0.4 — 0.5
0.5 — 1
0.6 — 0.8
0.8 — 1
0.4 — 0.6
143
THE REGIONAL ASSESSMENT REPORT ON BIODIVERSITY AND ECOSYSTEM SERVICES FOR EUROPE AND CENTRAL ASIA
The value placed on the protection of tangible heritage linked to nature is shown in UNESCO’s World Heritage List in 2015, comprising 1,031 properties of which 22% were natural sites (Osipova et al., 2014). Currently, 23.5% of these protected natural sites are located in Europe and Central Asia, with an unequal distribution among subregions (see Figure 2.64). Tangible heritage linked to cultural landscapes in Western, Central and Eastern Europe is also recognized in UNESCO’s “list of cultural landscapes” (Besio, 2003). 51% of the landscapes in the UNESCO list (i.e. 49 landscapes) are situated in Europe and Central Asia, but again with uneven distribution among subregions (see Figure 2.65). Yet, tangible heritage linked to European cultural landscapes is increasingly threatened by land-use intensification and abandonment (Tieskens et al., 2017) that derive from cultural, political and economic drivers of change (see Chapter 4) (Plieninger et al., 2016). The decreasing trends of the cultural and local identity associated with these landscapes, as well as the emotional attachment of Western and Central European people to these landscapes, is also acknowledged by indigenous and local knowledge holders (supporting material Appendix 2.230). The Convention for the Safeguarding of the Intangible Cultural Heritage is the international agreement that aims to acknowledge and protect intangible heritage. Out of 130 elements of intangible heritage from countries in Europe and Central Asia currently inscribed on the List of Intangible Cultural Heritage (UNESCO, 2003), 53 are directly linked to nature. They are linked to both the direct use of animals (e.g. falconry, and horse-riding games) and plants, or draw on the natural environment as a source of inspiration for songs, poetry and handicrafts. Despite the value and protection of intangible and tangible heritage linked to nature, it continues to be threatened. In Western, Central and Eastern Europe, 30% of natural World Heritage sites are of significant concern (Osipova et al., 2014) and five protected sacred natural sites in Europe and Central Asia are threatened (one in Central Europe, one in Eastern Europe, two in Western Europe and one in Central Asia).
2.3.4 Environmental equity and justice 2.3.4.1 Framing equity and justice Aspects of equity and justice associated with nature’s contributions to people relate to questions of who benefits from them (Daw et al., 2011; McDermott et al., 2013), 30. Available at https://www.ipbes.net/sites/default/files/eca_ch_2_ appendix_2.2_ilk_content_of_ncp.pdf
144
who bears the costs of a change in the provision of these contributions due to trade-offs (Bennett et al., 2009; Howe et al., 2014), who decides how societies influence the provision of the contributions (Berbés-Blázquez et al., 2016), who is recognized in these decisions (Martin et al., 2016; ZafraCalvo et al., 2017) and whose needs are fulfilled by nature’s contributions to people (Chan et al., 2012; Jax et al., 2013). Equity is associated with fairness and justice (Konow, 2003; McDermott et al., 2013; Pascual et al., 2010). Fairness is often defined as the shared, dynamically constructed view of a given social group of distributive justice (Pascual et al., 2010; Schokkaert & Devooght, 2003). The term justice refers here to fundamental moral rights and obligations. The term equity is used to evaluate comparatively the relationships between particular groups in society. Distributive equity and justice focuses on the fair allocation, among individuals within a social group or among stakeholders, of costs (see Box 2.5) and benefits resulting from any management decision or action (McDermott et al., 2013). Procedural equity and justice, in the context of the present assessment, relates to the procedural aspects of decisions on ecosystem management. It is assessed in terms of the degree of recognition, representation, involvement and inclusiveness in decision-making of different societal groups, determined e.g. by cultural identities, level of education and gender (Berbés-Blázquez et al., 2016; McDermott et al., 2013; Pascual et al., 2010; Pascual et al., 2014). Distributive justice and equity regarding the benefits derived from nature’s contributions to people and harms from a loss of these contributions have a spatial component, as changes in ecosystems providing them will have uneven geographical impacts linked to where beneficiaries live (Liu et al., 2016), see Section 2.1.2. There is also a temporal component (Jax et al., 2013) as ecosystem service utilization today may destroy the basis for future service provision (Section 2.2.3.4).
2.3.4.2 Intra-generational distributive equity and justice Nature’s material contributions to people are often commodities traded in (global) markets. On the one hand, distributional equity and justice reflects the distribution of access to markets (UNEP, 2004). On the other hand, distributive equity and justice are influenced by global patterns in the distribution of benefits and costs from the production and consumption of nature’s material contributions (such as biofuels, soy for animal feed, timber, pharmaceutical products from wild and domesticated biodiversity) (Section 2.2.4). Whereas access to safe and adequate drinking water is generally well secured in Europe, people in Central Asia, especially children, bear disproportionate environmental
CHAPTER 2. NATURE’S CONTRIBUTIONS TO PEOPLE AND QUALITY OF LIFE
5 Human-wildlife conflicts (additional references can be found in supporting material Appendix 2.3*).
Box 2
Certain species cause human-wildlife conflicts and raise justice concerns in terms of the distribution of their damages (Jacobsen & Linnell, 2016). Human-wildlife conflicts in Europe and Central Asia are reported related to carnivores, mainly wolves (Canis lupus), brown bears (Ursus arctos) and European lynxes (Lynx lynx) (e.g. Imbert et al., 2016; Knarrum et al., 2006; Mattisson et al., 2015; Rigg et al., 2011), although conflicts with meso-carnivores (e.g. European badgers (Meles meles) and red foxes (Vulpes vulpes)) are also reported in Western Europe (Baker et al., 2008; Delibes-Mateos et al., 2013). The most frequent conflicts in Eastern, Central and Western Europe (no
available data for Central Asia) are those related with damage to livestock and domestic animals (Kovařík et al., 2014), damage to game species (Lozano et al., 2013) and attacks on humans (Sahlén et al., 2015). Other mammal species, such as moose (Alces alces) and wild boars (Sus scrofa), cause damage to agriculture and forest plantations (Horne & Petäjistö, 2003; Schley et al., 2008). Many alien insect and mite species cause nuisances as pests of agriculture, horticulture, stored products and forestry (Kenis & Branco, 2010; Roques et al., 2009). * Available at https://www.ipbes.net/sites/default/files/eca_ ch_2_appendix_2.3_extra-references.pdf
threats to their health due to a lack of access to safe drinking water – with the Aral Sea region and rural areas in Tajikistan being specific problem areas (see Section 2.3.1.3) (Carpenter et al., 2006).
Convention on Biological Diversity, several countries mention how health equality is influenced by human interactions with nature’s contributions and biodiversity (see supporting material Appendix 2.831).
Urban green space can provide different regulating contributions such as prevention of urban heat islands, air quality regulation and noise reduction (Konijnendijk et al., 2013). Its distribution has been shown to differ across a city resulting in lower access in residential areas with specific ethnic groups (Comber et al., 2008) or a high proportion of immigrants (Kabisch & Haase, 2014).
In several countries in Europe and Central Asia, people have public access to forests that provide recreational experiences, but the uneven distribution of access raises justice issues. A high level (98-100%) of forests and wooded land were reported in 2010 as available for recreational purposes in Nordic and some Baltic countries as well as in several Central Europe countries including Bosnia and Herzegovina, Slovenia and Serbia. Lower levels of availability are found in some Western European countries such as UK (46%) and France (25%) (Forest Europe, 2015). The free use of some non-timber forest products is mostly allowed in Nordic countries as well as some other countries with high forest cover, and allowed to some extent in other countries. In some cases permission or payment is required (e.g. private forests in Croatia, France, UK, Turkey) (Bauer et al., 2004).
Regarding flood regulation and flood protection measures (Section 2.2.1.6), a socio-economic investigation within the flood plains of England and Wales revealed significant inequalities in the distribution of flooding risk between the middle classes and less privileged groups (working classes, unemployed classes) – with inequality being especially influential in exposure to flooding risk within the tidal flood plains and in the Eastern regions of England (Benzie, 2014; Fielding, 2007, 2012; Walker & Burningham, 2011). Nature’s non-material contributions to people, in particular recreation, can be distributed unevenly across social groups. In the UK protected areas are largely enjoyed by older people and men, while minorities are underrepresented in the use of protected areas, and hence the more privileged people benefit (Booth et al., 2010). Access to green space in cities provides opportunities for recreational experiences, but urban green space is distributed unequally within cities, leading to potential injustice (Comber et al., 2008; Kabisch & Haase, 2014). Access to green space in cities differs across Europe, with more green space available to residents in cities in northern, western and central parts of the European Union than in cities in the south (Kabisch et al., 2016). Access to green recreational areas reduced inequality in mental well-being in the Europe Union (Mitchell et al., 2015). In Europe and Central Asia national reports to the
2.3.4.3 Intergenerational distributive equity and justice Intergenerational equity and justice require the maintenance of resilient and productive ecosystems for the future provision of nature’s contributions to people (Davidson, 2012; Glotzbach & Baumgärtner, 2012; Jax et al., 2013). This capacity of ecosystems, “maintenance of options”, is considered an overarching contribution category. Regarding intergenerational equity there are philosophical and practical arguments for an absolute sufficientarian threshold (Page, 2007), which defines a minimum level of ecosystem services that every future person is presumed to need for good 31. Available at https://www.ipbes.net/sites/default/files/eca_ch_2_ appendix_2.8_assessment_of_health.pdf
145
THE REGIONAL ASSESSMENT REPORT ON BIODIVERSITY AND ECOSYSTEM SERVICES FOR EUROPE AND CENTRAL ASIA
quality of life. Regarding intergenerational equity in the distribution of beneficial contributions from nature to people, the sufficientarian threshold can be translated into a criterion for society to keep a constant stock of intact ecosystems (Ekins et al., 2003) and a dynamic criterion of ecosystem resilience. The first criterion has been operationalized by general principles of sustainability (Daly, 1992) and specified principles, such as sufficiency, efficiency and persistence for the context of nature’s contributions to people (Schröter et al., 2017). The ecosystem resilience criterion captures the reliability of future provision of (life-sustaining) contributions. It has been operationalized into policy-relevant principles for enhancing the resilience of desired contributions, such as maintaining biodiversity and redundancy (Biggs et al., 2012) and into the concept of safe operating space in the global context (Rockström et al., 2009; Steffen et al., 2015). An example of putting intergenerational equity into policy practice is the Swedish generational goal which was adopted by the Swedish Parliament in 2010 (Government of Sweden, 2014). The goal is to pass on to the next generation a society in which the major environmental problems have been solved, ensuring that ecosystems recover, biodiversity and the natural and cultural environment are preserved, promoted and used sustainably.
2.3.4.4 Procedural equity and justice Distributive justice regarding nature’s contributions to people and biodiversity is linked to historical injustices, i.e. historically determined unequitable distribution of property rights on which access rights to nature’s contributions are frequently based (Berbés-Blázquez et al., 2016). Historically, certain societal groups have been absent from decisionmaking arenas. Indigenous and local knowledge holders, such as farmers, indigenous communities, elders and women, are frequently among those whose participation is not sought or whose perceptions of nature-society relationships might differ from those who formulate and implement policy. This “procedural inequity” can result in trade-offs between nature’s contributions to people that contribute to the well-being of some at the expense of others’ (e.g. Daw et al., 2015). The fact that certain social agents such as indigenous and local knowledge holders are not represented in decision-making can entail distributional inequity in the access and use of nature’s contributions to people (Felipe-Lucia et al., 2015) and can result in social conflicts (Kovács et al., 2015). The Aarhus convention on access to environmental information promotes public participation in decisionmaking and access to justice in environmental matters, which can be supportive to procedural empowerment granted to NGOs (De Santo, 2011). There are, however, large differences in terms of access to information and participation in decision-making, both nationally and
146
regionally, with Western Europe being the most advanced (Mauerhofer, 2016). A UK case study shows the importance of early stakeholder participation: planning proposals not involving stakeholders at an early stage came to a halt and had to be changed due to stakeholder objections (Lange & Hehl-Lange, 2011). Procedural justice is also influenced by levels of empowerment defined as “enhancing an individual’s or group’s capacity to make effective choices, effective in the sense of enabling them to transform those choices into desired actions and outcomes” (Alsop & Heinsohn, 2005). Key elements of empowerment are personal agency (the capacity to make meaningful choices) and opportunity structure (the formal and informal institutional contexts within which actors operate). Ecosystem management approaches have been shown to contribute to the empowerment of marginalized groups through increased knowledge and gaining a political voice (Charron, 2012). Deer management in Scotland through collaborative governance has the potential to help reconcile statutory obligations with stakeholder empowerment (Davies & White, 2012). In Poland the institutional context of urban greening has led to social empowerment failures: society perceives other issues as more pressing, trees are perceived as a problem, and there is a lack of knowledge on the possibilities of preventing tree damage (Kronenberg, 2015).
2.3.5 Valuing nature’s contributions to people The importance of nature’s contributions to people can be measured from different value framings, including economic and socio-cultural value domains (Martín-López et al., 2014; Pascual et al., 2017). A range of valuation tools can be used to elicit the different aspects of the value of nature’s contributions to people (Jacobs et al., 2017). Economic approaches are capable of eliciting the monetary value of these contributions through market-based approaches (e.g. market pricing) and non-market approaches (e.g. travel cost method, hedonic pricing or stated preference methods). Other approaches avoid using monetary calculations and instead elicit both instrumental and relational values in socio-cultural metrics (e.g. preference assessment, narratives or time use method) (Jacobs et al., 2017). While economic valuation is often framed in the so-called “total economic value” framework that captures use and non-use values (Pearce & Moran, 1994), social dominated valuation examines the importance, preferences or needs expressed by people towards nature (Chan et al., 2012). IPBES adheres to value pluralism recognizing the multiple and often conflicting valuation languages to show the multiple ways nature contributes to human well-being (Gómez-Baggethun & Martín-López, 2015; IPBES 2016). Below, we provide a synthesis of the plurality of values of nature’s contributions
CHAPTER 2. NATURE’S CONTRIBUTIONS TO PEOPLE AND QUALITY OF LIFE
Table 2
7
Values for agriculture and forestry production.
Measure
Mean $ (2017) / ha
Cereals*
Net profit
233
5
759
Dairy*
Net profit
718
14
6,443
Mixed crop*
Net profit
916
243
2,870
Sheep and Goats*
Net profit
434
79
8,438
Specialist cattle*
Net profit
381
55
1,320
Gross value added
255
14
891
Land Use
Forestry (wood supply)**
Min $ (2017) / ha
Max $ (2017) / ha
Notes: * Source: Farm Accountancy Data Network (2017) http://www.farmbusinesssurvey.co.uk/benchmarking/Default.aspx?module=FADN. Original data were converted to $ (2017) using appropriate GDP deflators and the average £ to $ exchange rate (2015) ** Source: Eurostat (2016a). Forests, forestry and logging. http://ec.europa.eu/eurostat/statistics-explained/index.php/File:Economic_indicators_for_ forestry_and_logging,_2005_and_2013.png#file. Original data were converted to $ (2017) using appropriate GDP deflators and the average € to $ exchange rate (2013).
to people across Europe and Central Asia by reviewing value evidence published over the last decade. In doing so, we advocate a value assessment framework that extends beyond conventional market-based monetary approaches to also incorporate non-market monetary and non-monetary socio-cultural values.
2.3.5.1 Market-based monetary values Market-based monetary values are predominantly focused on nature’s material contributions to people, for which a value can usually be estimated based on market prices. For example, net profits from agricultural production (across EU-28 countries) range from $233 / ha / yr (cereals) to $916 / ha / yr (mix crop), while the annual gross value added from wood supply in forests was $255 / ha / yr (Table 2.7). Other market-based monetary values include avoided costs, replacement costs, mitigation costs, which may also be used to assess a wider range of nature’s contributions to people.
2.3.5.2 Non-market monetary values Studies reporting the non-market monetary values of nature’s contributions to people in Europe and Central Asia (supporting material Appendix 2.932) are predominantly focused on Western Europe, with very little evidence found for Eastern Europe and Central Asia (Figure 2.66). There was some evidence that people in Central Europe
32. Available at https://www.ipbes.net/sites/default/files/eca_ch_2_ appendix_2.9_economic_values.pdf
have higher (standardized Int $)33 values for contributions from nature to people than those from Western Europe (supporting material Appendix 2.932). Across all countries in Europe and Central Asia, nature’s regulating contributions to people were generally the most highly valued by people for their non-market benefits (Table 2.8). Regulation of organisms detrimental to humans (median value = (2017) Int $149 / person / yr), regulation of air quality (2017 Int $127 / person / yr) and regulation of hazardous and extreme events (2017 Int $112 / person / yr) achieved the highest values. Material and non-material contributions tended to have lower non-market values, with the exception of material and assistance (2017 Int $171 / person / yr). Analysis also explored non-market values on a per hectare basis (Table 2.9), although fewer data were available for these. Again, the highest values were found for nature’s regulating contributions to people. Regulation of freshwater and coastal water quality (2017 Int $1,965 / ha / yr) and habitat creation and maintenance (2017 Int $765 / ha / yr). Non-material contributions, such as physical and psychological experiences were also highly valued (2017 Int $1,117 / ha / yr). Across units of analysis, freshwater systems (2017 Int $867 / ha / yr) and mountains (2017 Int $603 / ha / yr) were most highly valued (supporting material Appendix 2.932).
33. Following the approach adopted by The Economics of Ecosystems and Biodiversity study (TEEB, 2010), we standardized NCP monetary values to a common currency and base year (International $ 2017). The standardization procedure adjusts values elicited in a particular currency and year to a standard currency and year using appropriate GDP deflators and purchasing power parity (PPP) exchange rates.
147
THE REGIONAL ASSESSMENT REPORT ON BIODIVERSITY AND ECOSYSTEM SERVICES FOR EUROPE AND CENTRAL ASIA
Figure 2 66
Number of value data points (i.e. individual value estimates) found for each contribution from nature to people by subregion in Europe and Central Asia. Source: Own representation based on data sources shown in supporting material Appendix 2.9*.
Habitat maintenance
86
Pollination
2
1
Regulation of air quality
11
Regulation of climate
17
2 2
Regulation of ocean acidification Regulation of freshwater quantity
14
1
Regulation of freshwater and coastal water quality
48
Formation of soils
12
Regulation of hazards
10
Regulation of detrimental organisms
11
11 11
5
Energy
11
Food and feed
20
Materials
11
5
Genetic resources
9
11
3
Learning and inspiration Physical and psychological experience
62
Supporting identities
35
Maintenance of options
WESTERN EUROPE
7
3 1
45
CENTRAL EUROPE
EASTERN EUROPE
13
CENTRAL ASIA
* Available at https://www.ipbes.net/sites/default/files/eca_ch_2_appendix_2.9_economic_values.pdf
It should be noted that there was a wide range in the non-market values found for each of nature’s contributions to people (Table 2.8 and Table 2.9). The range in values reflects differences in both the scope and size of the contribution evaluated and differences in the methods used to assess the values. Caution is therefore advised with respect to directly transferring the reported values to other policy contexts, particularly where the valuation is based on fewer than five observations.
contributions, is also highly valued in social terms. Among regulating contributions, habitat maintenance and regulation of freshwater quantity and quality are also important (Figure 2.67). The highest proportion of research in social valuation of nature’s contributions to people in Western and Central Europe was undertaken in mountain grassland areas, followed by urban and semi-urban areas, cultivated areas and Mediterranean and temperate forests.
2.3.5.4 Integrating values into policy 2.3.5.3 Non-monetary values Studies reporting social-cultural values of nature’s contributions to people in Western Europe and Central Europe (see supporting material Appendix 2.734) show that non-material contributions (including physical and psychological experiences and supporting identities) are considered among the most important contributions by people in Western and Central Europe in non-monetary terms. Food and feed, an important category of material
Nature in Europe and Central Asia is important for making a wide range of contributions to people, to which they attach value. These values are expressed in multiple dimensions. Conventionally, nature’s material contributions to people have been valued through market prices. Evidence from Europe and Central Asia demonstrates that regulating contributions have significant non-market monetary values, while non-material contributions were demonstrated to be the most valued by people in social-cultural terms.
34. Available at https://www.ipbes.net/sites/default/files/eca_ch_2_ appendix_2.7_assessment_references_synthetic_table.pdf
Assessments of nature’s contributions to people (for example to meet the Aichi Biodiversity Targets, Sustainable
148
CHAPTER 2. NATURE’S CONTRIBUTIONS TO PEOPLE AND QUALITY OF LIFE
Table 2
8
Value per person of nature’s contributions to people in Europe and Central Asia (2017 Int $ / person / year).
NON-MATERIAL
MATERIAL
REGULATING
All of Europe and Central Asia
Mean
Median
Minimum
Maximum
N
114.17
41.56
1.88
913.58
59
53.23
53.23
53.23
53.23
1
1
Habitat creation and maintenance
2
Pollination and dispersal of seeds and other propagules
3
Regulation of air quality
112.94
127.50
30.37
189.86
9
4
Regulation of climate
104.74
26.41
0.82
420.11
12
5
Regulation of ocean acidification
-
-
0
6
Regulation of freshwater quantity, location and timing
151.49
46.13
0.19
528.25
8
7
Regulation of freshwater and coastal water quality
104.16
65.66
0.15
938.30
51
8
Formation, protection and decontamination of soils and sediments
11.81
4.03
0.03
48.33
9
9
Regulation of hazards and extreme events
121.63
112.34
15.07
304.58
8
10
Regulation of organisms detrimental to humans
144.31
149.91
1.18
281.85
3
11
Energy
165.02
75.29
0.78
614.08
10
12
Food and feed
63.26
20.81
0.95
327.35
15
13
Materials and assistance
280.13
171.41
0.31
777.37
4
14
Medicinal, biochemical and genetic resources
138.24
33.88
4.45
844.96
11
15
Learning and inspiration
43.16
43.16
43.16
43.16
1
16
Physical and psychological experience
111.44
13.57
1.35
1,314.79
51
17
Supporting identities
127.07
53.09
1.06
1,399.60
32
18
Maintenance of options
109.66
79.39
4.34
960.13
53
-
Supporting material Appendix 2.9 (available at https://www.ipbes.net/sites/default/files/eca_ch_2_appendix_2.9_economic_values.pdf ) provides a list of data sources.
149
THE REGIONAL ASSESSMENT REPORT ON BIODIVERSITY AND ECOSYSTEM SERVICES FOR EUROPE AND CENTRAL ASIA
Table 2
9
Value per hectare of nature’s contributions to people in Europe and Central Asia (2017 Int $ / ha / year).
NON-MATERIAL
MATERIAL
REGULATING
All of Europe and Central Asia
1
Habitat creation and maintenance
2
Pollination and dispersal of seeds and other propagules
3
Mean
Median
Minimum
Maximum
N
1,387.50
765.98
0.23
15,955.53
22
.
.
.
.
0
Regulation of air quality
289.43
289.43
289.43
289.43
1
4
Regulation of climate
464.53
464.53
61.67
867.38
2
5
Regulation of ocean acidification
6
Regulation of freshwater quantity, location and timing
27.13
30.71
10.50
40.18
3
7
Regulation of freshwater and coastal water quality
3,202.54
1,965.22
1,546.62
6,095.77
3
8
Formation, protection and decontamination of soils and sediments
32.32
32.32
4.75
59.89
2
9
Regulation of hazards and extreme events
.
.
.
.
0
10
Regulation of organisms detrimental to humans
.
.
.
.
0
11
Energy
.
.
.
.
0
12
Food and feed
112.84
9.63
1.53
327.35
3
13
Materials and assistance
0.66
0.66
0.66
0.66
1
14
Medicinal, biochemical and genetic resources
.
.
.
.
0
15
Learning and inspiration
7.47
7.47
4.62
10.31
2
16
Physical and psychological experience
1,473.50
1,117.25
22.33
3,767.95
6
17
Supporting identities
684
658.77
0.71
1,392.52
3
18
Maintenance of options
0.80
0.80
0.65
0.95
2
0
Supporting material Appendix 2.9 (available at https://www.ipbes.net/sites/default/files/eca_ch_2_appendix_2.9_economic_values.pdf ) provides a list of data sources.
150
CHAPTER 2. NATURE’S CONTRIBUTIONS TO PEOPLE AND QUALITY OF LIFE
Figure 2 67
Number of publications that found each contribution from nature to people among the five most valued by people in Western and Central Europe (no data were found for Eastern Europe and Central Asia). Source: Own representation based on data sources shown in supporting material Appendix 2.7*. 0
10
20
30
40
50
Habitat maintenance Pollination Regulation of air quality Regulation of climate Regulation of freshwater quantity and quality Formation of soils Regulation of hazards
Food and feed Energy Materials Genetic resources
Learning and inspiration Physical and psychological experiences Supporting identities
WESTERN EUROPE
CENTRAL EUROPE
* Available at https://www.ipbes.net/sites/default/files/eca_ch_2_appendix_2.7_assessment_references_synthetic_table.pdf
Development Goals) should account for this plurality of values. This conclusion goes beyond the recommendations of TEEB (2010), which focused on the inclusion of nonmarket monetary values and concurs with ideas developed in the UK NEA (2011) and IPBES, which highlight the need to include social, cultural and shared values in decisionmaking through, for example, deliberation with various stakeholders (Kenter et al., 2015). We demonstrate that alternative components of values of nature’s contributions to people are expressed in different units, and therefore may not be directly compared through, for example, conventional benefit-cost analysis. Thus, researchers and policymakers require novel approaches to integrate value plurality into decision-making (Christie et al., 2012; IPBES, 2016; Kenter et al., 2016; UK NEA, 2011). One such approach is multi-stakeholder spatial decision analysis (Cerreta & Panaro, 2017). Good data on the plurality of values of nature’s contributions to people exist for Western Europe, but are lacking for Central and Eastern Europe and Central Asia. There needs to be a greater focus on reporting more standardized per unit values for these contributions, where the units are clearly specified and can be compared across contributions,
as this will facilitate (i) the assessment of the trade-offs of contributions between competing land uses, and (ii) the aggregation of values of contributions across the region.
2.4 RELEVANCE TO AICHI BIODIVERSITY TARGETS AND SUSTAINABLE DEVELOPMENT GOALS Progress towards the Sustainable Development Goals (SDGs) and the Aichi Biodiversity Targets can be evaluated through the nature’s contributions to people concept (Geijzendorffer et al., 2017). Considering the frequency with which specific contributions are mentioned in the strategies that contain these two sets of targets and goals, the direct relevance of all contributions is clear (see Figure 2.68). The top 25% most cited contributions across both strategies are the non-material contributions supporting identities (existence of species and ecosystems, and symbolic meaning of nature), the material contributions food and feed, and the regulating contributions habitat
151
THE REGIONAL ASSESSMENT REPORT ON BIODIVERSITY AND ECOSYSTEM SERVICES FOR EUROPE AND CENTRAL ASIA
Figure 2 68
Relative importance of nature’s contributions to people (NCP) for the Sustainable Development Goals (SDGs) and the Strategic Goals of the Strategic Plan for Biodiversity 2011–2020. The width of the lines indicates the frequency at which a certain contribution was mentioned in relation to a specific Sustainable Development Goal or Aichi Biodiversity Target (goals for which no relation to nature’s contributions to people was found are not shown). The colour of the lines indicates whether the specific goal is connected with regulating (green), material (grey) or non-material (purple) contribution. The size of the nodes is proportional to the number of ties that a node has. Complete names of contributions are in Table 2.1. Source: Own representation. NCP11
SDG7
NCP13 NCP10
NCP6
NCP2 Strategic Goal B SDG3 NCP8 NCP12 NCP7
SDG1
NCP14 Strategic Goal D
SDG6
Strategic Goal C
NCP1
SDG15
SDG2 NCP4
NCP3
SDG12
SDG11
NCP9 NCP17 NCP15 SDG14 SDG13
SDG4 NCP16 Strategic Goal E SDG8
NCP5
creation and maintenance and regulation of water quality (see Figure 2.68) (Geijzendorffer et al., 2017). For assessing progress towards policy goals and targets, especially Goal 2 (zero hunger) and Goal B of the Strategic Plan for Biodiversity 2011-2020 (reduce the direct pressures on biodiversity and promote sustainable use) information is required mainly on material contributions, with the latter also requiring information on regulating contributions. Information on non-material contributions are more equally needed over a range of goals and targets (Geijzendorffer et al., 2017). To interpret whether these sustainability goals are likely to be achieved, Figure 2.68 combines the information depicted
152
with the assessment of each contribution from nature to people (Section 2.2.5). According to this analysis, Europe and Central Asia is not advancing in enhancing the benefits to all people from biodiversity and ecosystem services (Strategic Goal D of the Strategic Plan for Biodiversity 2011-2020) because of the deteriorating status of many regulating and non-material contributions from nature to people (Section 2.2.5) and because the unequal access and distribution of contributions within the region (Section 2.3.4). Finally, because the practices and knowledge of indigenous peoples and local communities in Western and Central Europe have been eroded since the 1960s, the achievement of Strategic Goal E of the Strategic Plan for Biodiversity
CHAPTER 2. NATURE’S CONTRIBUTIONS TO PEOPLE AND QUALITY OF LIFE
2011-2020 (enhance implementation through participatory planning, knowledge management and capacity building) is threatened. However, it is worth noting that by including indigenous and local knowledge, the IPBES Regional Assessment for Europe and Central Asia respects, and thus contributes to, the achievement of Aichi Biodiversity Target 18 (traditional knowledge respected). Regarding the interlinkages between the status and trends of nature’s contributions to people and the achievement of the Sustainable Development Goals, it seems that some advances have been made to accomplish those related to environmental protection (Goals 13-15). Furthermore, the active contribution of multiple contributions from nature to health is supporting the achievement of Goal 3 (good health and well-being). However, the impact of biofuels and agriculture expansion on increasing land grabbing rates in other regions of the world and in Eastern Europe and Central Asia due to Western European consumption (Sections 2.2.4 and 2.3.1.1) jeopardizes the possibility of achieving Goal 2 (zero hunger), Goal 7 (affordable and clean energy) and Goal 12 (responsible consumption and production) in Europe and Central Asia. Further, future climate and land-use change are likely to exacerbate the decrease of water security (Goal 6). In fact, the number of water-stressed countries in Europe and Central Asia is projected to increase by 2030. Finally, the erosion of indigenous and local knowledge prevents some people from acquiring the relevant knowledge and skills needed to foster sustainable development and sustainable lifestyles and, thus, threatens the accomplishment of Goal 4 (quality education).
2.5 KNOWLEDGE GAPS 2.5.1 The unevenness of knowledge of nature’s contributions to people in Europe and Central Asia An important conclusion of this chapter’s assessment of the status and trends of nature’s contributions to people and their influence on quality of life is that, although there are thousands of publications and reports that are relevant to these contributions in Europe and Central Asia, a much smaller set of documents actually assess the status and trends of contributions. Furthermore, even fewer consider relationships between nature’s contributions to people and good quality of life. The studies that do exist on the status and trends of nature’s contributions to people are also uneven in their coverage of the different contributions. There are more accurate data on status and trends for material contributions, especially food and feed, than
some regulating and non-material contributions. National ecosystem assessments often seek to analyze a range of contributions, but many publications and reports focus on individual ones. Western Europe has the most published literature on the status of nature’s contributions to people and trends and their influence on the quality of life, contrasting with a very limited literature for Central Asia. Furthermore, very limited information on the status and trends in contributions is available for making comparisons between units of analysis since studies tend to focus on one or a small number of units of analysis. This conclusion, however, should be considered with caution as this chapter mostly reviewed English-language literature. The uneven coverage in the existing literature of the different contributions for nature to people and subregions of Europe and Central Asia represents a key knowledge gap identified by the chapter. The limited availability of indicators for certain of nature’s contributions to people in Europe and Central Asia is also a significant knowledge gap. Existing literature suggests indicator development for monitoring nature’s contributions to people should cover the different components of these contributions (i.e. capacity, use and value; Section 2.1.2), provide data at multiple scales and address differences in contributions use based on societal characteristics (Balvanera et al., 2017). However, according to existing studies the kind of information and indicators that are recommended for monitoring progress towards the Aichi Biodiversity Targets indicates a bias towards information related to capacity of nature’s contributions to people (Geijzendorffer et al., 2017). To implement regional and global assessment programmes of nature’s contributions to people, existing studies highlight the need for indicator data at national scale for several contributions (Balvanera et al., 2017). However, there are few indicators suitable and with available data to monitor contributions properly at the national scale (IPBES, 2017b). This chapter as a whole also confirms there is a knowledge gap regarding indicators on the use of nature’s contributions to people, demand and governance, which are less developed for the Europe and Central Asia region than capacity indicators. Even when data are available, a further knowledge gap is that data and indicators focus on certain points in time, and evidence on long-term historical and future trends is missing for many of nature’s contributions to people. For example, for physical and psychological experiences of nature, little information exists on temporal trends of recreationists and visitors to the different ecosystems and their related recreational benefits, particularly in marine systems (Jobstvogt et al., 2014; Ruiz-Frau et al., 2011) and forests (Turtiainen & Nuutinen, 2012). To be able to establish future trends in nature’s contributions to people, more work on quantitative (e.g. modelling) and qualitative projections of the impacts of different drivers is needed and a consistency
153
THE REGIONAL ASSESSMENT REPORT ON BIODIVERSITY AND ECOSYSTEM SERVICES FOR EUROPE AND CENTRAL ASIA
of methods and scenarios would facilitate comparison, within and across Europe and Central Asia subregions (Section 2.2.6). Existing analyses of monitoring and indicator development for nature’s contributions to people identify that this should also take place at the local scale, but local indicators must be consistent with those at the regional and international scale in a manner that is integrated with efforts at higher levels (Balvanera et al., 2017). For particular contributions, such as spiritual experiences or medicinal resources, methodological development and assessment may fit best to the local scale, due to the importance of local differences. This chapter has identified that at the local level indigenous and local knowledge on the interactions between nature’s contributions to people and quality of life should be considered alongside scientific knowledge and used for setting future management policies. There is a knowledge gap, however, relating to the recording of indigenous and local knowledge and such information needs to be collected before it disappears (see Section 2.2.3.1) for its own value and because it has a role to play in guiding societies towards sustainability. This chapter has also identified specific knowledge gaps in terms of the availability of indicator data for status and trends for the following aspects of nature’s contributions to people: Indicators of the trends in habitat creation and maintenance; a number of indicators can be used to evaluate its current state such as some key migratory and breeding species and their habitat and indigenous and local knowledge can also be used to assess the status and trends of this contribution from nature to people (see supporting material Appendix 2.235). The relationship between water use and water availability; indicator data for freshwater quantity for Eastern Europe and Central Asia is also lacking. Soil quality; encompassing its physical, chemical and biological components. Carcass removal by vertebrate and invertebrate scavengers and marine organisms (Donázar et al., 2016; Martín-Vega & Baz, 2011; Moleón & SánchezZapata, 2015). The use of medicinal resources and plants; ethnobotanical research is central to a better understanding of the medicinal potential of medicinal plants and national measures and indicators need to become comparable on an international scale, 35. Available at https://www.ipbes.net/sites/default/files/eca_ch_2_ appendix_2.2_ilk_content_of_ncp.pdf
154
regarding health, ecological, cultural, legal or socioeconomic aspects. Wildlife-based tourism; a data gap exists about accurate statistical information on the number of users developing recreational activities around wildlife (i.e. whale-watching, bird-watching). Supporting identities; there is a lack of consensus on suitable indicators but these could be developed using attitudes towards nature protection and species or ecosystem attributes or characteristics that are particularly valued for their existence (e.g. iconic, emblematic, symbolic species) Interregional flows of nature’s regulating and nonmaterial contributions to people; especially between Europe and Central Asia and other regions of the world. This chapter also highlights some significant knowledge gaps regarding the influence of nature’s contributions to people on quality of life. In particular, despite a large number of studies on the health aspects of nature’s contributions to people in Western Europe, there are still knowledge gaps on nature-human health linkages in Europe and Central Asia and other regions. The current evidence base needs expanding to illuminate the scope and complexity of biodiversity-health relationships and their importance to health outcomes. More knowledge is needed on the degree to which social, cultural and economic factors influence the relationship between biodiversity, nature’s contributions to people, and human health outcomes including the ways in which socio-economic status, age, gender and ethnicity can mediate health risks and benefits of nature. Such research can help to illuminate how health-biodiversity relationships are framed or understood by different communities or vulnerable groups. The analysis of the relationships between nature’s contributions to people and environmental equity and justice across Europe and Central Asia has to address the different understandings in countries and communities as to what constitutes equity and justice. Partly because of these differences there is limited understanding of the plural values of nature’s contributions to people endorsed by different societal groups and genders. Moreover, there is even less empirical evidence about the inequities emerging from the different control over and access to these contributions (Bennett et al., 2015). This knowledge is essential to understand fully how these contributions are likely to contribute to the quality of life of different societal groups and regions.
CHAPTER 2. NATURE’S CONTRIBUTIONS TO PEOPLE AND QUALITY OF LIFE
2.5.2 The challenges of knowledge generation on nature’s contributions to people This chapter has indicated that if status and trends in nature’s contributions to people and their impact on quality of life are to be better understood across Europe and Central Asia, four key changes are required in approaches to knowledge generation on these contributions. First, there is a need for agreed methods that allow comparison of results and syntheses. Each of nature’s contributions to people is often studied and described in different ways and for different units of analysis, which makes it challenging to summarize status and trends for a region. For example, for the regulation of water quality, the large uncertainty in measurements and the absence of consensus on the most appropriate methods for its quantification make its assessment difficult (Clec’h et al., 2016; Grizzetti et al., 2012). Second, there is a need for integrative approaches that assess the multiple benefits derived from a particular contribution from nature to people. For example, it is widely recognized that pollinators and animal-pollinated plants provide benefits not only as food and feed, but also through medicinal and symbolic plants, fibres (e.g. cotton), construction materials (e.g. some timbers), aesthetically significant landscapes (e.g. flower meadows), musical instruments (e.g. bees wax used for violins), and as sources of inspiration for art, music, literature, traditions, education and technology throughout Europe and Central Asia (IPBES, 2016). This information on pollinators was compiled for a specific IPBES assessment on the topic, and such evidence is not available for many other contributions from nature to people.
Third, there is limited empirical evidence on how individual contribution from nature s to people can contribute to the different dimensions of quality of life. For example, there is only empirical evidence in Western Europe about how nature-based tourism can contribute to physical and mental health, but comprehensive information about its contributions to food security, cultural heritage and identity is missing for the whole of Europe and Central Asia. Finally, there is a need for more integrated approaches to the development of knowledge regarding nature’s contributions to people that involve multiple social actors, including indigenous and local knowledge holders. For example, in the case of medicinal resources, there is a need for a much more rigorous multidisciplinary sciencedriven approach to local and traditional medicines, which also empowers the local keepers of this knowledge and their users (Leonti & Casu, 2013). More integrated research approaches would be beneficial to better explore the knowledge and health potential of medicinal plants. It is essential to ensure that bioprospecting preserves traditional knowledge systems, and works with local communities in a manner that protects those values and protects habitats and species. Involving communities in the sustainable use of biodiversity may also provide important opportunities for local enterprise, and support the continuance of local cultural traditions. This requires direct engagement and collaboration between community organizations, biotech and pharmaceutical industries, national institutes of health and medicine, conservationists, and research funding agencies.
155
THE REGIONAL ASSESSMENT REPORT ON BIODIVERSITY AND ECOSYSTEM SERVICES FOR EUROPE AND CENTRAL ASIA
REFERENCES Abdolvand, B., Mez, L., Winter, K., Mirsaeedi-Gloßner, S., Schütt, B., Rost, K. T., & Bar, J. (2014). The dimension of water in Central Asia: Security concerns and the long road of capacity building. Environmental Earth Sciences, 73(2), 897–912. http://doi.org/10.1007/s12665014-3579-9 Abdullaev, I., & Rakhmatullaev, S. (2016). Setting up the agenda for water reforms in Central Asia: Does the nexus approach help? Environmental Earth Sciences, 75, 870. http://doi.org/10.1007/s12665-0165409-8 Acácio, V., & Holmgren, M. (2014). Pathways for resilience in Mediterranean cork oak land use systems. Annals of Forest Science, 71, 5–13. http://doi.org/10.1007/ s13595-012-0197-0 Acreman, M., Fisher, J., Stratford, C., Mould, D., & Mountford, J. (2007). Hydrological science and wetland restoration: Some case studies from Europe. Hydrology and Earth System Sciences, 11, 158–169. http://doi. org/10.5194/hess-11-158-2007
pollinators? Lessons from long-term trends in crop production. Annals of Botany 103(9), 1579–1588. http://doi.org/10.1093/aob/ mcp076 Aizen, M. A., & Harder, L. D. (2009). The global stock of domesticated honey bees is growing slower than agricultural demand for pollination. Current Biology, 19(11), 915–918. http://doi.org/10.1016/j. cub.2009.03.071 Akker, J. van den, Berglund, K., & Berglund, O. (2016). Decline in organic matter in peatsoils. In J. Stolte, M. Tesfai, L. Øygarden, S. Kværnø, J. Keizer, F. Verheijen, P. Panagos, C. Ballabio, & R. Hessel (Eds.), Soil threats in Europe. Status, methods, drivers and effects on ecosystem services (pp.39-54). Luxemburg: JRC Technical Reports. Alcamo, J., van Vuuren, D., Ringler, C., Cramer, W., Masui, T., Alder, J., & Schulze, K. (2005). Changes in nature’s balance sheet: Model-based estimates of future worldwide ecosystem services. Ecology and Society, 10(2), 19.
Adeishvili, M. (2015). Regional-level analysis of the outcomes of the TEEB scoping studies for the forestry sectors of Armenia, Azerbaijan and Georgia.
Alexander, K., & West, J. (2011). Water. In P. Storer, J. Cribb, & K. Hosking (Eds.), Resource efficiency in Asia and the Pacific (pp 85-104). Bangkok, Thailand: United Nations Environment Programme.
Agbenyega, O., Burgess, P. J., Cook, M., & Morris, J. (2009). Application of an ecosystem function framework to perceptions of community woodlands. Land Use Policy, 26(3), 551–557. http://doi. org/10.1016/j.landusepol.2008.08.011
Allen, D., Bilz, M., Leaman, D. J., Miller, R. M., Timoshyna, A., & Window, J. (2014). European red list of medicinal plants. Luxembourg: Publications Office of the European Union. http://doi. org/10.2779/907382
Ahtiainen, H., Artell, J., Czajkowski, M., Hasler, B., Hasselström, L., Hyytiäinen, K., Meyerhoff, J., Smart J. C. R, Söderqvist, T., Zimmer, K., Khaleeva, J., Rastrigina, O., Tuhkanen, H. (2013). Public preferences regarding use and condition of the Baltic Sea - An international comparison informing marine policy. Marine Policy, 42, 20–30. http://doi.org/10.1016/j. marpol.2013.01.011
Allen, K. A., Lehsten, V., Hale, K., & Bradshaw, R. (2016). Past and future drivers of an unmanaged carbon sink in European temperate forest. Ecosystems, 19(3), 545–554. http://doi.org/10.1007/ s10021-015-9950-1
Aizen, M. A., Garibaldi, L. A., Cunningham, S. A., & Klein, A. M. (2009). How much does agriculture depend on
156
Alsop, R., & Heinsohn, N. (2005). Measuring empowerment in practice: Structuring analysis and framing indicators. Retrieved from https://elibrary.worldbank. org/doi/abs/10.1596/1813-9450-3510#
Angelstam, P., Grodzynskyi, M., Andersson, K., Axelsson, R., Elbakidze, M., Khoroshev, A., Kruhlov, I., & Naumov, V. (2013). Measurement, collaborative learning and research for sustainable use of ecosystem services: Landscape concepts and Europe as laboratory. Ambio, 42(2), 129–145. http:// doi.org/10.1007/s13280-012-0368-0 Anić, I., Meštrović, S., & Matić, S. (2012). Important events in the history of forestry in Croatia. Sumarski List, 136(3–4), 169–177. Animesh, K. G., Carlo, G., & Yoshihide, W. (2016). Measuring global water security towards sustainable development goals. Environmental Research Letters, 11(12), 124015. http://doi. org/10.1088/1748-9326/11/12/124015 APCOR. (2009). Anuário. Yearbook. Retrieved from http://www.apcor.pt/en/ portfolio-posts/apcor-year-book-2009/ April, W. G., Carvell, A. C., Isaac, N., Jitlal, M., Peyton, J., Powney, G., Roy, D., Vanbergen, A., O’Connor, R., Jones, C., Kunin, B., Breeze, T., Garratt, M., Potts, S., Harvey, M., Ansine, J., Comont, R., Lee, P., Edwards, M., Roberts, S., Morris, R, Musgrove, A., Brereton, T., Hawes, C, & Roy, H. (2016). Design and testing of a national pollinator and pollination monitoring framework. Aps, R., Sharp, R., & Kutunova, T. (2004). Freshwater fisheries in Central and Eastern Europe: overview report. R. Aps, R. Sharp, & T. Kutunova (Eds.). Warsaw, Poland: IUCN. Araújo, R. M., Assis, J., Aguillar, R., Airoldi, L., Bárbara, I., Bartsch, I., Bekkby, T., Christie, H., Davoult, D., Derrien-Courtel, S., Fernandez, C., Fredriksen, S., Gevaert, F., Gundersen, H., Le Gal, A., Lévêque, L., Mieszkowska, N., Norderhaug, K. M., Oliveira, P., Puente, A., Rico, J. M., Rinde, E., Schubert, H., Strain, E. M., Valero, M., Viard, F, & Sousa-Pinto, I. (2016). Status, trends and drivers of kelp forests in Europe: an expert assessment. Biodiversity and Conservation, 25(7),
CHAPTER 2. NATURE’S CONTRIBUTIONS TO PEOPLE AND QUALITY OF LIFE
1319–1348. http://doi.org/10.1007/s10531016-1141-7 Armson, D., Stringer, P., & Ennos, A. R. (2012). The effect of tree shade and grass on surface and globe temperatures in an urban area. Urban Forestry and Urban Greening, 11(3), 245–255. http://doi. org/10.1016/j.ufug.2012.05.002 Arriaza, M., Cañas-Ortega, J. F., Cañas-Madueño, J. A., & Ruiz-Aviles, P. (2004). Assessing the visual quality of rural landscapes. Landscape and Urban Planning, 69(1), 115–125. http://doi. org/10.1016/j.landurbplan.2003.10.029 Arrigo, K. R., van Dijken, G., & Pabi, S. (2008). Impact of a shrinking Arctic ice cover on marine primary production. Geophysical Research Letters, 35(19), L19603. http:// doi.org/10.1029/2008GL035028 Artun, E. (1990). Tekirdağ’da Hıdrellez Geleneği. Halk Kültüründen Derlemeler [The Hidrellez Tradition in Tekirdağ. Collections from Folk Culture]. Hıdrellez Özel Sayısı [Hıdrellez Special Issue], 1–23. Asam, C., Hofer, H., Wolf, M., Aglas, L., & Wallner, M. (2015). Tree pollen allergens - An update from a molecular perspective. Allergy: European Journal of Allergy and Clinical Immunology, 70(10), 1201–1211. http://doi.org/10.1111/all.12696 Azcarate, F. M., Robleño, I., Seoane, J., Manzano, P., & Peco, B. (2013). Drove roads as local biodiversity reservoirs: effects on landscape pattern and plant communities in a Mediterranean region. Applied Vegetation Science, 16, 480–490. http://doi.org/10.1111/avsc.12003 Baker, S. E., Ellwood, S. A., Slater, D., Watkins, R. W., & Macdonald, D. W. (2008). Food aversion plus odor cue protects crop from wild mammals. Journal of Wildlife Management, 72(3), 785–791. http://doi.org/10.2193/2005-389 Balmford, A., Green, J. M. H., Anderson, M., Beresford, J., Huang, C., Naidoo, R., Walpole, M., & Manica, A. (2015). Walk on the wild side: Estimating the global magnitude of visits to protected areas. PLoS Biology, 13(2), e1002074. http://doi. org/10.1371/journal.pbio.1002074
Balvanera, P., Quijas, S., Karp, D. S., Ash, N., Bennett, E. M., Boumans, R., Brown, C., Chan, K. M. A., ChaplinKramer, R., Halpern, B. J., HoneyRosés, J., Kim, C.-K., Cramer, W., Martínez-Harms, M. J., Mooney, H., Mwampamba, T., Nel, J., Polasky, S., Reyers, B., Roman, J., Turner, W., Scholes, R. J., Tallis, H., Thonicke, K., Villa, F., Walpole, M., & Walz, A. (2017). Ecosystem services. In M. Walters & R. J. Scholes (Eds.), The GEO handbook on biodiversity observation networks (pp. 39–78). Cham: Springer International Publishing. http://doi.org/10.1007/978-3319-27288-7_3 Barata, A. M., Rocha, F., Lopes, V., & Carvalho, A. M. (2016). Conservation and sustainable uses of medicinal and aromatic plants genetic resources on the worldwide for human welfare. Industrial Crops and Products, 88, 8–11. http://doi. org/10.1016/j.indcrop.2016.02.035 Baró, F., Chaparro, L., GómezBaggethun, E., Langemeyer, J., Nowak, D. J., & Terradas, J. (2014). Contribution of ecosystem services to air quality and climate change mitigation policies: The case of urban forests in Barcelona, Spain. Ambio, 43(4), 466–479. http://doi.org/10.1007/ s13280-014-0507-x Baró, F., Palomo, I., Zulian, G., Vizcaino, P., Haase, D., & Gómez-Baggethun, E. (2016). Mapping ecosystem service capacity, flow and demand for landscape and urban planning: A case study in the Barcelona metropolitan region. Land Use Policy, 57, 405–417. http://doi. org/10.1016/j.landusepol.2016.06.006 Barua, M. (2011). Mobilizing metaphors: The popular use of keystone, flagship and umbrella species concepts. Biodiversity and Conservation, 20(7), 1427–1440. http://doi. org/10.1007/s10531-011-0035-y Bauer, J., Kniivilä, M., & Schmithüsen, F. (2004). Forest legislation in Europe: How 23 countries approach the obligation to reforest, public access and use of nonwood forest products. Geneva, Switzerland: United Nations. Beasley, D. W. C., McAuley, A. J., & Bente, D. A. (2015). Yellow fever virus: Genetic and phenotypic diversity and implications for detection, prevention
and therapy. Antiviral Research, 115, 48–70. http://doi.org/10.1016/j. antiviral.2014.12.010 Beaumont, N. J., Austen, M. C., Atkins, J. P., Burdon, D., Degraer, S., Dentinho, T. P., Derous, S., Holm, P., Horton, T., van Ierland, E., Marboe, A. H., Starkey, D. J., Townsend, M., & Zarzycki, T. (2007). Identification, definition and quantification of goods and services provided by marine biodiversity: Implications for the ecosystem approach. Marine Pollution Bulletin, 54(3), 253–265. http://doi. org/10.1016/j.marpolbul.2006.12.003 Beck, M. W., Heck, K. L., Able, K. W., Childers, D. L., & Eggleston, D. B., Gillanders, B. M., Halpern, B., Hays, C. G., Hoshino, K., Minello, T. J., Orth, R. J., Sheridan, P. F., & Weinstein, M. P. (2001). The identification, conservation, and management of estuarine and marine nurseries for fish and invertebrates: A better understanding of the habitats that serve as nurseries for marine species and the factors that create site-specific variability in nursery quality will improve conservation and management of these areas. Bioscience, 51(8), 633-641. https://doi. org/10.1641/0006-3568(2001)051[0633:TI CAMO]2.0.CO;2 Bell, S., Fox-Kämper, R., Keshavarz, N., Benson, M., Caputo, S., Noori, S., & Voigt. A. (Eds.). (2016). Urban allotment gardens in Europe. London, UK and New York, USA: Routledge. Bell, S., Tyrväinen, L., Sievänen, T., Pröbstl, U., & Simpson, M. (2007). Outdoor recreation and nature tourism: A European perspective. Living Reviews in Landscape Research, 1(2). http://doi. org/10.12942/lrlr-2007-2 Bendt, P., Barthel, S., & Colding, J. (2013). Civic greening and environmental learning in public-access community gardens in Berlin. Landscape and Urban Planning, 109(1), 18–30. http://doi. org/10.1016/j.landurbplan.2012.10.003 Bennett, E. M., Cramer, W., Begossi, A., Cundill, G., Díaz, S., Egoh, B. N., Geijzendorffer, I. R., Krug, C. B., Lavorel, S., Lazos, E., Lebel, L., MartínLópez, B., Meyfroidt, P., Mooney, H. A., Nel, J. L., Pascual, U., Payet, K., Harguindeguy, N. P., Peterson, G.
157
THE REGIONAL ASSESSMENT REPORT ON BIODIVERSITY AND ECOSYSTEM SERVICES FOR EUROPE AND CENTRAL ASIA
D., Prieur-Richard, A. -H., Reyers, B., Roebeling, P., Seppelt, R., Solan, M., Tschakert, P., Tscharntke, T., Turner, B. L., Verburg, P. H., Viglizzo, E. F., White, P. C. L., & Woodward, G. (2015). Linking biodiversity, ecosystem services, and human well-being: Three challenges for designing research for sustainability. Current Opinion in Environmental Sustainability, 14, 76–85. http://doi.org/10.1016/j.cosust.2015.03.007 Bennett, E. M., Peterson, G. D., & Gordon, L. J. (2009). Understanding relationships among multiple ecosystem services. Ecology Letters, 12(12), 1394–1404. http://doi.org/10.1111/j.14610248.2009.01387.x Bentsen, N. S., & Felby, C. (2012). Biomass for energy in the European Union - a review of bioenergy resource assessments. Biotechnology for Biofuels, 5, 25. http://doi.org/10.1186/1754-6834-5-25 Benzie, M. (2014). Social justice and adaptation in the UK. Ecology and Society, 19(1), 39. http://doi.org/10.5751/ES-06252190139 Benziger, C. P., Roth, G. A., & Moran, A. E. (2016). The global burden of disease study and the preventable burden of NCD. Global Heart, 11(4), 393–397. http://doi. org/10.1016/j.gheart.2016.10.024 Berbés-Blázquez, M., González, J. A., & Pascual, U. (2016). Towards an ecosystem services approach that addresses social power relations. Current Opinion in Environmental Sustainability, 19, 134–143. http://doi.org/10.1016/j.cosust.2016.02.003 Berkes, F., Kislalioglu, M., Folke, C., & Gadgil, M. (1998). Exploring the basic ecological unit: Ecosystem-like concepts in traditional societies. Ecosystems, 1(5), 409–415. http://doi.org/10.1007/ s100219900034 Bernstein, A. (2015). Biodiversity and biomedical discovery. In WHO & CBD, Connecting global priorities: Biodiversity and human health: A state of knowledge review (pp. 164-169). http://doi.org/10.13140/ RG.2.1.3679.6565 Berthold, P., Fiedler, W., Schlenker, R., & Querner, U. (1998). 25-year study of the population development of Central European songbirds: A general decline,
158
most evident in long-distance migrants. Naturwissenschaften 85, 350–353. http:// doi.org/10.1007/s001140050514 Bertocci, I., Araújo, R., Oliveira, P., & Sousa-Pinto, I. (2015). Potential effects of kelp species on local fisheries. Journal of Applied Ecology, 52, 1216–1226. http://doi. org/10.1111/1365-2664.12483 Besio, M. (2003). Conservation planning: The European case of rural landscapes. In Cultural landscapes: The challenges of conservation (pp. 60–68). Paris, France: UNESCO. Biggs, R., Schlüter, M., Biggs, D., Bohensky, E. L., BurnSilver, S., Cundill, G., Dakos, V., Daw, T. M., Evans, L. S., Kotschy, K., Leitch, A. M., Meek, C., Quinlan, A., Raudsepp-Hearne, C., Robards, M. D., Schoon, M. L., Schultz, L., & West, P. C. (2012). Toward principles for enhancing the resilience of ecosystem services. Annual Review of Environment and Resources, 37(1), 421–448. http://doi.org/10.1146/annurevenviron-051211-123836 Bioforsk. (2012). The Norwegian seaweed industry. Bizikova, L., Nijnik, M., & KluvankovaOravska, T. (2012). Sustaining multifunctional forestry through the developing of social capital and promoting participation: A case of multiethnic mountain communities. Small-Scale Forestry, 11(3), 301–319. http://doi.org/10.1007/s11842011-9185-8 Blackwell, M. S. A., & Pilgrim, E. S. (2011). Ecosystem services delivered by small-scale wetlands. Hydrological Sciences Journal, 56(8), 1467–1484. http://doi.org/10 .1080/02626667.2011.630317 Blanco, G. (2014). Can livestock carrion availability influence diet of wintering red kites? Implications of sanitary policies in ecosystem services and conservation. Population Ecology, 56(4), 593–604. http://doi.org/10.1007/s10144-014-0445-2 Bocharnikov, V., Laletin, A., Angelstam, P., Domashov, I., Elbakidze, M., Kaspruk, O., Sayadyan, H., Solovyi, I., Shukurov, E., Urushadze, T. (2012). Russia, Ukraine, the Caucasus, and Central Asia. In J. Parrotta & R. Trosper
(Eds.), Traditional forest-related knowledge (pp. 251–279). Dordrecht, The Netherlands: Springer. http://doi.org/10.1007/978-94007-2144-9_7 Boerema, A., Rebelo, A. J., Bodi, M. B., Esler, K. J., & Meire, P. (2017). Are ecosystem services adequately quantified? Journal of Applied Ecology, 54(2), 358-370. http://doi.org/10.1111/1365-2664.12696 Bolund, P., & Hunhammar, S. (1999). Ecosystem services in urban areas. Ecological Economics, 29(2), 293–301. http://doi.org/10.1016/S09218009(99)00013-0 Bolzoni, L., Rosà, R., Cagnacci, F., & Rizzoli, A. (2012). Effect of deer density on tick infestation of rodents and the hazard of tick-borne encephalitis. II: Population and infection models. International Journal for Parasitology, 42(4), 373–381. http://doi. org/10.1016/j.ijpara.2012.02.006 Bombelli, P., Howe, C. J., & Bertocchini, F. (2017). Polyethylene bio-degradation by caterpillars of the wax moth Galleria mellonella. Current Biology, 27(8), R292–R293. http://doi.org/10.1016/j. cub.2017.02.060 Booth, J. E., Gaston, K. J., & Armsworth, P. R. (2010). Who benefits from recreational use of protected areas? Ecology and Society, 15(3), 19. Borrelli, P., Ballabio, C., Panagos, P., & Montanarella, L. (2014). Wind erosion susceptibility of European soils. Geoderma, 232–234, 471–478. http://doi. org/10.1016/j.geoderma.2014.06.008 Borucke, M., Moore, D., Cranston, G., Gracey, K., Iha, K., Larson, J., Lazarus, E., Morales, J. C., Wackernagel, M., & Galli, A. (2013). Accounting for demand and supply of the biosphere’s regenerative capacity: The national footprint accounts’ underlying methodology and framework. Ecological Indicators, 24, 518–533. http:// doi.org/10.1016/j.ecolind.2012.08.005 Bostedt, G., Mustonen, M., & Gong, P. (2016). Increasing forest biomass supply in northern Europe – countrywide estimates and economic perspectives. Scandinavian Journal of Forest Research, 31(3), 314–322. http://doi.org/10.1080/02827581.2015.1 089930
CHAPTER 2. NATURE’S CONTRIBUTIONS TO PEOPLE AND QUALITY OF LIFE
Boström, C., Baden, S., Bockelmann, A. -C., Dromph, K., Fredriksen, S., Gustafsson, C., Krause-Jensen, D., Möller, T., Nielsen, S. L., Olesen, B., Olsen, J., Pihl, L., & Rinde, E. (2014). Distribution, structure and function of Nordic eelgrass (Zostera marina) ecosystems: implications for coastal management and conservation. Aquatic Conservation: Marine and Freshwater Systems, 24, 410–434. http://doi.org/10.1002/aqc.2424 Bottalico, F., Chirici, G., Giannetti, F., De Marco, A., Nocentini, S., Paoletti, E., Salbitano, F., Sanesi, G., Serenelli, C., & Travaglini, D. (2016). Air pollution removal by green infrastructures and urban forests in the city of Florence. Agriculture and Agricultural Science Procedia, 8, 243–251. http://doi.org/10.1016/j. aaspro.2016.02.099 Boudouresque, C. F., Bernard, G., Pergent, G., Shili, A., & Verlaque, M. (2009). Regression of Mediterranean seagrasses caused by natural processes and anthropogenic disturbances and stress: A critical review. Botanica Marina, 52(5), 395-418. http://doi.org/10.1515/ BOT.2009.057 Bouget, C., Lassauce, A., & Jonsell, M. (2012). Effects of fuelwood harvesting on biodiversity — a review focused on the situation in Europe. Canadian Journal of Forest Research, 42(8), 1421–1432. http://doi.org/10.1139/x2012-078 Bouraoui, F., & Grizzetti, B. (2014). Modelling mitigation options to reduce diffuse nitrogen water pollution from agriculture. Science of the Total Environment, 468-469, 1267–1277. http:// doi.org/10.1016/j.scitotenv.2013.07.066 Bowler, D. E., Buyung-Ali, L. M., Knight, T. M., & Pullin, A. S. (2010). A systematic review of evidence for the added benefits to health of exposure to natural environments. BMC Public Health, 10, 456. http://doi. org/10.1186/147-2458-10-456 Bradshaw, C. J. A., Sodhi, N. S., Peh, K. S. H., & Brook, B. W. (2007). Global evidence that deforestation amplifies flood risk and severity in the developing world. Global Change Biology, 13(11), 2379–2395. http://doi.org/10.1111/j.13652486.2007.01446.x
Breckle, S. W., & Wucherer, W. (2006). Vegetation of the Pamir (Tajikistan): Land use and desertification problems. In E. Spehn, C. Körner, & M. Liberman (Eds.), Land-use change and mounatin biodiversity (pp. 239–251). Boca Raton, USA: CRC Press. Breeze, T. D., Vaissière, B. E., Bommarco, R., Petanidou, T., Seraphides, N., Kozák, L., Scheper, J., Biesmeijer, J. C., Kleijn, D., Gyldenkærne, S., Moretti, M., Holzschuh, A., Steffan-Dewenter, I., Stout, J. C., Pärtel, M., Zobel, M., & Potts, S. G. (2014). Agricultural policies exacerbate honeybee pollination service supply-demand mismatches across Europe. PLoS ONE, 9(1), e82996. http://doi. org/10.1371/journal.pone.0082996 Breuste, J. H., & Artmann, M. (2015). Allotment gardens contribute to urban ecosystem service: Case study Salzburg, Austria. Journal of Urban Planning and Development, 141(3), A5014005. http://doi. org/10.1061/(asce)up.1943-5444.0000264 Brooks, T. M., Akçakaya, H. R., Burgess, N. D., Butchart, S. H. M., Hilton-Taylor, C., Hoffmann, M., Juffe-Bignoli, D., Kingston, N., MacSharry, B., Parr, M., Perianin, L., Regan, E. C., Rodrigues, A. S. L., Rondinini, C., Shennan-Farpon, Y., & Young, B. E. (2016). Analysing biodiversity and conservation knowledge products to support regional environmental assessments. Scientific Data, 3, 160007. http://doi.org/10.1038/sdata.2016.7 Buapet, P., Gullström, M., & Björk, M. (2013). Photosynthetic activity of seagrasses and macroalgae in temperate shallow waters can alter seawater pH and total inorganic carbon content at the scale of a coastal embayment. Marine and Freshwater Research, 64(11), 1040–1048. http://doi. org/10.1071/MF12124 Bugalho, M. N., Caldeira, M. C., Pereira, J. S., Aronson, J., & Pausas, J. G. (2011). Mediterranean cork oak savannas require human use to sustain biodiversity and ecosystem services. Frontiers in Ecology and the Environment, 9(5), 278–286. http://doi.org/10.1890/100084 Buhlmann, E., Wolfgramm, B., Maselli, D., Hurni, H., Sanginov, S. R., & Liniger, H. P. (2010). Geographic information system-based decision support for soil
conservation planning in Tajikistan. Journal of Soil and Water Conservation, 65(3), 151– 159. http://doi.org/10.2489/jswc.65.3.151 Bukvareva, E. N., Grunewald, K., Bobylev, S. N., Zamolodchikov, D. G., Zimenko, A. V., & Bastian, O. (2015). The current state of knowledge of ecosystems and ecosystem services in Russia: A status report. Ambio, 44(6), 491–507. http://doi. org/10.1007/s13280-015-0674-4 Burkhard, B., Kandziora, M., Hou, Y., & Müller, F. (2014). Ecosystem service potentials, flows and demands-concepts for spatial localisation, indication and quantification. Landscape Online, 34(1), 1–32. http://doi.org/10.3097/LO.201434 Buyck, C., Dudley, N., Furuta, N., Pedrot, C., Renaud, F., & SudmeierRieux, K. (2015). Protected areas as tools for disaster risk reduction. A handbook for practitioners. http://doi.org/10.1073/ pnas.0703993104 Çağlarirmak, N. (2011). Edible mushrooms: An alternative food item. Proceedings of the 7th international conference on mushroom biology and mushroom products, 548–554. Cai, X., McKinney, D., & Rosegrant, M. (2003). Sustainability analysis for irrigation water management in the Aral Sea region. Agricultural Systems, 76(3), 1043–1066. http://doi.org/10.1016/S0308521X(02)00028-8 Camps-Calvet, M., Langemeyer, J., Calvet-Mir, L., & Gómez-Baggethun, E. (2015). Ecosystem services provided by urban gardens in Barcelona, Spain: Insights for policy and planning. Environmental Science & Policy, 62, 14–23. http://doi. org/10.1016/j.envsci.2016.01.007 Capriel, P. (2013). Trends in organic carbon and nitrogen contents in agricultural soils in Bavaria (south Germany) between 1986 and 2007. European Journal of Soil Science, 64, 445–454. http://doi.org/10.1111/ejss.12054 Caraveli, H. (2000). A comparative analysis on intensification and extensification in Mediterranean agriculture: Dilemmas for LFAs policy. Journal of Rural Studies, 16(2), 231–242. http://doi.org/10.1016/S07430167(99)00050-9
159
THE REGIONAL ASSESSMENT REPORT ON BIODIVERSITY AND ECOSYSTEM SERVICES FOR EUROPE AND CENTRAL ASIA
Carlsson, J., Eriksson, L. O., Ohman, K., & Nordstrom, E.-M. (2015). Combining scientific and stakeholder knowledge in future scenario development - A forest landscape case study in northern Sweden. Forest Policy and Economics, 61, 122–134. http://doi.org/10.1016/j.forpol.2015.08.008 Carmona, C. P., Azcárate, F. M., Oteros-rozas, E., González, J. A., & Peco, B. (2013). Assessing the effects of seasonal grazing on holm oak regeneration: Implications for the conservation of Mediterranean dehesas. Biological Conservation, 159, 240–247. http://doi. org/10.1016/j.biocon.2012.11.015 Carpenter, D. O., El-Qaderi, S., Fayzieva, D., Gilani, A. H., Hambartsumyan, A., Herz, K., Isobaev, M., Kasymov, O., Kudyakov, R., Majitova, Z., Mamadov, E., Nemer, L., Revich, B., Stege, P., Suk, W., Upshur, R., Yilmaz, B., & Zaineh, K. (2006). Children’s environmental health in Central Asia and the Middle East. International Journal of Occupational and Environmental Health, 12(4), 362–368. http://doi.org/10.1179/oeh.2006.12.4.362 Carpenter, G., Kleinjans, R., Villasante, S., & O’Leary, B. C. (2016). Landing the blame: The influence of EU Member States on quota setting. Marine Policy, 64, 9–15. http://doi.org/10.1016/j. marpol.2015.11.001 Carrete, M., Sanchez-Zapata, J. A., Benitez, J. R., Lobon, M., & Donazar, J. A. (2009). Large scale risk-assessment of wind-farms on population viability of a globally endangered long-lived raptor. Biological Conservation, 142(12), 2954-2961. http://doi.org/10.1016/j. biocon.2009.07.027 Carvalho, A. M., & Frazão-Moreira, A. (2011). Importance of local knowledge in plant resources management and conservation in two protected areas from Trás-os-Montes, Portugal. Journal of Ethnobiology and Ethnomedicine, 7, 36. http://doi.org/10.1186/1746-4269-7-36 Carvalho, A. M., & Morales, R. (2010). Persistence of wild food and wild medicinal plant knowledge in a northeastern region of Portugal. In M. Pardo de Santayana, A. Pieroni, & R. Puri (Eds.), Ethnobotany in the new era: People, health and wild plant
160
resources (pp. 147–171). New York, USA and Oxford, UK: Bergham. Casado-Arzuaga, I., Madariaga, I., & Onaindia, M. (2013). Perception, demand and user contribution to ecosystem services in the Bilbao metropolitan greenbelt. Journal of Environmental Management, 129, 33–43. http://doi.org/10.1016/j. jenvman.2013.05.059 Casal, G., Sánchez-carnero, N., Sánchez-rodríguez, E., & Freire, J. (2011). Estuarine, coastal and shelf science remote sensing with SPOT-4 for mapping kelp forests in turbid waters on the south European Atlantic shelf. Estuarine, Coastal and Shelf Science, 91(3), 371–378. http:// doi.org/10.1016/j.ecss.2010.10.024 Casalegno, S., Inger, R., DeSilvey, C., & Gaston, K. J. (2013). Spatial covariance between aesthetic value & other ecosystem Services. PLoS ONE, 8(6), e68437. http:// doi.org/10.1371/journal.pone.0068437 Causarano, H. J., Doraiswamy, P. C., Muratova, N., Pachikin, K., McCarty, G. W., Akhmedov, B., & Williams, J. R. (2011). Improved modeling of soil organic carbon in a semiarid region of Central East Kazakhstan using EPIC. Agronomy for Sustainable Development, 31(2), 275–286. http://doi.org/10.1051/agro/2010028 Cerreta, M., & Panaro, S. (2017). From perceived values to shared values: A multi-stakeholder spatial decision analysis (M-SSDA) for resilient landscapes. Sustainability, 9(7), 1113. http://doi. org/10.3390/su9071113 Chan, K. M. A., Satterfield, T., & Goldstein, J. (2012). Rethinking ecosystem services to better address and navigate cultural values. Ecological Economics, 74, 8–18. http://doi.org/10.1016/j. ecolecon.2011.11.011 Chaplin-Kramer, R., Dombeck, E., Gerber, J., Knuth, K. A., Mueller, N. D., Mueller, M., Ziv, G., & Klein, A. -M. (2014). Global malnutrition overlaps with pollinator-dependent micronutrient production. Proceedings of the Royal Society B: Biological Sciences, 281(1794), 20141799. http://doi.org/10.1098/ rspb.2014.1799
Chapron, G., Kaczensky, P., Linnell, J. D. C., von Arx, M., Huber, D., Andren, H., Lopez-Bao, J. V., Adamec, M., Alvares, F., Anders, O., Bal iauskas, L., Balys, V., Bed , P., Bego, F., Blanco, J. C., Breitenmoser, U., Broseth, H., Bufka, L., Bunikyte, R., Ciucci, P., Dutsov, A., Engleder, T., Fuxjager, C., Groff, C., Holmala, K., Hoxha, B., Iliopoulos, Y., Ionescu, O., Jeremi , J., Jerina, K., Kluth, G., Knauer, F., Kojola, I., Kos, I., Krofel, M., Kubala, J., Kunovac, S., Kusak, J., Kutal, M., Liberg, O., Maji , A., Mannil, P., Manz, R., Marboutin, E., Marucco, F., Melovski, D., Mersini, K., Mertzanis, Y., Mys ajek, R. W., Nowak, S., Odden, J., Ozolins, J., Palomero, G., Paunovi , M., Persson, J., Potočnik, H., Quenette, P.-Y., Rauer, G., Reinhardt, I., Rigg, R., Ryser, A., Salvatori, V., Skrbin ek, T., Stojanov, A., Swenson, J. E., Szemethy, L., Trajce, A., Tsingarska-Sedefcheva, E., Va a, M., Veeroja, R., Wabakken, P., Wolfl, M., Wolfl, S., Zimmermann, F., Zlatanova, D., & Boitani, L. (2014). Recovery of large carnivores in Europe’s modern humandominated landscapes. Science, 346(6216), 1517–1519. http://doi.org/10.1126/ science.1257553 Charron, D. F. (2012). Ecosystem approaches to health for a global sustainability agenda. EcoHealth, 9(3), 256–266. http://doi.org/10.1007/s10393012-0791-5 Cheminée, A., Sala, E., Pastor, J., Bodilis, P., Thiriet, P., Mangialajo, L., Cottalorda, J. -M., & Francour, P. (2013). Nursery value of Cystoseira forests for Mediterranean rocky reef fishes. Journal of Experimental Marine Biology and Ecology, 442, 70–79. http://doi.org/10.1016/j. jembe.2013.02.003 Cheung, W. W. L., Pinnegar, J., Merino, G., Jones, M.C. and Barange, M. (2012). Review of climate change impacts on marine fisheries in the UK and Ireland. Marine and Freshwater Ecosystems, 22(3), 368–388. http://doi.org/10.1002/aqc.2248 Chiesura, A. (2004). The role of urban parks for the sustainable city. Landscape and Urban Planning, 68(1), 129–138. http:// doi.org/10.1016/j.landurbplan.2003.08.003 Chmura, D. J., Howe, G. T., Anderson, P. D., & St Clair, J. B. (2010). Adaptation
CHAPTER 2. NATURE’S CONTRIBUTIONS TO PEOPLE AND QUALITY OF LIFE
of trees, forests and forestry to climate change. Sylwan, 154(9), 587–602.
Dimensions, 23(5), 1039–1051. http://doi. org/10.1016/j.gloenvcha.2013.05.006
Christanell, A., Vogl-Lukasser, B., Vogl, C., & Gütler, M. (2010). The cultural significance of wild gathered plant species in Kartitsch (eastern Tyrol, Austria) and the influence of socio-economic changes on local gathering practices. In M. Pardo-deSantayana, A. Pieroni, & R. K. Puri (Eds.), Ethnobotany in the new Europe: People, health, and wild plant resources. (pp. 51–75). New York, USA: Berghahn Books.
Comber, A., Brunsdon, C., & Green, E. (2008). Using a GIS-based network analysis to determine urban greenspace accessibility for different ethnic and religious groups. Landscape and Urban Planning, 86(1), 103–114. http://doi.org/10.1016/j. landurbplan.2008.01.002
Christie, M., Fazey, I., Cooper, R., Hyde, T., & Kenter, J. O. (2012). An evaluation of monetary and non-monetary techniques for assessing the importance of biodiversity and ecosystem services to people in countries with developing economies. Ecological Economics, 83, 67–78. http:// doi.org/10.1016/j.ecolecon.2012.08.012 Ciais, P., Schelhaas, M. J., Zaehle, S., Piao, S. L., Cescatti, A., Liski, J., Luyssaert, S., Le-Maire, G., Schulze, E. -D., Bouriaud, O., Freibauer, A., Valentini, R., Nabuurs, G. J. (2008). Carbon accumulation in European forests. Nature Geosciences, 16(4), 1555–1574. http://doi.org/10.1038/ngeo233 Ćirović, D., Penezić, A., & Krofel, M. (2016). Jackals as cleaners: Ecosystem services provided by a mesocarnivore in human-dominated landscapes. Biological Conservation, 199, 51–55. http://doi. org/10.1016/j.biocon.2016.04.027 Clark, N. E., Lovell, R., Wheeler, B. W., Higgins, S. L., Depledge, M. H., & Norris, K. (2014). Biodiversity, cultural pathways, and human health: A framework. Trends in Ecology and Evolution, 29(4), 198–204. http://doi.org/10.1016/j. tree.2014.01.009 Clec’h, S. Le, Oszwald, J., Decaens, T., Desjardins, T., Dufour, S., Grimaldi, M., Jegou, N., & Lavelle, P. (2016). Mapping multiple ecosystem services indicators: Toward an objective-oriented approach. Ecological Indicators, 69, 508–521. http:// doi.org/10.1016/j.ecolind.2016.05.021 Colding, J., Barthel, S., Bendt, P., Snep, R., van der Knaap, W., & Ernstson, H. (2013). Urban green commons: Insights on urban common property systems. Global Environmental Change-Human and Policy
Conrad, C., Kaiser, B. O., & Lamers, J. P. A. (2016). Quantifying water volumes of small lakes in the inner Aral Sea Basin, Central Asia, and their potential for reaching water and food security. Environmental Earth Sciences, 75, 952. http://doi.org/10.1007/ s12665-016-5753-8 Cordier, M., Pérez Agúndez, J. A., O’Connor, M., Rochette, S., & Hecq, W. (2011). Quantification of interdependencies between economic systems and ecosystem services: An input-output model applied to the Seine estuary. Ecological Economics, 70(9), 1660–1671. http://doi.org/10.1016/j. ecolecon.2011.04.009 Cornwall, C. E., Hepburn, C. D., McGraw, C. M., Currie, K. I., Pilditch, C. A., Hunter, K. A., Boyd, P. W., & Hurd, C. L. (2013). Diurnal fluctuations in seawater pH influence the response of a calcifying macroalga to ocean acidification. Proceedings of the Royal Society B: Biological Sciences, 280(1772), 20132201. http://doi.org/10.1098/rspb.2013.2201 Cornwall, C. E., Pilditch, C. A., Hepburn, C. D., & Hurd, C. L. (2015). Canopy macroalgae influence understorey corallines’ metabolic control of near-surface pH and oxygen concentration. Marine Ecology Progress Series, 525, 81–95. http://doi. org/10.3354/meps11190 Cornwall, C. E., Revill, A. T., HallSpencer, J. M., Milazzo, M., Raven, J. A., & Hurd, C. L. (2017). Inorganic carbon physiology underpins macroalgal responses to elevated CO2. Scientific Reports, 7, 46297. http://doi.org/10.1038/srep46297 Cunha, S. (1997). Hunting of rare and endangered fauna in the mountains of post-Soviet Central Asia. Proceedings of the Eighth International Snow Leopard Symposium, Islamabad, Pakistan.
Dafnomilis, I., Hoefnagels, R., Pratama, Y. W., Schott, D. L., Lodewijks, G., & Junginger, M. (2017). Review of solid and liquid biofuel demand and supply in northwest Europe towards 2030 – A comparison of national and regional projections. Renewable and Sustainable Energy Reviews, 78, 31–45. http://doi. org/10.1016/j.rser.2017.04.108 Daly, H. E. (1992). Allocation, distribution, and scale: towards an economics that is efficient, just, and sustainable. Ecological Economics, 6(3), 185–193. Daniel, T. C. (2001). Aesthetic preference and ecological sustainability. In S. R. J. Sheppard, & H. W. Harshaw (Eds.), Forests and landscapes: linking ecology, sustainability and aesthetics (pp. 15–29). Wallingford, UK: Centre for Agriculture and Bioscience International. http://doi. org/10.1079/9780851995007.0015 Daniel, T. C., Muhar, A., Arnberger, A., Aznar, O., Boyd, J. W., Chan, K. M. A., Costanza, R., Elmqvist, T., Flint, C. G., Gobster, P. H., Grêt-Regamey, A., Lave, R., Muhar, S., Penker, M., Ribe, R. G., Schauppenlehner, T., Sikor, T., Soloviy, I., Spierenburg, M., Taczanowska, K., Tam, J., & von der Dunk, A. (2012). Contributions of cultural services to the ecosystem services agenda. Proceedings of the National Academy of Sciences of the United States of America, 109(23), 8812–8819. https://doi.org/10.1073/ pnas.1114773109 Davidson, M. D. (2012). Distributive justice in the international regulation of global ecosystem services. Global Environmental Change, 22(4), 852–861. https://doi. org/10.1016/j.gloenvcha.2012.06.004 Davies, A. L., & White, R. M. (2012). Collaboration in natural resource governance: Reconciling stakeholder expectations in deer management in Scotland. Journal of Environmental Management, 112, 160–169. http://doi. org/10.1016/j.jenvman.2012.07.032 Davis, A., & Wagner, J. R. (2003). Who knows? On the importance of identifying “experts” when researching local ecological knowledge. Human Ecology, 31(3), 463–489. https://doi. org/10.1023/A:1025075923297
161
THE REGIONAL ASSESSMENT REPORT ON BIODIVERSITY AND ECOSYSTEM SERVICES FOR EUROPE AND CENTRAL ASIA
Daw, T., Brown, K., Rosendo, S., & Pomeroy, R. (2011). Applying the ecosystem services concept to poverty alleviation: the need to disaggregate human well-being. Environmental Conservation, 38(4), 370-379. http://doi.org/10.1017/ S0376892911000506 Daw, T. M., Coulthard, S., Cheung, W. W. L., Brown, K., Abunge, C., Galafassi, D., Peterson, G. D., McClanahan, T. R., Omukoto, J. O., & Munyi, L. (2015). Evaluating taboo trade-offs in ecosystems services and human well-being. Proceedings of the National Academy of Sciences of the United States of America, 112(22), 6949-6954. http://doi.org/10.1073/ pnas.1414900112 Dawson, R. J., Dickson, M. E., Nicholls, R. J., Hall, J. W., Walkden, M. J. A., Stansby, P. K., Mokrech, M., Richards, J., Zhou, J., Milligan, J., Jordan, A., Pearson, S., Rees, J., Bates, P. D., Koukoulas, S., & Watkinson, A. R. (2009). Integrated analysis of risks of coastal flooding and cliff erosion under scenarios of long term change. Climatic Change, 95(1–2), 249–288. http://doi.org/10.1007/ s10584-008-9532-8 De Fraiture, C., Giordano, M., & Liao, Y. (2008). Biofuels and implications for agricultural water use: blue impacts of green energy. Water Policy, 10, 67-81. http://doi. org/10.2166/wp.2008.054 de Knegt, B. (Ed.). (2014). Graadmeter diensten van n atuur: Vraag, aanbod, gebruik en trend van goederen en diensten uit ecosystemen in Nederland [Indicating services from nature: Demand, supply, use and trends of goods and services from ecosystems in The Netherlands]. De Santo, E. M. (2011). Environmental justice implications of maritime spatial planning in the European Union. Marine Policy, 35(1), 34–38. http://doi. org/10.1016/j.marpol.2010.07.005
processed by first-generation conversion techniques. Biomass and Bioenergy, 34(5), 588–601. http://doi.org/10.1016/j. biombioe.2010.01.001 Deinet, S., Ieronymidou, C., McRae, L., Burfield, I. J., Foppen, R. P. Collen, B., & Böhm, M. (2013). Wildlife comeback in Europe: The recovery of selected mammal and bird species. London, UK: The Zoological Society of London. Delibes-Mateos, M., Díaz-Fernández, S., Ferreras, P., Viñuela, J., & Arroyo, B. (2013). The role of economic and social factors driving predator control in smallgame estates in central Spain. Ecology and Society, 18(2), 28. http://doi.org/10.5751/ ES-05367-180228 Demerdzhiev, D., Hristov, H., Dobrev, D., Angelov, I., & Kurtev, M. (2014). Longterm population status, breeding parameters and limiting factors of the griffon vulture (Gyps fulvus Hablizl, 1783) population in the eastern Rhodopes, Bulgaria. Acta Zoologica Bulgarica, 66(3), 373–384. Demeter, L. (2017). Biodiversity and ecosystem services of hardwood floodplain forests: Past, present and future from the perspective of local communities in west Ukraine. In M. Roué & Z. Molnár (Eds.), Knowing our lands and resources: Indigenous and local knowledge of biodiversity and ecosystem services in Europe and Central Asia (pp. 6–19). Paris, France: UNESCO. DeVault, T. L., Beasley, J. C., Olson, Z. H., Moleón, M., & Carrete, M. (2016). Ecosystem services provided by avian scavengers. In C. H. Şekercioğlu, D. G. Wenny, & C. J. Whelan (Eds.), Why Birds Matter: Avian Ecological Function and Ecosystem Services (pp. 235-270). Chicago, USA: University of Chicago Press.
De Schutter, O. (2014). Report of the Special Rapporteur on the right to food, Olivier De Schutter: Final report: The transformative potential of the right to food.
DeVault, T. L., Rhodes Jr, O. E., & Shivik, J. A. (2003). Scavenging by vertebrates: behavioral, ecological, and evolutionary perspectives on an important energy transfer pathway in terrestrial ecosystems. Oikos, 102(2), 225-234. http:// doi.org/10.1034/j.1600-0706.2003.12378.x
de Vries, S. C., van de Ven, G. W. J., van Ittersum, M. K., & Giller, K. E. (2010). Resource use efficiency and environmental performance of nine major biofuel crops,
Dixon, M. J. R., Loh, J., Davidson, N. C., Beltrame, C., Freeman, R., & Walpole, M. (2016). Tracking global change in ecosystem area: The wetland extent
162
trends index. Biological Conservation, 193, 27–35. http://doi.org/10.1016/j. biocon.2015.10.023 Dolman, A. J., Shvidenko, A., Schepaschenko, D., Ciais, P., Tchebakova, N., Chen, T., van der Molen, M. K., Marchesini, L. B., Maximov, T. C., Maksyutov, S., & Schulze, E.-D. (2012). An estimate of the terrestrial carbon budget of Russia using inventory-based, eddy covariance and inversion methods. Biogeosciences, 9(12), 5323–5340. http://doi.org/10.5194/bg-95323-2012 Donázar, J. A., Cortés-Avizanda, A., Fargallo, J. A., Margalida, A., Moleón, M., Morales-Reyes, Z., Moreno-Opo, R., Pérez-García, J. M., Sánchez-Zapata, J. A., Zuberogoitia, I., & Serrano, D. (2016). Roles of raptors in a changing world: From flagships to providers of key ecosystem services. Ardeola, 63(1), 181–234. http:// doi.org/10.13157/arla.63.1.2016.rp8 Donázar, J. A., Margalida, A., Carrete, M., & Sánchez-Zapata, J. A. (2009). Too sanitary for vultures. Science, 326(5953), 664. http://doi.org/10.1126/ science.326_664a Dramstad, W. E., Tveit, M. S., Fjellstad, W. J., & Fry, G. L. A. (2006). Relationships between visual landscape preferences and map-based indicators of landscape structure. Landscape and Urban Planning, 78(4), 465–474. http://doi.org/10.1016/j. landurbplan.2005.12.006 Dubois, U., & Meier, H. (2016). Energy affordability and energy inequality in Europe: Implications for policymaking. Energy Research & Social Science, 18, 21–35. http://doi.org/10.1016/j.erss.2016.04.015 Dupont, H., Mihoub, J. B., Bobbé, S., & Sarrazin, F. (2012). Modelling carcass disposal practices: Implications for the management of an ecological service provided by vultures. Journal of Applied Ecology, 49(2), 404–411. http://doi. org/10.1111/j.1365-2664.2012.02111.x Dury, M., Hambuckers, A., Warnant, P., Henrot, A., Favre, E., Ouberdous, M., & François, L. (2011). Responses of European forest ecosystems to 21st century climate: assessing changes in interannual
CHAPTER 2. NATURE’S CONTRIBUTIONS TO PEOPLE AND QUALITY OF LIFE
variability and fire intensity. iForest, 4(2), 82–99. http://doi.org/10.3832/ifor0572-004 Eder, R., & Arnberger, A. (2016). How heterogeneous are adolescents’ preferences for natural and semi-natural riverscapes as recreational settings? Landscape Research, 41(5), 555-568. http://doi.org/10.1080/014 26397.2015.1117063
EEA. (2016d). Meteorological and hydrological droughts. Retrieved from https://www.eea.europa.eu/data-and-maps/ indicators/river-flow-drought-2
Is biofuel policy harming biodiversity in Europe? GCB Bioenergy, 1(1), 18–34. http://doi.org/10.1111/j.17571707.2009.01002.x
EEA. (2016e). Quality of Europe’s water for people’s use has improved, but challenges remain to keep it clean and healthy. https:// www.eea.europa.eu/highlights/quality-ofeuropes-water-for
Ekins, P., Simon, S., Deutsch, L., Folke, C., & De Groot, R. (2003). A framework for the practical application of the concepts of critical natural capital and strong sustainability. Ecological Economics, 44(2–3), 165–185. http://doi.org/10.1016/ S0921-8009(02)00272-0
Edmondson, J. L., Stott, I., Davies, Z. G., Gaston, K. J., & Leake, J. R. (2016). Soil surface temperatures reveal moderation of the urban heat island effect by trees and shrubs. Scientific Reports, 6, 33708. http:// doi.org/10.1038/srep33708
EEA. (2016f). Use of freshwater resources. Retrieved from https://www.eea.europa. eu/data-and-maps/indicators/use-offreshwater-resources-2/assessment-2
EEA. (2011). Water exploitation index. Retrieved from https://www.eea.europa.eu/ data-and-maps/figures/water-exploitationindex-wei-4#tab-metadata
EEA. (2016g). Water Exploitation Index plus (WEI+) for summer and urban morphological zones (UMZ). Retrieved from https://www. eea.europa.eu/data-and-maps/figures/ water-exploitation-index-plus-wei/fancybox. html
EEA. (2015a). Air quality in Europe - 2015 report. http://doi.org/10.2800/62459 EEA. (2015b). Global megatrends assessment - Extended background analysis. Retrieved from https://www.eea. europa.eu/publications/global-megatrendsassessment-extended-background-analysis EEA. (2015c). Nutrients in transitional, coastal and marine water. Retrieved from https://www.eea.europa.eu/data-and-maps/ indicators/nutrients-in-transitional-coastaland-3/assessment EEA. (2015d). SOER 2015. Freshwater quality — nutrients in rivers. Retrieved from https://www.eea.europa.eu/soer-2015/ countries-comparison/freshwater EEA. (2015e). The European Environment — state and outlook 2015: synthesis report. Copenhagen: European Environment Agency. http://doi.org/10.2800/944899 EEA. (2016a). Air Quality in Europe - 2016 report. http://doi.org/10.2800/80982 EEA. (2016b). European past floods. Retrieved from https://www.eea.europa.eu/ data-and-maps/data/european-past-floods EEA. (2016c). Mapping and assessing the condition of Europe’s ecosystems: progress and challenges. http://doi. org/10.2779/12398
Efferth, T., Banerjee, M., Paul, N. W., Abdelfatah, S., Arend, J., Elhassan, G., Hamdoun, S., Hamm, R., Hong, C., Kadioglu, O., Naß, J., Ochwangi, D., Ooko, E., Ozenver, N., Saeed, M. E. M., Schneider, M., Seo, E. J., Wu, C. F., Yan, G., Zeino, M., Zhao, Q., Abu-Darwish, M. S., Andersch, K., Alexie, G., Bessarab, D., Bhakta-Guha, D., Bolzani, V., Dapat, E., Donenko, F. V., Efferth, M., Greten, H. J., Gunatilaka, L., Hussein, A. A., Karadeniz, A., Khalid, H. E., Kuete, V., Lee, I. S., Liu, L., Midiwo, J., Mora, R., Nakagawa, H., Ngassapa, O., Noysang, C., Omosa, L. K., Roland, F. H., Shahat, A. A., Saab, A., Saeed, E. M., Shan, L., Titinchi, S. J. J., Problems, D., Publication, S., Pullin, A., Frampton, G., & Jongman, R. Titinchi, S. J. J. (2016). Biopiracy of natural products and good bioprospecting practice. Phytomedicine, 23(2), 166–173. http://doi.org/10.1016/j. phymed.2015.12.006 Efroymson, R. A., Dale, V. H., Kline, K. L., McBride, A. C., Bielicki, J. M., Smith, R. L., Parish, E. S., Schweizer, P. E., & Shaw, D. M. (2013). Environmental indicators of biofuel sustainability: What about context? Environmental Management, 51(2), 291–306. http://doi.org/10.1007/ s00267-012-9907-5 Eggers, J., Tröltzsch, K., Falcucci, A., Maiorana, L., Verburg, P. H., Framstad, E., Louette, G., Maes, D., Nagy, S., Ozinga, W., & Delbaere, B. (2009).
Ekor, M. (2014). The growing use of herbal medicines: Issues relating to adverse reactions and challenges in monitoring safety. Frontiers in Pharmacology, 4, 177. http://doi.org/10.3389/fphar.2013.00177 Elbakidze, M., Angelstam, P., & Axelsson, R. (2007). Sustainable forest management as an approach to regional development in the Russian Federation: State and trends in Kovdozersky model forest in the Barents region. Scandinavian Journal of Forest Research, 22(6), 568–581. http://doi. org/10.1080/02827580701804179 Eliotout, B., Lecuyer, P., & Duriez, O. (2007). Premiers résultats sur la biologie de reproduction du vautour moine Aegypius monachus en France [First results on the breeding biology of the monk vulture Aegypius monachus in France]. Alauda, 75(3), 253–264. EM-DAT. (2017). EM-DAT: The Emergency Events Database. Credit D. Guha-Sapir. Retrieved from http://www.emdat.be/ Erb, K., Krausmann, F., Gaube, V., Gingrich, S., Bondeau, A., Fischer-Kowalski, M., & Haberl, H. (2009a). Analyzing the global human appropriation of net primary production — processes, trajectories, implications. An introduction. Ecological Economics, 69(2), 250–259. http://doi.org/10.1016/j. ecolecon.2009.07.001 Erb, K., Krausmann, F., Lucht, W., & Haberl, H. (2009b). Embodied HANPP: Mapping the spatial disconnect between global biomass production and consumption. Ecological Economics, 69(2), 328–334. http://doi.org/10.1016/j. ecolecon.2009.06.025
163
THE REGIONAL ASSESSMENT REPORT ON BIODIVERSITY AND ECOSYSTEM SERVICES FOR EUROPE AND CENTRAL ASIA
European Commission. (2011). A European assessment of the provision of ecosystem services - Towards an atlas of ecosystem services. Joint Research Centre, Publications Office of the European Union (Vol. JRC63505). http://doi. org/10.2788/63557 European Commission. (2013). The impact of EU consumption on deforestation: Comprehensive analysis of the impact of EU consumption on deforestation. http://doi. org/10.2779/822269 European Commission. (2014a). In-depth study of European energy security. European Commission. (2014b). Mapping and assessment of ecosystems and their services. Indicators for ecosystem assessments under Action 5 of the EU Biodiversity Strategy to 2020. 2nd report. http://doi.org/10.2779/75203 European Commission. (2015a). Attitudes of Europeans towards biodiversity. Special Eurobarometer 436. European Commission. (2015b). Mapping and Assessment of Ecosystems and their Services: Trends in ecosystems and ecosystem services in the European Union between 2000 and 2010. http://doi. org/10.2788/341839 European Commission. (2015c). Towards an EU research and innovation policy agenda for nature-based solutions & re-naturing cities. http://doi. org/10.2777/765301 European Commission. (2016a). Flash Eurobarometer 432. Preferences of Europeans towards tourism. http://doi. org/10.2873/91884 European Commission. (2016b). Global soil biodiversity atlas. http://doi. org/10.2788/2613 Eurostat. (2016a). Forests, forestry and logging. Retrieved from http://ec.europa. eu/eurostat/statistics-explained/index.php/ Forests,_forestry_and_logging Eurostat. (2016b). Fresh water abstraction by source. Retrieved from http://ec.europa. eu/eurostat/web/products-datasets/-/ ten00002
164
Eurostat. (2017). Database - Eurostat. Retrieved December 18, 2017, from http:// ec.europa.eu/eurostat/data/database
FAO. (2017). FAOSTAT. Retrieved December 18, 2017, from http://www.fao. org/faostat/en/#home
Faith, D. P. (1992). Conservation evaluation and phylogenetic diversity. Biological Conservation, 61(1), 1–10. http://doi. org/10.1016/0006-3207(92)91201-3
Farm Accountancy Data Network. (2017). Farm business survey: EU benchmarking.
Faith, D. P. (2016). A general model for biodiversity and its value. In J. Garson, A. Plutynski, & S. Sarkar (Eds.), The Routledge handbook of philosophy of biodiversity. London, UK and New York, USA: Routledge. http://doi. org/10.4324/9781315530215 FAO. (1995). Non-wood forest products. Retrieved from http://www.fao.org/forestry/ nwfp/en/ FAO. (2005). Trade in Medicinal Plants. Retrieved from http://www.fao.org/ docrep/008/af285e/af285e00.htm FAO. (2013). Irrigation in Central Asia in figures. AQUASTAT Survey – 2012. Retrieved from http://www.fao.org/3/ai3289e.pdf FAO. (2014a). The state of world fisheries and aquaculture. Retrieved from http:// www.fao.org/fishery/sofia/en FAO. (2014b). The water-energy-food nexus. A new approach in support of food security and sustainable agriculture. Retrieved from http://www.fao.org/3/abl496e.pdf FAO. (2015a). Forest Resources Assessment Working Paper 180: Terms and Definitions. Rome, Italy: FAO. Retrieved from http://www.fao.org/docrep/017/ ap862e/ap862e00.pdf FAO. (2015b). Status of the world’s soil resources (SWSR) – Main report. Retrieved from http://www.fao.org/global-soilpartnership/resources/highlights/detail/ en/c/215220/ FAO. (2015c). The Global Forest Resources Assessment. Retrieved from http://www.fao. org/forest-resources-assessment/en/ FAO. (2016). AQUASTAT main database. Retrieved from http://www.fao.org/nr/water/ aquastat/main/index.stm
FEFAC. (2017). The European Feed Manufacturers’ Federation. Retrieved September 12, 2017, from http://www.fefac.eu/publications. aspx?CategoryID=2061&EntryID=10802 Felipe-Lucia, M. R., Martín-López, B., Lavorel, S., Berraquero-Díaz, L., Escalera-Reyes, J., & Comin, F. A. (2015). Ecosystem services flows: Why stakeholders’ power relationships matter. PLoS ONE, 10(7), e0132232. http://doi. org/10.1371/journal.pone.0132232 Fernández-Giménez, M. E., & Fillat Estaque, F. (2012). Pyrenean pastoralists’ ecological knowledge: Documentation and application to natural resource management and adaptation. Human Ecology, 40(2), 287–300. http://doi.org/10.1007/s10745012-9463-x Fielding, J. (2007). Environmental injustice or just the lie of the land: An investigation of the socio-economic class of those at risk from flooding in England and Wales. Sociological Research Online, 12(4), 1-23. http://doi.org/10.5153/sro.1570 Fielding, J. L. (2012). Inequalities in exposure and awareness of flood risk in England and Wales. Disasters, 36(3), 477–494. http://doi.org/10.1111/j.14677717.2011.01270.x Fischer, G., Nachtergaele, F. O., Prieler, S., Teixeira, E., Toth, G., van Velthuizen, H., Verelst, L., & Wiberg, D. (2012). GAEZ v3.0: Model documentation. FLERMONECA. (2015). The state of the environment in Central Asia: Illustrations of selected environmental themes and indicators. Fletcher, R., Baulcomb, C., Hall, C., & Hussain, S. (2014). Revealing marine cultural ecosystem services in the Black Sea. Marine Policy, 50, 151–161. http://doi. org/10.1016/j.marpol.2014.05.001
CHAPTER 2. NATURE’S CONTRIBUTIONS TO PEOPLE AND QUALITY OF LIFE
Forest Europe. (2015). State of Europe’s forests 2015 report. Forsius, M., Anttila, S., Arvola, L., Bergström, I., Hakola, H., Heikkinen, H., Helenius, J., Hyvärinen, M., Jylhä, K., Karjalainen, J., Keskinen, T., Laine, K., Nikinmaa, E., Peltonen-Sainio, P., Rankinen, K., Reinikainen, M., Setälä, H., & Vuorenmaa, J. (2013). Impacts and adaptation options of climate change on ecosystem services in Finland: a model based study. Current Opinion in Environmental Sustainability, 5(1), 26–40. http://doi.org/10.1016/j.cosust.2013.01.001 Frank, S., Fürst, C., Koschke, L., Witt, A., & Makeschin, F. (2013). Assessment of landscape aesthetics—Validation of a landscape metrics-based assessment by visual estimation of the scenic beauty. Ecological Indicators, 32, 222–231. http:// doi.org/10.1016/j.ecolind.2013.03.026 Fridl, J., Urbanc, M., & Pipan, P. (2009). The importance of teachers’ perception of space in education. Acta Geographica Slovenica, 49(2), 365–392. http://doi. org/10.3986/AGS49205 Fuchs, R., Schulp, C. J. E., Hengeveld, G. M., Verburg, P. H., Clevers, J. G. P. W., Schelhaas, M. -J., & Herold, M. (2016). Assessing the influence of historic net and gross land changes on the carbon fluxes of Europe. Global Change Biology, 22(7), 2526–2539. http://doi.org/10.1111/ gcb.13191 Fuller, R. A., Irvine, K. N., Devine-Wright, P., Warren, P. H., & Gaston, K. J. (2007). Psychological benefits of greenspace increase with biodiversity. Biology Letters, 3, 390-394. http://doi.org/10.1098/ rsbl.2007.0149 Galvin, K. A. (2008). Responses of pastoralists to land fragmentation: Social capital, connectivity, and resilience. In K. A. Galvin, R.S. Reid, R. H. Behnke Jr, & N.T. Hobbs (Eds), Fragmentation in semiarid and arid landscapes (pp. 369–389). Dordrecht, The Netherlands: Springer. García-Llorente, M., Martín-López, B., Iniesta-Arandia, I., López-Santiago, C. A., Aguilera, P. A., & Montes, C. (2012). The role of multi-functionality in social preferences toward semi-arid rural landscapes: An ecosystem service
approach. Environmental Science and Policy, 19–20, 136–146. http://doi. org/10.1016/j.envsci.2012.01.006 Gascon, C., Brooks, T. M., ContrerasMacBeath, T., Heard, N., Konstant, W., Lamoreux, J., Launay, F., Maunder, M., Mittermeier, R., Molur, S., Al Mubarak, A., Parr, M., Rhodin, A., Ry, A., & Vié, J.-C. (2015). The importance and benefits of species. Current Biology, 25(10), R431–R438. http://doi.org/10.1016/J. CUB.2015.03.041 Gauthier, S., Bernier, P., Kuuluvainen, T., Shvidenko, A. Z., & Schepaschenko, D. G. (2015). Boreal forest health and global change. Science, 349(6250), 819–822. http://doi.org/10.1126/science.aaa9092 Gehring, T. M., VerCauteren, K. C., & Landry, J.-M. (2010). Livestock protection dogs in the 21st century: Is an ancient tool relevant to modern conservation challenges? BioScience, 60(4), 299–308. http://doi.org/10.1525/bio.2010.60.4.8 Geijzendorffer, I., Galewski, T., Guelmami, A., Perennou, C., Popoff, N., & Grillas. (in press). Mediterranean wetlands: A gradient from natural resilience to a fragile social-ecosystem. In M. Schröter, A. Bonn, S. Klotz, R. Seppelt, & C. Baessler (Eds.), Atlas of ecosystem services: Drivers, risks, and societal responses. Leipzig, Germany: Springer. Geijzendorffer, I. R., Cohen-Shacham, E., Cord, A. F., Cramer, W., Guerra, C., & Martín-López, B. (2017). Ecosystem services in global sustainability policies. Environmental Science & Policy, 74, 40–48. http://doi.org/10.1016/j.envsci.2017.04.017 Gerbens-Leenes, P. W., van Lienden, A. R., Hoekstra, A. Y., & van der Meer, T. H. (2012). Biofuel scenarios in a water perspective: The global blue and green water footprint of road transport in 2030. Global Environmental Change, 22(3), 764–775. http://doi.org/10.1016/j. gloenvcha.2012.04.001 Gilroy, J. J., Gill, J. A., Butchart, S. H. M., Jones, V. R., & Franco, A. M. A. (2016). Migratory diversity predicts population declines in birds. Ecology Letters, 19, 308–317. http://doi. org/10.1111/ele.12569
Global Footprint Network. (2017). National footprint accounts, 2017 edition. Glotzbach, S., & Baumgärtner, S. (2012). The Relationship between Intragenerational and Intergenerational Ecological Justice. Environmental Values, 21, 331–355. http://doi.org/10.3197/09632 7112X13400390126055 Goidts, E., & Wesemael, B. Van. (2007). Regional assessment of soil organic carbon changes under agriculture in southern Belgium (1955 – 2005). Geoderma, 141, 341–354. http://doi.org/10.1016/j. geoderma.2007.06.013 Golosov, V. N., Gennadiev, A. N., Olson, K. R., Markelov, M. V., Zhidkin, A. P., Chendev, Y. G., & Kovach, R. G. (2011). Spatial and temporal features of soil erosion in the forest-steppe zone of the east-European Plain. Eurasian Soil Science, 44(7), 794–801. http://doi.org/10.1134/ S1064229311070064 Gómez-Baggethun, E., & MartínLópez, B. (2015). Ecological economics perspectives on ecosystem services valuation. In J. Martinez-alier & R. Muradian (Eds.), Handbook of ecological economics (pp. 260–282). Cheltenham, UK and Northampton, USA: Edward Elgar Publishing Limited. Gorenflo, L. J., Romaine, S., Mittermeier, R. a., & WalkerPainemilla, K. (2012). Co-occurrence of linguistic and biological diversity in biodiversity hotspots and high biodiversity wilderness areas. Proceedings of the National Academy of Sciences of the United States of America, 109(21), 8032–8037. http://doi.org/10.1073/pnas.1117511109 Government of Sweden. (2014). Fifth national report to the Convention on Biological Diversity. Retrieved from https:// www.cbd.int/reports/search GRAIN. (2016). The global farmland grab in 2016: How big, how bad? Retrieved from https://www.organicconsumers.org Grall, J., & Hall-Spencer, J. M. (2003). Problems facing maerl conservation in Brittany. Aquatic Conservation: Marine and Freshwater Ecosystems, 13, S55–S64. http://doi.org/10.1002/aqc.568
165
THE REGIONAL ASSESSMENT REPORT ON BIODIVERSITY AND ECOSYSTEM SERVICES FOR EUROPE AND CENTRAL ASIA
Green, R. E., Donázar, J. A., SánchezZapata, J. A., & Margalida, A. (2016). Potential threat to Eurasian griffon vultures in Spain from veterinary use of the drug diclofenac. Journal of Applied Ecology, 53(4), 993–1003. http://doi. org/10.1111/1365-2664.12663 Grilli, G., Nikodinoska, N., Paletto, A., & De Meo, I. (2015). Stakeholders’ preferences and economic value of forest ecosystem services: An example in the Italian Alps. Baltic Forestry, 21(2), 298–307. Grizzetti, B., Bouraoui, F., & Aloe, A. (2012). Changes of nitrogen and phosphorus loads to European seas. Global Change Biology, 18(2), 769–782. http://doi. org/10.1111/j.1365-2486.2011.02576.x Grizzetti, B., Pistocchi, A., Liquete, C., Udias, A., Bouraoui, F., & van de Bund, W. (2017). Human pressures and ecological status of European rivers. Scientific Reports, 7(1), 205. http://doi. org/10.1038/s41598-017-00324-3 Groot, R. de, Ramakrishnan, P. S., Berg, A. van de, Kulenthran, T., Muller, S., Pitt, D., Wascher, D., Wijesuriya, G. (2005). Cultural and amenity services. In Millennium Ecosystem Assessment: Current state and trends, volume 1 (pp. 457–476). Washington DC, USA: Island Press. Grote, R., Samson, R., Alonso, R., Amorim, J. H., Cariñanos, P., Churkina, G., Fares, S., Thiec, D. Le, Niinemets, Ü., Mikkelsen, T. N., Paoletti, E., Tiwary, A., & Calfapietra, C. (2016). Functional traits of urban trees: Air pollution mitigation potential. Frontiers in Ecology and the Environment, 14(10), 543–550. http://doi. org/10.1002/fee.1426 Grubač, B., Velevski, M., & Avukatov, V. (2014). Long-term population decrease and recent breeding performance of the Egyptian vulture Neophron percnopterus in Macedonia. North-Western Journal of Zoology, 10(1), 25–35. Gubbay, S., Sanders, N., Haynes, T., Janssen, J. A. M., Rodwell, J. R., Nieto, A., García Criado, M., Beal, S., Borg, J., Kennedy, M., Micu, D., Otero, M., Saunders, G., & Calix, M. (2016). European red list of habitats. Part 1. Marine habitats. Luxembourg: Publications
166
Office of the European Union. http://doi. org/10.2779/032638
Hydrology, 37, 93–105. https://doi. org/10.5282/ubm/epub.13563
Guerra, C. A., Maes, J., Geijzendorffer, I., & Metzger, M. J. (2016). An assessment of soil erosion prevention by vegetation in Mediterranean Europe: Current trends of ecosystem service provision. Ecological Indicators, 60, 213-222. http://doi. org/10.1016/j.ecolind.2015.06.043
Haines-Young, R., Potschin, M., & Kienast, F. (2012). Indicators of ecosystem service potential at European scales: Mapping marginal changes and trade-offs. Ecological Indicators, 21, 39–53. http://doi. org/10.1016/j.ecolind.2011.09.004
Gundersen, V. S., & Frivold, L. H. (2008). Public preferences for forest structures: A review of quantitative surveys from Finland, Norway and Sweden. Urban Forestry and Urban Greening, 7(4), 241–258. http://doi. org/10.1016/j.ufug.2008.05.001 Gupta, R., Kienzler, K., Martius, C., Mirzabaev, T., Oweis, T., de Pauw, E., Qadir, M., Shideed, K., Sommer, R., Thomas, R., Sayre, K., Carli, C., Saparov, A., Bekenov, M., Sanginov, S., Nepesov, M., Kramov, R. (2009). Research Prospectus: A Vision for Sustainable Land Management Research in Central Asia. ICARDA Central Asia and Caucasus Program. Sustainable Agriculture in Central Asia and the Caucasus Series No.1. Tashkent, Uzbekistan: CGIAR-PFU. Gürlük, S., & Rehber, E. (2008). A travel cost study to estimate recreational value for a bird refuge at Lake Manyas, Turkey. Journal of Environmental Management, 88(4), 1350–1360. http://doi.org/10.1016/j. jenvman.2007.07.017 Haase, D., Schwarz, N., Strohbach, M., Kroll, F., & Seppelt, R. (2012). Synergies, trade-offs, and losses of ecosystem services in urban regions: An integrated multiscale framework applied to the Leipzig-Halle region, Germany. Ecology and Society, 17(3), 22. http://doi.org/10.5751/ES-04853170322 Haberl, H., Erb, K.-H., Krausmann, F., Bondeau, A., Lauk, C., Müller, C., Plutzar, C., & Steinberger, J. K. (2011). Global bioenergy potentials from agricultural land in 2050: Sensitivity to climate change, diets and yields. Biomass and Bioenergy, 35(12), 4753–4769. http://doi. org/10.1016/j.biombioe.2011.04.035 Hagg, W., Braun, L. N., Weber, M., & Becht, M. (2006). Runoff modelling in glacierized Central Asian catchments for present-day and future climate. Nordic
Hainz-Renetzeder, C., Schneidergruber, A., Kuttner, M., & Wrbka, T. (2015). Assessing the potential supply of landscape services to support ecological restoration of degraded landscapes: A case study in the Austrian-Hungarian trans-boundary region of Lake Neusiedl. Ecological Modelling, 295, 196–206. http://doi.org/10.1016/j. ecolmodel.2014.07.001 Hajat, S., O’Connor, M., & Kosatsky, T. (2010). Health effects of hot weather: from awareness of risk factors to effective health protection. The Lancet, 375(9717), 856–863. http://doi.org/10.1016/S01406736(09)61711-6 Hall-Spencer, J., & Bamber, R. (2007). Effects of salmon farming on benthic Crustacea. Ciencias Marinas, 33, 353–366. http://doi.org/10.7773/cm.v33i4.1166 Hall-Spencer, J. M., Kelly, J., & Maggs, C. A. (2008). Assessment of maerl beds in the OSPAR area and the development of a monitoring program. Hansen, K., & Malmaeus, M. (2016). Ecosystem services in Swedish forests. Scandinavian Journal of Forest Research, 31(6), 626–640. http://doi.org/10.1080/028 27581.2016.1164888 Hanski, I., von Hertzen, L., Fyhrquist, N., Koskinen, K., Torppa, K., Laatikainen, T., Karisola, P., Auvinen, P., Paulin, L., Makela, M. J., Vartiainen, E., Kosunen, T. U., Alenius, H., & Haahtela, T. (2012). Environmental biodiversity, human microbiota, and allergy are interrelated. Proceedings of the National Academy of Sciences of the United States of America, 109(21), 8334–8339. http://doi. org/10.1073/pnas.1205624109 Haque, U., Blum, P., da Silva, P. F., Andersen, P., Pilz, J., Chalov, S. R., Malet, J.-P., Auflič, M. J., Andres, N., Poyiadji, E., Lamas, P. C., Zhang, W., Peshevski, I., Pétursson, H. G., Kurt,
CHAPTER 2. NATURE’S CONTRIBUTIONS TO PEOPLE AND QUALITY OF LIFE
T., Dobrev, N., García-Davalillo, J. C., Halkia, M., Ferri, S., Gaprindashvili, G., Engström, J., & Keellings, D. (2016). Fatal landslides in Europe. Landslides, 13(6), 1545–1554. http://doi.org/10.1007/s10346016-0689-3 Harmon, D., & Loh, J. (2010). The index of linguistic diversity: A new quantitative measure of trends in the status of the world ’s languages. Language Documentation & Conservation, 4, 97–151. Hartig, T., Mitchell, R., de Vries, S., & Frumkin, H. (2014). Nature and health. Annual Review of Public Health, 35, 207–28. Harvey, M., & Pilgrim, S. (2011). The new competition for land: Food, energy, and climate change. Food Policy, 36(Suppl.), S40–S51. http://doi.org/10.1016/j. foodpol.2010.11.009 Harwood, A. R., Lovett, A. A., & Turner, J. A. (2015). Customising virtual globe tours to enhance community awareness of local landscape benefits. Landscape and Urban Planning, 142, 106–119. http://doi. org/10.1016/j.landurbplan.2015.08.008 Haslinger, A., Breu, T., Hurni, H., & Maselli, D. (2007). Opportunities and risks in reconciling conservation and development in a post-Soviet setting: The example of the Tajik National Park. International Journal of Biodiversity Science, Ecosystems Services & Management, 3(3), 157–169. http://doi. org/10.1080/17451590709618170 Hausner, V. H., Brown, G., & Lægreid, E. (2014). Effects of land tenure and protected areas on ecosystem services and land use preferences in Norway. Land Use Policy, 49, 446–461. http://doi.org/10.1016/j. landusepol.2015.08.018 Havlík, P., Schneider, U. A., Schmid, E., Böttcher, H., Fritz, S., Skalský, R., Aoki, K., Cara, S. De, Kindermann, G., Kraxner, F., Leduc, S., McCallum, I., Mosnier, A., Sauer, T., & Obersteiner, M. (2011). Global land-use implications of first and second generation biofuel targets. Energy Policy, 39(10), 5690–5702. http:// doi.org/10.1016/j.enpol.2010.03.030 Heikkinen, J., Ketoja, E., Nuutinen, V., & Regina, K. (2013). Declining trend of carbon in Finnish cropland soils in 1974-
2009. Global Change Biology, 19(5), 1456– 1469. http://doi.org/10.1111/gcb.12137
http://doi.org/10.1080/00139157.2014.8 61673
Hein, T., Schwarz, U., Habersack, H., Nichersu, I., Preiner, S., Willby, N., & Weigelhofer, G. (2016). Current status and restoration options for floodplains along the Danube River. The Science of the Total Environment, 543, 778–790. http://doi. org/10.1016/j.scitotenv.2015.09.073
Hilborn, R., & Ovando, D. (2014). Reflections on the success of traditional fisheries management. ICES Journal of Marine Science, 71(5), 1040–1046. http:// doi.org/10.1093/icesjms/fsu034
Heinrichs, M., & Jäger, A. K. (Eds.). (2015). Ethnopharmacology. Chichester, UK: Wiley Blackwell. Heintz, M. D., Hagemeier-Klose, M., & Wagner, K. (2012). Towards a risk governance culture in flood policy-findings from the implementation of the “floods directive” in Germany. Water, 4(1), 135–156. http://doi.org/10.3390/w4010135 Hellmann, F., & Verburg, P. H. (2010). Impact assessment of the European biofuel directive on land use and biodiversity. Journal of Environmental Management, 91(6), 1389–1396. http://doi.org/10.1016/j. jenvman.2010.02.022 Hellmann, F., & Verburg, P. H. (2011). Spatially explicit modelling of biofuel crops in Europe. Biomass and Bioenergy, 35(6), 2411–2424. http://doi.org/10.1016/j. biombioe.2008.09.003 Henders, S., Persson, U. M., & Kastner, T. (2015). Trading forests: land-use change and carbon emissions embodied in production and exports of forest-risk commodities. Environmental Research Letters, 10(12), 125012. http:// doi.org/10.1088/1748-9326/10/12/125012 Hendriks, I. E., Olsen, Y. S., Ramajo, L., Basso, L., Steckbauer, A., Moore, T. S., Howard, J., & Duarte, C. M. (2014). Photosynthetic activity buffers ocean acidification in seagrass meadows. Biogeosciences 11, 333-346. http://doi. org/10.5194/bg-11-333-2014 Hernández-Morcillo, M., Hoberg, J., Oteros-Rozas, E., Plieninger, T., Gómez-Baggethun, E., & ReyesGarcía, V. (2014). Traditional ecological knowledge in Europe: Status quo and insights for the environmental policy agenda. Environment: Science and Policy for Sustainable Development, 56(1), 3–17.
Hillel, D., & Rosenzweig, C. (2008). Biodiversity and food production. In E. Chivian & A. Bernstein (Eds.), Sustaining life: How human health depends on biodiversity (pp. 325–381). New York, USA: Oxford University Press. Hodgkin-Hunter. (2015). Agricultural biodiversity and food security. In WHO & CBD, Connecting global priorities: Biodiversity and human health: A state of knowledge review (pp. 75-95). http://doi. org/10.13140/RG.2.1.3679.6565 Holland, J. M. (2004). The environmental consequences of adopting conservation tillage in Europe: reviewing the evidence. Agriculture Ecosystems & Environment, 103(1), 1–25. http://doi.org/10.1016/j. agee.2003.12.018 Horne, P., & Petäjistö, L. (2003). Preferences for alternative moose management regimes among Finnish landowners: A choice experiment approach. Land Economics, 79(4), 472–482. http://doi. org/10.2307/3147294 Hornigold, K., Lake, I., & Dolman, P. (2016). Recreational use of the countryside: No evidence that high nature value enhances a key ecosystem service. PLoS ONE, 11(11), e0165043. http://doi. org/10.1371/journal.pone.0165043 Horwitz, P., & Kretsch C. (2015). Contribution of biodiversity and green spaces to mental and physical fitness, and cultural dimensions of health. In WHO & CBD, Connecting global priorities: Biodiversity and human health: A state of knowledge review (pp. 200-220). http://doi. org/10.13140/RG.2.1.3679.6565 Howe, C., Suich, H., Vira, B., & Mace, G. M. (2014). Creating win-wins from trade-offs? Ecosystem services for human well-being: A meta-analysis of ecosystem service trade-offs and synergies in the real world. Global Environmental Change,
167
THE REGIONAL ASSESSMENT REPORT ON BIODIVERSITY AND ECOSYSTEM SERVICES FOR EUROPE AND CENTRAL ASIA
28, 263–275. http://doi.org/10.1016/j. gloenvcha.2014.07.005 Howley, P. (2011). Landscape aesthetics: Assessing the general publics’ preferences towards rural landscapes. Ecological Economics, 72, 161–169. http://doi. org/10.1016/j.ecolecon.2011.09.026 Howley, P., Donoghue, C. O., & Hynes, S. (2012). Exploring public preferences for traditional farming landscapes. Landscape and Urban Planning, 104(1), 66–74. http://doi. org/10.1016/j.landurbplan.2011.09.006 Hunter-Burlingame-Remans. (2015). Biodiversity and Nutrition. In WHO & CBD, Connecting global priorities: Biodiversity and human health: A state of knowledge review (pp. 97-129). http://doi.org/10.13140/ RG.2.1.3679.6565 Hunziker, M., Felber, P., Gehring, K., Buchecker, M., Bauer, N., & Kienast, F. (2008). Evaluation of Landscape Change by Different Social Groups. Mountain Research and Development, 28(2), 140–147. http:// doi.org/10.1659/mrd.0952 Hurd, C. L. (2015). Slow-flow habitats as refugia for coastal calcifiers from ocean acidification. Journal of Phycology, 51(4), 599–605. http://doi.org/10.1111/jpy.12307 Hussey, K., & Pittock, J. (2012). The energy-water nexus: Managing the links between energy and water for a sustainable future. Ecology and Society, 17(1). http:// doi.org/10.5751/ES-04641-170131 ICES Working Group for Baltic Salmon and Sea trout. (2013). Abundance of salmon spawners and smolt. HELCOM Core Indicator Report. IEA. (2004). World Energy Outlook 2004. Paris, France: OECD Publishing. http://doi. org/10.1787/weo-2004-en
Torretta, E., & Meriggi, A. (2016). Why do wolves eat livestock?: Factors influencing wolf diet in northern Italy. Biological Conservation, 195, 156–168. http://doi. org/10.1016/j.biocon.2016.01.003 Iniesta-Arandia, I., García del Amo, D., García-Nieto, A. P., Piñeiro, C., Montes, C., & Martín-López, B. (2014). Factors influencing local ecological knowledge maintenance in Mediterranean watersheds: Insights for conservation policies, Ambio, 44(4), 285-296. http://doi.org/10.1007/ s13280-014-0556-1 IPBES. (2015). IPBES/4/INF/13: Preliminary guide regarding diverse conceptualization of multiple values of nature and its benefits, including biodiversity and ecosystem functions and services (deliverable 3 (d)). Retrieved from https://www.ipbes.net/event/ ipbes-4-plenary IPBES. (2016). Summary for policymakers of the assessment report of the Intergovernmental Science-Policy Platform on Biodiversity and Ecosystem Services on pollinators, pollination and food production. S. G. Potts, V. L. Imperatriz-Fonseca, H. T. Ngo, J. C. Biesmeijer, T. D. Breeze, L. V. Dicks, L. A. Garibaldi, R. Hill, J. Settele, A. J. Vanbergen, M. A. Aizen, S. A. Cunningham, C. Eardley, B. M. Freitas, N. Gallai, P. G. Kevan, A. Kovács-Hostyánszki, P. K. Kwapong, J. Li, X. Li, D. J. Martins, G. Nates-Parra, J. S. Pettis, R. Rader, & B. F. Viana (Eds.). Bonn, Germany: Secretariat of the Intergovernmental Science-Policy Platform on Biodiversity and Ecosystem Services. IPBES. (2017a). IPBES/5/INF/24: Update on the classification of nature’s contributions to people by the Intergovernmental Science-Policy Platform on Biodiversity and Ecosystem Services. Retrieved from https:// www.ipbes.net/event/ipbes-5-plenary
protected-areas/about/protected-areacategories Ivascu, C., & Rakosy, L. (2017). Biocultural adaptations and traditional ecological knowledge in a historical village from Maramureș Land, Romania. In M. Roué & Z. Molnár (Eds.), Knowing our lands and resources: Indigenous and local knowledge of biodiversity and ecosystem services in Europe and Central Asia (pp. 21–41). Paris, France: UNESCO. Jackson, E., Rowden, A., Attrill, M., Bossey, S., & Jones, M. (2001). The importance of seagrass beds as a habitat for fishery species. In R. N. Gibson & M. Barnes (Eds.), Oceanography and Marine Biology: An Annual Review (pp. 269-304). Millport, UK: Taylor & Francis. Jackson, L. E., Daniel, J., McCorkle, B., Sears, A., & Bush, K. F. (2013). Linking ecosystem services and human health: the Eco-Health Relationship Browser. International Journal of Public Health, 58(5), 747–55. http://doi.org/10.1007/s00038013-0482-1 Jacobs, S., Martín-López, B., Barton, D. N., Dunford, R., Harrison, P. A., Kelemen, E., Saarikoski, H., Termansen, M., García-Llorente, M., GómezBaggethun, E., Kopperoinen, L., Luque, S., Palomo, I., Priess, J. A., Rusch, G. M., Tenerelli, P., Turkelboom, F., Demeyer, R., Hauck, J., Keune, H., & Smith, R. (2017). The means determine the end - Pursuing integrated valuation in practice. Ecosystem Services. http://doi. org/10.1016/j.ecoser.2017.07.011 Jacobsen, K. S., & Linnell, J. D. C. (2016). Perceptions of environmental justice and the conflict surrounding large carnivore management in Norway - Implications for conflict management. Biological Conservation, 203, 197–206. http://doi. org/10.1016/j.biocon.2016.08.041
IEA/OECD. (2015). Eastern Europe, Caucasus and Central Asia. Retrieved from https://www.iea.org/publications
IPBES. (2017b). IPBES/5/INF/5: Update on the work on knowledge and data (deliverables 1 (d) and 4 (b)). Retrieved from https://www.ipbes.net/event/ipbes-5plenary
IEA/OECD. (2016). World Energy Statistics 2016. Retrieved from https://www.iea.org/ publications
IUCN. (2014). Europe’s big five selected! Retrieved from http://www.iucnredlist.org/ news/europes-big-five-selected
Jalilov, S. M., Keskinen, M., Varis, O., Amer, S., & Ward, F. A. (2016). Managing the water-energy-food nexus: Gains and losses from new water development in Amu Darya River Basin. Journal of Hydrology, 539, 648–661. http://doi.org/10.1016/j. jhydrol.2016.05.071
Imbert, C., Caniglia, R., Fabbri, E., Milanesi, P., Randi, E., Serafini, M.,
IUCN. (2017). Protected areas categories. Retrieved from https://www.iucn.org/theme/
Janhäll, S. (2015). Review on urban vegetation and particle air pollution -
168
CHAPTER 2. NATURE’S CONTRIBUTIONS TO PEOPLE AND QUALITY OF LIFE
Deposition and dispersion. Atmospheric Environment, 105, 130–137. http://doi. org/10.1016/j.atmosenv.2015.01.052 Janssens, I. A., Freibauer, A., Ciais, P., Smith, P., Nabuurs, G., Folberth, G., Schlamadinger, B., Hutjes, R. W. A., Ceulemans, R., Schulze, E. -D., Valentini, R., & Dolman, A. J. (2003). Europe’s terrestrial biosphere anthropogenic CO2 emissions. Science, 300(5625), 1538–1542. http://doi.org/10.1126/ science.1083592 Jansson, R., Nilsson, C., Keskitalo, E. C. H., Vlasova, T., Sutinen, M.-L., Moen, J., Stuart Chapin III, F., Bråthen, K. A., Cabeza, M., Callaghan, T. V, van Oort, B., Dannevig, H., Bay-Larsen, I. A., Ims, R. A., Aspholm, P. E., Stuart Chapin III, F., Bråthen, K. A., Cabeza, M., Callaghan, T. V, van Oort, B., Dannevig, H., Bay-Larsen, I. A., Ims, R. A., Aspholm, P. E., Stuart Chapin III, F., Bråthen, K. A., Cabeza, M., Callaghan, T. V, van Oort, B., Dannevig, H., BayLarsen, I. A., Ims, R. A., & Aspholm, P. E. (2015). Future changes in the supply of goods and services from natural ecosystems: Prospects for the European North. Ecology and Society, 20(3), 32. http://doi.org/10.5751/ES-07607-200332 Jäppinen, J.-P., & Heliölä, J. (Eds.). (2015). Towards a sustainable and genuinely green economy. The value and social significance of ecosystem services in Finland (TEEB for Finland). Helsinki, Finland: Ministry of the Environment. Jax, K., Barton, D. N., Chan, K. M. A., de Groot, R., Doyle, U., Eser, U., Görg, C., Gómez-Baggethun, E., Griewald, Y., Haber, W., Haines-Young, R., Heink, U., Jahn, T., Joosten, H., Kerschbaumer, L., Korn, H., Luck, G. W., Matzdorf, B., Muraca, B., Neßhöver, C., Norton, B., Ott, K., Potschin, M., Rauschmayer, F., von Haaren, C., & Wichmann, S. (2013). Ecosystem services and ethics. Ecological Economics, 93, 260–268. http://doi. org/10.1016/j.ecolecon.2013.06.008 Jay, M., Peters, K., Buijs, A. E., Gentin, S., Kloek, M. E., & O’Brien, L. (2012). Towards access for all? Policy and research on access of ethnic minority groups to natural areas in four European countries. Forest Policy and Economics, 19, 4–11. http://doi.org/10.1016/j.forpol.2011.12.008
Jensena, S., Mazhitova, Z., & Zetterstrom, R. (1997). Environmental pollution and child health in the Aral Sea region in Kazakhstan. Science of the Total Environment, 206(2–3), 187–193. JNCC. (2007). Second Report by the UK under Article 17 on the implementation of the Habitats Directive from January 2001 to December 2006. Jobstvogt, N., Watson, V., & Kenter, J. O. (2014). Looking below the surface: The cultural ecosystem service values of UK marine protected areas (MPAs). Ecosystem Services, 10, 97–110. http://doi. org/10.1016/j.ecoser.2014.09.006 Johann, E. (2007). Traditional forest management under the influence of science and industry: The story of the alpine cultural landscapes. Forest Ecology and Management, 249(1–2), 54–62. http://doi. org/10.1016/j.foreco.2007.04.049 Johnston, J. L., Fanzo, J. C., & Bogil, B. (2014). Understanding sustainable diets: A descriptive analysis of the determinants and processes that influence diets and their impact on health, food security and environmental sustainability. Advances in Nutrition, 5(4), 418–429. http://doi. org/10.3945/an.113.005553 Jones, A., Panagos, P., Barcelo, S., & Bouraoui, F. (2012). The state of soil in Europe. http://doi.org/10.2788/77361 Jones, L., Provins, A., Holland, M., Mills, G., Hayes, F., Emmett, B., Hall, J., Sheppard, L., Smith, R., Sutton, M., Hicks, K., Ashmore, M., Haines-Young, R., & Harper-Simmonds, L. (2014). A review and application of the evidence for nitrogen impacts on ecosystem services. Ecosystem Services, 7, 76–88. http://doi. org/10.1016/j.ecoser.2013.09.001 Jonsson, L., Uddstål, R., Försöksparker, V., & Lantbruksuniversitet, S. (2002). En beskrivning av den svenska skogsbärbranschen [A description of the Swedish forest berry industry]. Jonsson, R. (2013). How to cope with changing demand conditions - The Swedish forest sector as a case study: an analysis of major drivers of change in the use of wood resources. Canadian Journal of
Forest Research, 43, 405–418. http://doi. org/10.1139/cjfr-2012-0139 Joppa, L. N., & Pfaff, A. (2009). High and far: Biases in the location of protected areas. PLOS ONE, 4(12), e8273. http://doi. org/10.1371/journal.pone.0008273 Jorda, G., Marba, N., & Duarte, C. M. (2012). Mediterranean seagrass vulnerable to regional climate warming. Nature Climate Change, 2(11), 821–824. http://doi. org/10.1038/NCLIMATE1533 Jueterbock, A., Tyberghein, L., Verbruggen, H., Coyer, J. A., Olsen, J. L., & Hoarau, G. (2013). Climate change impact on seaweed meadow distribution in the North Atlantic rocky intertidal. Ecology and Evolution, 3(5), 1356–1373. http://doi. org/10.1002/ece3.541 Kabisch, N., & Haase, D. (2013). Green spaces of European cities revisited for 19902006. Landscape and Urban Planning, 110(1), 113–122. http://doi.org/10.1016/j. landurbplan.2012.10.017 Kabisch, N., & Haase, D. (2014). Green justice or just green? Provision of urban green spaces in Berlin, Germany. Landscape and Urban Planning, 122, 129–139. http://doi.org/10.1016/j. landurbplan.2013.11.016 Kabisch, N., Strohbach, M., Haase, D., & Kronenberg, J. (2016). Urban green space availability in European cities. Ecological Indicators. http://doi.org/10.1016/j. ecolind.2016.02.029 Kain, J.-H., Larondelle, N., Haase, D., & Kaczorowska, A. (2016). Exploring local consequences of two land-use alternatives for the supply of urban ecosystem services in Stockholm year 2050. Ecological Indicators, 70, 615–629. http://doi. org/10.1016/j.ecolind.2016.02.062 Kaltenborn, B. P., & Bjerke, T. (2002). Association between environmental value orientations and landscape preferences. Landscape and Urban Planning, 59(1), 1–11. http://doi.org/10.1016/S01692046(01)00243-2 Kamenos, N. A., Moore, G., & Hallspencer, J. M. (2004). Nursery-area function of maerl grounds for juvenile queen scallops Aequipecten opercularis
169
THE REGIONAL ASSESSMENT REPORT ON BIODIVERSITY AND ECOSYSTEM SERVICES FOR EUROPE AND CENTRAL ASIA
and other invertebrates. Marine Ecology Progress Series, 274, 183–189. http://doi. org/10.3354/meps274183 Kandiyoti, D. (2007). Introduction. In D. Kandiyoti (Ed.), The cotton sector in Central Asia, proceedings of a conference held at SOAS University of London 3–4 November 2005 (pp. 1–11). Kangas, K., & Markkanen, P. (2001). Factors affecting participation in wild berry picking by rural and urban dwellers. Silva Fennica, 35(4), 582. http://doi. org/10.14214/sf.582 Kaplan, R., & Kaplan, S. (1989). The Experience of Nature. Cambridge, UK: Cambridge University Press. Karabulut, A., Egoh, B. N., Lanzanova, D., Grizzetti, B., Bidoglio, G., Pagliero, L., Bouraoui, F., Aloe, A., Reynaud, A., Maes, J., Vandecasteele, I., & Mubareka, S. (2016). Mapping water provisioning services to support the ecosystem–water–food–energy nexus in the Danube river basin. Ecosystem Services, 17, 278–292. http://doi.org/10.1016/j. ecoser.2015.08.002 Karadeniz, N., Tırıl, A., & Baylan, E. (2009). Wetland management in Turkey: Problems, achievements and perspectives, African Journal of Agricultural Research, 4(11), 1106–1119. Karesh, W. B., & Formenty, P. (2015). Infectious diseases. In WHO & CBD, Connecting global priorities: Biodiversity and human health: A state of knowledge review (pp. 130-149). http://doi.org/10.13140/ RG.2.1.3679.6565 Karlen, D. L., Mausbach, M. J., Doran, J. W., Cline, R. G., Harris, R. F., & Schuman, G. E. (1997). Soil quality: A concept, definition, and framework for evaluation. Soil Science Society America Journal, 61, 4–10. http://doi.org/10.2136/ sssaj1997.03615995006100010001x Karlsson, J., & Sjöström, M. (2008). Direct use values and passive use values: Implications for conservation of large carnivores. Biodiversity and Conservation, 17(4), 883–891. http://doi.org/10.1007/ s10531-008-9334-3
170
Kassam, K.-A., Karamkhudoeva, M., Ruelle, M., & Baumflek, M. (2010). Medicinal plant use and health sovereignty: Findings from the Tajik and Afghan Pamirs. Human Ecology, 38(6), 817–829. http://doi. org/10.1007/s10745-010-9356-9 Kastner, T., Erb, K.-H., & Haberl, H. (2014). Rapid growth in agricultural trade: effects on global area efficiency and the role of management. Environmental Research Letters, 9(3), 34015. http://doi. org/10.1088/1748-9326/9/3/034015 Kastner, T., Erb, K.-H., & Haberl, H. (2015). Global human appropriation of net primary production for biomass consumption in the European Union, 19862007. Journal of Industrial Ecology, 19(5), 825–836. http://doi.org/10.1111/jiec.12238 Kastner, T., Erb, K.-H., & Nonhebel, S. (2011). International wood trade and forest change: A global analysis. Global Environmental Change, 21(3), 947–956. http://doi.org/10.1016/j. gloenvcha.2011.05.003 Kayranli, B., Scholz, M., Mustafa, A., & Hedmark, Å. (2010). Carbon storage and fluxes within freshwater wetlands: A critical review. Wetlands, 30(1), 111–124. http://doi. org/10.1007/s13157-009-0003-4 Kedem, H., Cohen, C., Messika, I., Einav, M., Pilosof, S., & Hawlena, H. (2014). Multiple effects of host-species diversity on coexisting host-specific and host-opportunistic microbes. Ecology, 95(5), 1173–1183. http://doi.org/10.1890/130678.1 Keenleyside, C., Beaufoy, G., Tucker, G., & Jones, G. (2014). High nature value farming throughout EU-27 and its financial support under the CAP. Kenis, M., & Branco, M. (2010). Impact of alien terrestrial arthropods in Europe. Chapter 5. BioRisk, 4(1), 51–71. http://doi. org/10.3897/biorisk.4.42 Kenter, J. O., Bryce, R., Christie, M., Cooper, N., Hockley, N., Irvine, K. N., Fazey, I., O’Brien, L., Orchard-Webb, J., Ravenscroft, N., Raymond, C. M., Reed, M. S., Tett, P., & Watson, V. (2016). Shared values and deliberative valuation: Future directions. Ecosystem Services,
21, 358–371. http://doi.org/10.1016/j. ecoser.2016.10.006 Kenter, J. O., O’Brien, L., Hockley, N., Ravenscroft, N., Fazey, I., Irvine, K. N., Reed, M. S., Christie, M., Brady, E., Bryce, R., Church, A., Cooper, N., Davies, A., Evely, A., Everard, M., Fish, R., Fisher, J. A., Jobstvogt, N., Molloy, C., Orchard-Webb, J., Ranger, S., Ryan, M., Watson, V., & Williams, S. (2015). What are shared and social values of ecosystems? Ecological Economics, 111, 86–99. http://doi.org/10.1016/j. ecolecon.2015.01.006 Kerr, J. T., Pindar, A., Galpern, P., Packer, L., Potts, S. G., Roberts, S. M., Rasmont, P., Schweiger, O., Colla, S. R., Richardson, L. L., Wagner, D. L., Gall, L. F., Sikes, D. S., & Pantoja, A. (2015). Climate change impacts on bumblebees converge across continents. Science, 349(6244), 177–180. http://doi. org/10.1126/science.aaa7031 Khalil, H., Ecke, F., Evander, M., Magnusson, M., & Hörnfeldt, B. (2016). Declining ecosystem health and the dilution effect. Scientific Reports, 6, 31314. http:// doi.org/10.1038/srep31314 Kikvidze, Z., & Tevzadze, G. (2015). Loss of traditional knowledge aggravates wolf– human conflict in Georgia (Caucasus) in the wake of socio-economic change. Ambio, 44(5), 452–457. http://doi.org/10.1007/ s13280-014-0580-1 Kirazli, C., & Yamac, E. (2013). Population size and breeding success of the cinereous Vulture, Aegypius monachus, in a newly found breeding area in western Anatolia (Aves: Falconiformes). Zoology in the Middle East, 59(4), 289–296. http://doi.org/10.108 0/09397140.2013.868129 Kis, J., Barta, S., Elekes, L., Engi, L., Fegyver, T., Kecskeméti, J., Lajkó, L., & Szabó, J. (2017). Traditional herders’ knowledge and worldview and their role in managing biodiversity and ecosystemservices of extensive pastures. In M. Roué & Z. Molnár (Eds.), Knowing our lands and resources: Indigenous and local knowledge of biodiversity and ecosystem services in Europe and Central Asia (pp. 57–71). Paris, France: UNESCO.
CHAPTER 2. NATURE’S CONTRIBUTIONS TO PEOPLE AND QUALITY OF LIFE
Kitzes, J., & Wackernagel, M. (2009). Answers to common questions in ecological footprint accounting. Ecological Indicators, 9(4), 812–817. http://doi.org/10.1016/j. ecolind.2008.09.014
Krasznai Kovács, E., & Mihók, B. (2015). Understanding the links between ecosystem service trade-offs and conflicts in protected areas. Ecosystem Services, 12, 117–127. http://doi.org/10.1016/j.ecoser.2014.09.012
Kizmaz, M. (2003). Policies to promote sustainable forest operations and utilization of non-wood forest products. In Harvesting of non-wood forest products (pp. 97-112).
Kovařík, P., Kutal, M., & Machar, I. (2014). Sheep and wolves: Is the occurrence of large predators a limiting factor for sheep grazing in the Czech Carpathians? Journal for Nature Conservation, 22(5), 479–486. http://doi.org/10.1016/j.jnc.2014.06.001
Kizos, T., Plieninger, T., & Schaich, H. (2013). “Instead of 40 sheep there are 400”: Traditional grazing practices and landscape change in western Lesvos, Greece. Landscape Research, 38(4), 476–498. http://doi.org/10.1080/01426397.2013.7 83905 Klein, A.-M., Vaissière, B. E., Cane, J. H., Steffan-Dewenter, I., Cunningham, S. A., Kremen, C., & Tscharntke, T. (2007). Importance of pollinators in changing landscapes for world crops. Proceedings of the Royal Society B: Biological Sciences, 274(1608), 303-313. http://doi.org/10.1098/ rspb.2006.3721 Klinar, K., & Geršič, M. (2014). Traditional house names as part of cultural heritage. Acta Geographica Slovenica, 54(2). http:// doi.org/10.3986/AGS54409 Knarrum, V., Sørensen, O. J., Eggen, T., Kvam, T., Opseth, O., Overskaug, K., & Eidsmo, A. (2006). Brown bear predation on domestic sheep in central Norway. Ursus, 17(1), 67–74. http://doi. org/10.2192/1537-6176(2006)17[67:BBPO DS]2.0.CO;2 Köbbing, J. F., Thevs, N., & Zerbe, S. (2013). The utilisation of reed (Phragmites australis): A review. Mires and Peat, 13, 1–14. Konijnendijk, C. C., Annerstedt, M., Nielsen, A. B., & Maruthaveeran, S. (2013). Benefits of urban parks: A systematic review. Konow, J. (2003). Which Is the fairest one of all? A positive analysis of justice theories. Journal of Economic Literature, 41(4), 1188–1239. http://doi. org/10.1257/002205103771800013 Kovács, E., Kelemen, E., Kalóczkai, Á., Margóczi, K., Pataki, G., Gébert, J., Málovics, G., Balázs, B., Roboz, Á.,
Kovats, R., Valentini, R., Bouwer, L. M., Georgopoulou, E., Jacob, D., Martin, E., Rounsevell, M., & Soussana, J.-F. (2014). Europe. In V. R. Barros, C. B. Field, D. J. Dokken, M. D. Mastrandrea, K. J. Mach, T. E. Billir, M. Chatterjee, M., K. L. Ebi, Y. O. Estrada, R. C. Genova, B. Girma, E. S. Kissel, A. N. Levy, S. MacCracken, P. R. Mastrandrea, & L. L. White (Eds.), Climate change 2014: Impacts, adaptation, and vulnerability. Part B: Regional aspects. Contribution of working group II to the fifth assessment report of the Intergovernmental Panel on Climate Change (pp. 1267–1327). Cambridge, United Kingdom: Cambridge University Press. Kraemer, R., Prishchepov, A. V., Müller, D., Kuemmerle, T., Radeloff, V. C., Dara, A., Terekhov, A., & Frühauf, M. (2015). Long-term agricultural land-cover change and potential for cropland expansion in the former virgin lands area of Kazakhstan. Environmental Research Letters, 10(5), 54012. http://doi.org/10.1088/17489326/10/5/054012
Advances, 2(12). e1501938. http://doi. org/10.1126/sciadv.1501938 Kreft, S., Eckstein, D., Dorsch, L., & Fischer, L. (2016). Global climate risk index 2016: Who suffers most from extreme weather events? Weather-related loss events in 2014 and 1995 to 2014. Kroeker, K. J., Kordas, R. L., Crim, R., Hendriks, I. E., Ramajo, L., Singh, G. S., Duarte, C. M., & Gattuso, J.-P. (2013). Impacts of ocean acidification on marine organisms: quantifying sensitivities and interaction with warming. Global Change Biology, 19(6), 1884–1896. http://doi. org/10.1111/gcb.12179 Kronenberg, J. (2014). Viable alternatives for large-scale unsustainable projects in developing countries: The case of the Kumtor gold mine in Kyrgyzstan. Sustainable Development, 22(4), 253–264. http://doi.org/10.1002/sd.1529 Kronenberg, J. (2015). Why not to green a city? Institutional barriers to preserving urban ecosystem services. Ecosystem Services, 12, 218–227. http://doi. org/10.1016/j.ecoser.2014.07.002 Krutilla, J. V. (1967). Conservation reconsidered. The American Economic Review, 57(4), 777–786.
Krause-Jensen, D., & Duarte, C. M. (2014). Expansion of vegetated coastal ecosystems in the future Arctic. Frontiers in Marine Science, 1, 77. http://doi. org/10.3389/fmars.2014.00077
Kuemmerle, T., Olofsson, P., Chaskovskyy, O., Baumann, M., Ostapowicz, K., Woodcock, C. E., Houghton, R. A., Hostert, P., Keeton, W. S., & Radeloff, V. C. (2011). Post-Soviet farmland abandonment, forest recovery, and carbon sequestration in western Ukraine. Global Change Biology, 17(3), 1335–1349. http://doi.org/10.1111/j.13652486.2010.02333.x
Krause-Jensen, D., Duarte, C. M., Hendriks, I. E., Meire, L., Blicher, M. E., Marbà, N., & Sejr, M. K. (2015). Macroalgae contribute to nested mosaics of pH variability in a subarctic fjord. Biogeosciences, 12(16), 4895–4911. http:// doi.org/10.5194/bg-12-4895-2015
Kulikov, M., Schickhoff, U., & Borchardt, P. (2016). Spatial and seasonal dynamics of soil loss ratio in mountain rangelands of south-western Kyrgyzstan. Journal of Mountain Science, 13(2), 316–329. http://doi.org/10.1007/s11629014-3393-6
Krause-Jensen, D., Marbà, N., SanzMartin, M., Hendriks, I. E., Thyrring, J., Carstensen, J., Sejr, M. K., & Duarte, C. M. (2016). Long photoperiods sustain high pH in Arctic kelp forests. Science
Kumar, R., Tol, S., McInnes, R. J., Everard, M., & Kulindwa, A. A. (2017). Wetlands for disaster risk reduction: Effective choices for resilient communities. Ramsar policy brief 1. Gland, Switzerland: Ramsar Convention Secretariat.
171
THE REGIONAL ASSESSMENT REPORT ON BIODIVERSITY AND ECOSYSTEM SERVICES FOR EUROPE AND CENTRAL ASIA
Kummu, M., Guillaume, J. H. A., de Moel, H., Eisner, S., Flörke, M., Porkka, M., Siebert, S., Veldkamp, T. I. E., & Ward, P. J. (2016). The world’s road to water scarcity: shortage and stress in the 20th century and pathways towards sustainability. Scientific Reports, 6, 38495. http://doi.org/10.1038/srep38495 Kurganova, I., Lopes de Gerenyu, V., & Kuzyakov, Y. (2015). Large-scale carbon sequestration in post-agrogenic ecosystems in Russia and Kazakhstan. Catena, 133, 461–466. http://doi.org/10.1016/j. catena.2015.06.002 Lagos, L., & Bárcena, F. (2015). EU sanitary regulation on livestock disposal: Implications for the diet of wolves. Environmental Management, 56(4), 890–902. http://doi.org/10.1007/s00267015-0571-4 Lal, R. (2001a). Potential of desertification control to sequester carbon and mitigate the greenhouse effect. Climatic Change, 51(1), 35–72. http://doi. org/10.1023/A:1017529816140 Lal, R. (2001b). Soil degradation by erosion. Land Degradation & Development, 12, 519–539. http://doi.org/10.1002/ldr.472 Lange, E., & Hehl-Lange, S. (2011). Citizen participation in the conservation and use of rural landscapes in Britain: The Alport Valley case study. Landscape and Ecological Engineering, 7(2), 223–230. http://doi. org/10.1007/s11355-010-0115-2 Langemeyer, J., Baro, F., Roebeling, P., & Gómez-Baggethun, E. (2015). Contrasting values of cultural ecosystem services in urban areas: The case of park Montjuic in Barcelona. Ecosystem Services, 12, 178–186. http://doi.org/10.1016/j. ecoser.2014.11.016 Larondelle, N., Haase, D., & Kabisch, N. (2014). Mapping the diversity of regulating ecosystem services in European cities. Global Environmental Change, 26(1), 119–129. http://doi.org/10.1016/j. gloenvcha.2014.04.008 Lavalle, C., Micale, F., Houston, T. D., Camia, A., Hiederer, R., Lazar, C., Conte, C., Amatulli, G., & Genovese, G. (2009). Climate change in Europe. 3. Impact on agriculture and forestry. A review.
172
Agronomy for Sustainable Development, 29(3), 433–446. http://doi.org/10.1051/ agro/2008068 Lavrillier, A., Gabyshev, S., & Rojo, M. (2016). The sable for Evenk reindeer herders in southeastern Siberia: Interplaying drivers of changes on biodiversity and ecosystem services – Climate change, worldwide market economy, and extractive industries. In M. Roué & Z. Molnar (Eds.), Knowing our lands and resources: Indigenous and local knowledge of biodiversity and ecosystem services in Europe and Central Asia (pp. 111–128). Paris, France: UNESCO. Le, Q. B., Nkonya, E., & Mirzabaev, A. (2014). Biomass productivity-based mapping of global land degradation hotspots. In: E. Nkonya, A. Mirzabaev, & J. von Braun (Eds.), Economics of Land Degradation and Improvement – A Global Assessment for Sustainable Development (pp. 55-84). Bonn, Germany: Springer. Le Bissonnais, Y., & Arrouays, D. (1997). Aggregate stability and assessment of soil crustability and erodibility: II. Application to humic loamy soils with various organic carbon contents. European Journal of Soil Science, 48(1), 39–48. http://doi. org/10.1111/j.1365-2389.1997.tb00183.x Lee, A. C. K., & Maheswaran, R. (2011). The health benefits of urban green spaces: a review of the evidence. Journal of Public Health, 33(2), 212–22. http://doi. org/10.1093/pubmed/fdq068 Lemasson, A. J., Fletcher, S., HallSpencer, J. M., & Knights, A. M. (2017). Linking the biological impacts of ocean acidification on oysters to changes in ecosystem services: A review. Journal of Experimental Marine Biology and Ecology, 492(Suppl.), 49–62. http://doi. org/10.1016/j.jembe.2017.01.019 Leonti, M., & Casu, L. (2013). Traditional medicines and globalization: Current and future perspectives in ethnopharmacology. Frontiers in Pharmacology, 4(92), 1-13. http://doi.org/10.3389/fphar.2013.00092 Leonti, M., & Verpoorte, R. (2017). Traditional Mediterranean and European herbal medicines. Journal of Ethnopharmacology, 199, 161–167. http:// doi.org/10.1016/j.jep.2017.01.052
Leuzinger, S., Vogt, R., & Körner, C. (2010). Tree surface temperature in an urban environment. Agricultural and Forest Meteorology, 150(1), 56–62. http://doi. org/10.1016/j.agrformet.2009.08.006 Libralato, S., Coll, M., Tudela, S., Palomera, I., & Pranovi, F. (2008). Novel index for quantification of ecosystem effects of fishing as removal of secondary production. Marine Ecology Progress Series, 355, 107–129. http://doi.org/10.3354/ meps07224 Lindemann-Matthies, P., Briegel, R., Schüpbach, B., & Junge, X. (2010). Aesthetic preference for a Swiss alpine landscape: The impact of different agricultural land-use with different biodiversity. Landscape and Urban Planning, 98(2), 99–109. http://doi.org/10.1016/j. landurbplan.2010.07.015 Linnell, J. D. C., & Lescureux, N. (2015). Livestock guarding dogs: Cultural heritage icons with a new relevance for mitigating conservation conflicts. Trondheim, Norway: Norwegian Institute for Nature Research (NINA). Lioubimtseva, E. (2015). A multi-scale assessment of human vulnerability to climate change in the Aral Sea basin. Environmental Earth Sciences, 73(2), 719–729. http://doi.org/10.1007/s12665014-3104-1 Liquete, C., Cid, N., Lanzanova, D., Grizzetti, B., & Reynaud, A. (2016a). Perspectives on the link between ecosystem services and biodiversity: The assessment of the nursery function. Ecological Indicators, 63, 249–257. http://doi.org/10.1016/j. ecolind.2015.11.058 Liquete, C., Piroddi, C., Macías, D., Druon, J.-N., & Zulian, G. (2016b). Ecosystem services sustainability in the Mediterranean Sea: Assessment of status and trends using multiple modelling approaches. Scientific Reports, 6, 34162. http://doi.org/10.1038/srep34162 Liu, J., Yang, W., & Li, S. (2016). Framing ecosystem services in the telecoupled Anthropocene. Frontiers in Ecology and the Environment, 14(1), 27–36. http://doi. org/10.1002/16-0188.1
CHAPTER 2. NATURE’S CONTRIBUTIONS TO PEOPLE AND QUALITY OF LIFE
Lorencova, E., Frelichova, J., Nelson, E., & Vackar, D. (2013). Past and future impacts of land use and climate change on agricultural ecosystem services in the Czech Republic. Land Use Policy, 33, 183–194. http://doi.org/10.1016/j. landusepol.2012.12.012 Lorenz, K., & Lal, R. (2016). Soil organic carbon – An appropriate indicator to monitor trends of land and soil degradation within the SDG framework? Dessau-Roßlau, Germany: Umweltbundesamt. Lozano, J., Casanovas, J. G., Zorrilla, J. M., Lozano, J., Casanovas, J. G., Virgós, E., & Zorrilla, J. M. (2013). The competitor release effect applied to carnivore species: How red foxes can increase in numbers when persecuted. Animal Biodiversity and Conservation, 36(1), 37-46. Lozej, Š. L. (2013). Paša in predelava mleka v planinah Triglavskega narodnega parka: Kulturna dediščina in aktualna vprašanja. [Grazing and dairying in the mountain pastures of Triglav National Park: cultural heritage and current questions]. Traditiones, 42(2), 49–68. http://doi. org/10.3986/traditio2013420203 Łuczaj, Ł., Köhler, P., Pirożnikow, E., Graniszewska, M., Pieroni, A., & Gervasi, T. (2013). Wild edible plants of Belarus: from Rostafiński’s questionnaire of 1883 to the present. Journal of Ethnobiology and Ethnomedicine, 9(1), 21. http://doi. org/10.1186/1746-4269-9-21 Łuczaj, Ł., Pieroni, A., Tardío, J., Pardo-de-Santayana, M., Sõukand, R., Svanberg, I., & Kalle, R. (2012). Wild food plant use in 21st century Europe: the disappearance of old traditions and the search for new cuisines involving wild edibles. Acta Societatis Botanicorum Poloniae, 81(4), 359–370. http://doi. org/10.5586/asbp.2012.031 Łuczaj, Ł., Stawarczyk, K., Kosiek, T., Pietras, M., & Kujawa, A. (2015). Wild food plants and fungi used by Ukrainians in the western part of the Maramureş region in Romania. Acta Societatis Botanicorum Poloniae, 84(3), 339–346. http://doi. org/10.5586/asbp.2015.029 Lugato, E., Bampa, F., Panagos, P., Montanarella, L., & Jones, A. (2014). Potential carbon sequestration of European
arable soils estimated by modelling a comprehensive set of management practices. Global Change Biology, 20(11), 3557-3567. http://doi.org/10.1111/ gcb.12551 Lutz, S. R., Mallucci, S., Diamantini, E., Majone, B., Bellin, A., & Merz, R. (2016). Hydroclimatic and water quality trends across three Mediterranean river basins. Science of the Total Environment, 571, 1392–1406. http://doi.org/10.1016/j. scitotenv.2016.07.102 Maffi, L. (2005). Linguistic, cultural, and biological diversity. Annual Review of Anthropology, 34(1), 599–617. http://doi.org/10.1146/annurev. anthro.34.081804.120437 Makó, A., Kocsis, M., Barna, G., & Tóth, G. (2017). Mapping the storing and filtering capacity of European soils. Luxembourg: Publications Office of the European Union. http://doi. org/10.2788/49218 Mallarch, J. -M., Papayannis, T., & Väisänen, R. (Eds.). (2012). The diversity of sacred lands in Europe: Proceedings of the third workshop of the Delos initiative – Inari/ Aanaar 2010. Gland, Switzerland: IUCN and Vantaa, Finland: Metsähallitus Natural Heritage Services. Manes, F., Marando, F., Capotorti, G., Blasi, C., Salvatori, E., Fusaro, L., Ciancarella, L., Mircea, M., Marchetti, M., Chirichi, G.,& Munafò, M. (2016). Regulating ecosystem services of forests in ten Italian metropolitan cities: Air quality improvement by PM10 and O3 removal. Ecological Indicators, 67, 425–440. http:// doi.org/10.1016/j.ecolind.2016.03.009 Mangialajo, L., Gianni, F., Airoldi, L., Bartolini, F., Francour, P., Meinesz, A., Thibaut, T., & Ballesteros, E. (2013). Conservation and restoration of Cystoseira forests in the Mediterranean Sea: The role of marine protected areas. Retrieved from https://www.researchgate.net/profile/ Patrice_Francour/publication/268278685_ Conservation_and_restoration_of_ Cystoseira_forests_in_the_Mediterranean_ sea_the_role_of_marine_protected_areas/ links/54678b220cf2f5eb18036bee/ Conservation-and-restoration-of-Cystoseiraforests-in-the-Mediterranean-sea-the-roleof-marine-protected-areas.pdf
Manzano, P., & Malo, J. E. (2006). Extreme long-distance seed dispersal via sheep. Frontiers in Ecology and the Environment, 4, 244-248. http:// doi.org/10.1016/10.1890/15409295(2006)004[0244:ELSDVS]2.0.CO;2 Marando, F., Salvatori, E., Fusaro, L., & Manes, F. (2016). Removal of PM10 by forests as a nature-based solution for air quality improvement in the Metropolitan city of Rome. Forests, 7(7), 150. http://doi. org/10.3390/f7070150 Margalida, A., Bogliani, G., Bowden, C. G. R., Donázar, J. A., Genero, F., Gilbert, M., Karesh, W. B., Kock, R., Lubroth, J., Manteca, X., Naidoo, V., Neimanis, A., Sánchez-Zapata, J. A., Taggart, M. A., Vaarten, J., Yon, L., Kuiken, T., & Green, R. E. (2014a). One health approach to use of veterinary pharmaceuticals. Science, 346(6215), 1296–1298. http://doi. org/10.1126/science.1260260 Margalida, A., & Colomer, M. À. (2012). Modelling the effects of sanitary policies on European vulture conservation. Scientific Reports, 2(1), 753. http://doi.org/10.1038/ srep00753 Margalida, A., Donázar, J. A., Carrete, M., & Sánchez-Zapata, J. A. (2010). Sanitary versus environmental policies: Fitting together two pieces of the puzzle of European vulture conservation. Journal of Applied Ecology, 47(4), 931–935. http://doi. org/10.1111/j.1365-2664.2010.01835.x Margalida, A., & Moleón, M. (2016). Toward carrion-free ecosystems? Frontiers in Ecology and the Environment, 14(4), 183–184. http://doi.org/10.1002/fee.1261 Margalida, A., Sánchez-Zapata, J. A., Blanco, G., Hiraldo, F., & Donázar, J. A. (2014b). Diclofenac approval as a threat to Spanish vultures. Conservation Biology, 28(3), 631–632. http://doi.org/10.1111/ cobi.12271 Markus-Johansson, M., Mesquita, B., Nemeth, A., Dimovski, M., Monnier, C., & Kiss-Parciu Szentendre, P. (2010). Illegal Logging in South Eastern Europe. Szentendre, Hungary: Regional Environmental Center. Martín-López, B., Gómez-Baggethun, E., García-Llorente, M., & Montes, C.
173
THE REGIONAL ASSESSMENT REPORT ON BIODIVERSITY AND ECOSYSTEM SERVICES FOR EUROPE AND CENTRAL ASIA
(2014). Trade-offs across value-domains in ecosystem services assessment. Ecological Indicators, 37, 220–228. http://doi. org/10.1016/j.ecolind.2013.03.003 Martín-López, B., Gómez-Baggethun, E., Lomas, P. L., & Montes, C. (2009). Effects of spatial and temporal scales on cultural services valuation. Journal of Environmental Management, 90(2), 1050–1059. http://doi.org/10.1016/j. jenvman.2008.03.013 Martín-Lopez, B., Iniesta-Arandia, I., Garcia-Llorente, M., Palomo, I., Casado-Arzuaga, I., Del Amo, D. G., Gomez-Baggethun, E., Oteros-Rozas, E., Palacios-Agundez, I., Willaarts, B., Gonzalez, J. A., Santos-Martin, F., Onaindia, M., Lopez-Santiago, C., & Montes, C. (2012). Uncovering ecosystem service bundles through social preferences. PLoS ONE, 7(6). http://doi.org/10.1371/ journal.pone.0038970
Mateo-Tomás, P., Olea, P. P., Moleón, M., Vicente, J., Botella, F., Selva, N., Viñuela, J., & Sánchez-Zapata, J. A. (2015). From regional to global patterns in vertebrate scavenger communities subsidized by big game hunting. Diversity and Distributions, 21(8), 913–924. http://doi. org/10.1111/ddi.12330 Mateo-Tomás, P., Olea, P. P., SánchezBarbudo, I. S., & Mateo, R. (2012). Alleviating human-wildlife conflicts: Identifying the causes and mapping the risk of illegal poisoning of wild fauna. Journal of Applied Ecology, 49(2), 376–385. http://doi. org/10.1111/j.1365-2664.2012.02119.x
McBride, A. C., Dale, V. H., Baskaran, L. M., Downing, M. E., Eaton, L. M., Efroymson, R. A., Garten, C. T., Kline, K. L., Jager, H. I., Mulholland, P. J., Parish, E. S., Schweizer, P. E., & Storey, J. M. (2011). Indicators to support environmental sustainability of bioenergy systems. Ecological Indicators, 11(5), 1277–1289. http://doi.org/10.1016/j. ecolind.2011.01.010 Mccloskey, R. M., & Unsworth, R. K. F. (2015). Decreasing seagrass density negatively influences associated fauna. PeerJ, 3, e1053. http://doi.org/10.7717/ peerj.1053
Mattisson, J., Odden, J., & Linnell, J. D. C. (2015). A catch-22 conflict: Access to semi-domestic reindeer modulates Eurasian lynx depredation on domestic sheep. Biological Conservation, 179, 116–122. http://doi.org/10.1016/j. biocon.2014.09.004
McDermott, M., Mahanty, S., & Schreckenberg, K. (2013). Examining equity: A multidimensional framework for assessing equity in payments for ecosystem services. Environmental Science & Policy, 33, 416–427. http://doi.org/10.1016/j. envsci.2012.10.006
Martín-López, B., Montes, C., & Benayas, J. (2007). The non-economic motives behind the willingness to pay for biodiversity conservation. Biological Conservation, 139(1), 67–82. http://doi. org/10.1016/j.biocon.2007.06.005
Mattsson, B. J., & Vacik, H. (2017). Prospects for stakeholder coordination by protected-area managers in Europe. Conservation Biology, 32(1), 98-108. https:// onlinelibrary.wiley.com/doi/abs/10.1111/ cobi.12966
MCPFE, UNECE, & FAO. (2007). State of Europe’s forests 2007. The MCPFE report on sustainable forest management in Europe. Retrieved from https://www.unece. org/fileadmin/DAM/timber/publications/ State_of_europes_forests_2007.pdf
Martín-López, B., Montes, C., & Benayas, J. (2008). Economic valuation of biodiversity conservation: the meaning of numbers. Conservation Biology, 22(3), 624–35. http://doi.org/10.1016/10.1111/ j.1523-1739.2008.00921.x
Mauerhofer, V. (2016). Public participation in environmental matters: Compendium, challenges and chances globally. Land Use Policy, 52, 481–491. http://doi. org/10.1016/j.landusepol.2014.12.012
MEA. (2005). Ecosystems and human wellbeing: Synthesis. Washington, DC, USA: Island Press.
Martín-Vega, D., & Baz, A. (2011). Could the “vulture restaurants” be a lifeboat for the recently rediscovered bone-skippers (Diptera: Piophilidae)? Journal of Insect Conservation, 15(5), 747–753. http://doi. org/10.1007/s10841-011-9429-0 Martin, A., Coolsaet, B., Corbera, E., Dawson, N. M., Fraser, J. A., Lehman, I., & Rodriguez, I. (2016). Justice and conservation: The need to incorporate recognition. Biological Conservation, 197, 254–261. http://doi.org/10.1016/j. biocon.2016.03.021 Martínez de Aragón, J., Riera, P., Giergiczny, M., & Colinas, C. (2011). Value of wild mushroom picking as an environmental service. Forest Policy and Economics, 13(6), 419–424. http://doi. org/10.1016/j.forpol.2011.05.003
174
Mavsar, R., Japelj, A., & Kovač, M. (2013). Trade-offs between fire prevention and provision of ecosystem services in Slovenia. Forest Policy and Economics, 29, 62–69. http://doi.org/10.1016/j. forpol.2012.10.011 Mayer, A. L., Kauppi, P. E., Angelstam, P. K., Zhang, Y., & Tikka, P. M. (2005). Importing timber, exporting ecological impact. Science, 308(5720), 359–360. http://doi.org/10.1126/science.1109476 Maynou, F., Sbrana, M., Sartor, P., Maravelias, C., Kavadas, S., Damalas, D., Cartes, J. E., & Osio, G. (2011). Estimating trends of population decline in long-lived marine species in the Mediterranean Sea based on fishers’ perceptions. PLoS ONE, 6(7), e21818. http://doi.org/10.1371/journal. pone.0021818
Meyer, M. A., & Leckert, F. S. (2017). A systematic review of the conceptual differences of environmental assessment and ecosystem service studies of biofuel and bioenergy production. Biomass and Bioenergy. http://doi.org/10.1016/j. biombioe.2017.05.003 Meyer, M. A., Seppelt, R., Witing, F., & Priess, J. A. (2016). Making environmental assessments of biomass production systems comparable worldwide. Environmental Research Letters, 11(3), 34005. http://doi.org/10.1088/17489326/11/3/034005 Michelozzi, P., Accetta, G., De Sario, M., D’Ippoliti, D., Marino, C., Baccini, M., Biggeri, A., Anderson, H. R., Katsouyanni, K., Ballester, F., Bisanti, L., Cadum, E., Forsberg, B., Forastiere, F., Goodman, P. G., Hojs, A., Kirchmayer, U., Medina, S., Paldy, A., Schindler, C., Sunyer, J., &
CHAPTER 2. NATURE’S CONTRIBUTIONS TO PEOPLE AND QUALITY OF LIFE
Perucci, C. A. (2009). High temperature and hospitalizations for cardiovascular and respiratory causes in 12 European cities. American Journal of Respiratory and Critical Care Medicine, 179(5), 383–389. http://doi. org/10.1164/rccm.200802-217OC Micklin, P. (2007). The Aral Sea disaster. Annual Review of Earth and Planetary Sciences, 35, 47–72. http://doi.org/10.1146/annurev. earth.35.031306.140120 Middelboe, A. L., & Hansen, P. J. (2007). Direct effects of pH and inorganic carbon on macroalgal photosynthesis and growth. Marine Biology Research, 3(3), 134–144. http://doi. org/10.1080/17451000701320556 Mitchell, G. R., Biscaia, S., Mahendra, V. S., & Mateus, A. (2016). High value materials from the forests. Advances in Materials Physics and Chemistry, 6, 54–60. http://dx.doi.org/10.4236/ ampc.2016.63006 Mitchell, R. J., Richardson, E. A., Shortt, N. K., & Pearce, J. R. (2015). Neighborhood environments and socioeconomic inequalities in mental well-being. American Journal of Preventive Medicine, 49(1), 80–4. http://doi. org/10.1016/j.amepre.2015.01.017 Miura, S., Amacher, M., Hofer, T., San-Miguel-Ayanz, J., Ernawati, & Thackway, R. (2015). Protective functions and ecosystem services of global forests in the past quarter-century. Forest Ecology and Management, 352, 35–46. http://doi. org/10.1016/j.foreco.2015.03.039 Mocior, E., & Kruse, M. (2016). Educational values and services of ecosystems and landscapes – An overview. Ecological Indicators, 60, 137–151. http:// doi.org/10.1016/j.ecolind.2015.06.031 Moleón, M., & Sánchez-Zapata, J. A. (2015). The living dead: Time to integrate scavenging into ecological teaching. BioScience, 65(10), 1003–1010. http://doi. org/10.1093/biosci/biv101 Moleón, M., Sánchez-Zapata, J. A., Selva, N., Donázar, J. A., & OwenSmith, N. (2014). Inter-specific interactions linking predation and scavenging in terrestrial vertebrate assemblages. Biological
Reviews, 89(4), 1042–1054. http://doi. org/10.1111/brv.12097 Molnár, Z. (2014). Perception and management of spatio-temporal pasture heterogeneity by Hungarian herders. Rangeland Ecology & Management, 67(2), 107–118. http://doi.org/10.2111/ REM-D-13-00082.1 Molnár, Z., Safian, L., Mate, J., Barta, S., Suto, D. P., Molnar, A., & Varga, A. (2017). “It does matter who leans on the stick”: Hungarian herders’ perspectives on biodiversity, ecosystem services and their drivers. In M. Roué & Z. Molnár (Eds.), Knowing our lands and resources: Indigenous and local knowledge of biodiversity and ecosystem services in Europe and Central Asia (pp. 42–56). Paris, France: UNESCO. Montanarella, L., Pennock, D. J., McKenzie, N. J., Badraoui, M., Chude, V., Baptista, I., Mamo, T., Yemefack, M., Singh Aulakh, M., Yagi, K., Young Hong, S., Vijarnsorn, P., Zhang, G.-L., Arrouays, D., Black, H., Krasilnikov, P., Sobocká, J., Alegre, J., Henriquez, C. R., Mendonça-Santos, M. L., Taboada, M., Espinosa-Victoria, D., AlShankiti, A., AlaviPanah, S. K., Elsheikh, E. A. E., Hempel, J., Camps Arbestain, M., Nachtergaele, F., & Vargas, R. (2015). World’s soils are under threat. SOIL, 2, 79-82. http://doi.org/10.5194/ soild-2-1263-2015 Moore, P. G. (2003). Seals and fisheries in the Clyde Sea area (Scotland): traditional knowledge informs science. Fisheries Research, 63(1), 51–61. http://doi. org/10.1016/S0165-7836(03)00003-1 Morales-Reyes, Z., Martín-López, B., Moleón, M., Mateo-Tomás, P., Botella, F., Margalida, A., Donázar, J. A., Blanco, G., Pérez, I., & SánchezZapata, J. A. (2017a). Farmer perceptions of the ecosystem services provided by scavengers: What, who, and to whom. Conservation Letters. http://doi. org/10.1111/conl.12392 Morales-Reyes, Z., Pérez-García, J. M., Moleón, M., Botella, F., Carrete, M., Donázar, J. A., Cortés-Avizanda, A., Arrondo, E., Moreno-Opo, R., Jiménez, J., Maralida, A., & SánchezZapata, J. A. (2017b). Evaluation of the
network of protection areas for the feeding of scavengers in Spain: from biodiversity conservation to greenhouse gas emission savings. Journal of Applied Ecology, 54(4), 1120–1129. http://doi.org/10.1111/13652664.12833 Morales-Reyes, Z., Pérez-García, J. M., Moleón, M., Botella, F., Carrete, M., Lazcano, C., Moreno-Opo, R., Margalida, A., Donázar, J. A., & Sánchez-Zapata, J. A. (2015). Supplanting ecosystem services provided by scavengers raises greenhouse gas emissions. Scientific Reports, 5(1), 7811. http://doi.org/10.1038/ srep07811 Morales-Reyes, Z., Sánchez-Zapata, J. A., Sebastián-González, E., Botella, F., Carrete, M., & Moleón, M. (2017c). Scavenging efficiency and red fox abundance in Mediterranean mountains with and without vultures. Acta Oecologica, 79, 81–88. http://doi.org/10.1016/j. actao.2016.12.012 Mortberg, U., Haas, J., Zetterberg, A., Franklin, J. P., Jonsson, D., & Deal, B. (2013). Urban ecosystems and sustainable urban development-analysing and assessing interacting systems in the Stockholm region. Urban Ecosystems, 16(4), 763–782. http:// doi.org/10.1007/s11252-012-0270-3 Moseley, C. (2010). Atlas of the world’s languages in danger. Paris, France: UNESCO. Mrozik, K. (2016). Assessment of retention potential changes as an element of suburbanization monitoring on example of an ungauged catchment in Poznań Metropolitan Area (Poland). Rocznik Ochrona Środowiska [Annual Set the Environment Protection], 18,188-200. Mueller, L., Schindler, U., AxelBehrendt, & Eulenstein, F. (2014). The Muencheberg soil quality rating for assessing the quality of global farmland. In L. Mueller, A. Saparov, & G. Lischeid (Eds.), Novel measurement and assessment tools for monitoring and management of land and water resources in agricultural landscapes of Central Asia (pp. 235-248). Switzerland: Springer. http://doi. org/10.1007/978-3-319-01017-5 Murillas-Maza, A., Virto, J., Gallastegui, M. C., González, P., & FernándezMacho, J. (2011). The value of open
175
THE REGIONAL ASSESSMENT REPORT ON BIODIVERSITY AND ECOSYSTEM SERVICES FOR EUROPE AND CENTRAL ASIA
ocean ecosystems: A case study for the Spanish exclusive economic zone. Natural Resources Forum, 2(2), 122–133. http://doi. org/10.1111/j.1477-8947.2011.01383.x Mustaeva, N., Wyes, H., Mohr, B., & Kayumov, A. (2015). Tajikistan: Country situation assessment - Working paper. MWO. (2012). Mediterranean wetlands outlook 2012. First technical report. Myers, S. S., & Patz, J. A. (2009). Emerging threats to human health from global environmental change. Annual Review of Environment and Resources, 34(1), 223–252. http://doi.org/10.1146/ annurev.environ.033108.102650 Nabhan, G. P. (2001). Cultural perceptions of ecological interactions: An “endangered people’s” contribution to the conservation of biological and linguistic diversity. In L. Maffi (Ed.), On biocultural diversity: Linking language, knowledge and the environment (pp. 145–156). Washington, DC, USA and London, UK: Smithson. Institution Press. Nachtergaele, F., Petri, M., Biancalani, R., van Lynden, G., & van Velthuizen, H. (2010). Global land degradation information system (GLADIS). Beta version. Retrieved from http://www.fao.org/nr/lada/gladis/ glad_ind/ Nakicenovic, N., & Swart, R. (2000). Special report on emission scenarios. Cambridge, UK: Cambridge University Press. Nelson, G. C., Rosegrant, M. W., Koo, J., Robertson, R., Sulser, T., Zhu, T., Ringler, C., Msangi, S., Palazzo, A., Batka, M., Magalhaes, M., ValmonteSantos, R., Ewing, M., & Lee, D. R. (2009). Climate change: Impact on agriculture and costs of adaptation. Washington, DC, USA: International Food Policy Research Institute. http://doi. org/10.2499/0896295354 Nelson, G. C., Rosegrant, M. W., Palazzo, A., Gray, I., Ingersoll, C., Robertson, R., Tokgoz, S., Zhu, T., Sulser, T. B., Ringler, C., Msangi, S., & You, L. (2010). Food security, farming, and climate change to 2050: Scenarios, results, policy options. Research reports IFPRI. http://doi. org/10.2499/9780896291867
176
Netalgae. (2012). Seaweed industry in Europe. Newman, D. J., & Cragg, G. M. (2016). Natural products as sources of new drugs from 1981 to 2014. Journal of Natural Products, 79(3), 629–661. http://doi. org/10.1021/acs.jnatprod.5b01055 Nieto, A., Roberts, S. P. M., Kemp, J., Rasmont, P., Kuhlmann, M., García Criado, M., Biesmeijer, J. C., Bogusch, P., Dathe, H. H., De la Rúa, P., De Meulemeester, T., Dehon, M., Dewulf, A., Ortiz-Sánchez, F. J., Lhomme, P., Pauly, A., Potts, S.G., Praz, C., Quaranta, M., Radchenko, V. G., Scheuchl, E., Smit, J., Straka, J., Terzo, M., Tomozii, B., Window, J., & Michez, D. (2014). European red list of bees. Luxembourg: Publications Office of the European Union. http://doi. org/10.2779/77003 Nurbekov, A., Akramkhanov, A., Kassam, A., Sydyk, D., Ziyadaullaev, Z., & Lamers, J. P. A. (2016). Conservation agriculture for combating land degradation in Central Asia: A synthesis. Aims Agriculture and Food, 1(2), 144–156. http:// doi.org/10.3934/agrfood.2016.2.144 Ode, Å., Fry, G., Tveit, M. S., Messager, P., & Miller, D. (2009). Indicators of perceived naturalness as drivers of landscape preference. Journal of Environmental Management, 90(1), 375–383. http://doi.org/10.1016/j. jenvman.2007.10.013 OECD-FAO. (2016). OECD-FAO agricultural outlook 2016-2025. http://doi.org/10.1787/ agr_outlook-2016-en OECD. (2017). World development indicators. Retrieved December 12, 2017, from http://stats.oecd.org/ Ogada, D. L., Keesing, F., & Virani, M. Z. (2012). Dropping dead: Causes and consequences of vulture population declines worldwide. Annals of the New York Academy of Sciences, 1249(1), 57–71. http://doi.org/10.1111/j.17496632.2011.06293.x Olchev, A., Novenko, E., Desherevskaya, O., Krasnorutskaya, K., & Kurbatova, J. (2009). Effects of climatic changes on carbon dioxide and water
vapor fluxes in boreal forest ecosystems of European part of Russia. Environmental Research Letters, 4(4), 45007. http://doi. org/10.1088/1748-9326/4/4/045007 Olea, P. P., & Mateo-Tomás, P. (2009). The role of traditional farming practices in ecosystem conservation: The case of transhumance and vultures. Biological Conservation, 142(8), 1844–1853. http:// doi.org/10.1016/j.biocon.2009.03.024 Ollerton, J., Winfree, R., & Tarrant, S. (2011). How many flowering plants are pollinated by animals? Oikos, 120(3), 321–326. http://doi.org/10.1111/j.16000706.2010.18644.x Olsson, O., Bolin, A., Smith, H. G., & Lonsdorf, E. V. (2015). Modeling pollinating bee visitation rates in heterogeneous landscapes from foraging theory. Ecological Modelling, 316, 133–143. http://doi. org/10.1016/j.ecolmodel.2015.08.009 Olsson, P., & Folke, C. (2001). Local ecological knowledge and institutional dynamics for ecosystem management: A study of Lake Racken watershed, Sweden. Ecosystems, 4(2), 85–104. http://doi. org/10.1007/s100210000061 Osipova, E., Wilson, L., Blaney, R., Shi, Y., Fancourt, M., Strubel, M., Salvaterra, T., Brown, C., & Verschuuren, B. (2014). The benefits of natural world heritage: identifying and assessing ecosystem services and benefits provided by the world’s most iconic natural places. Gland, Switzerland: IUCN. OSPAR. (2010). Quality Status Report 2010. Ostfeld, R. S., & Keesing, F. (2012). Effects of host diversity on infectious disease. Annual Review of Ecology, Evolution, and Systematics, 43(1), 157–182. http://doi.org/10.1146/annurevecolsys-102710-145022 Otcenášek, J. (2013). Traditional food in the Central Europe: History and changes. Retrieved from https:// books.google.de/books/about/ Traditional_Food_in_the_Central_Europe. html?id=LCXvoAEACAAJ&redir_esc=y Oteros-Rozas, E., González, J. A., Martín-López, B., López, C. A., &
CHAPTER 2. NATURE’S CONTRIBUTIONS TO PEOPLE AND QUALITY OF LIFE
Montes, C. (2012). Ecosystem services and social – ecological resilience in transhumance cultural landscapes: learning from the past, looking for a future. In T. Plieninger & C. Bieling (Eds.), Resilience and the cultural landscape (pp. 242–260). New York, USA: Cambridge University Press. Oteros-Rozas, E., Martín-López, B., Fagerholm, N., Bieling, C., & Plieninger, T. (2017). Using social media photos to explore the relation between cultural ecosystem services and landscape features across five European sites. Ecological Indicators, in press. http://doi. org/10.1016/j.ecolind.2017.02.009 Oteros-Rozas, E., Martin-Lopez, B., Gonzalez, J. A., Plieninger, T., Lopez, C. A., & Montes, C. (2014). Socio-cultural valuation of ecosystem services in a transhumance social-ecological network. Regional Environmental Change, 14(4), 1269–1289. http://doi.org/10.1007/s10113013-0571-y Oteros-Rozas, E., Martín-López, B., López, C. A., Palomo, I., & González, J. A. (2013a). Envisioning the future of transhumant pastoralism through participatory scenario planning: a case study in Spain. The Rangeland Journal, 35(3), 251-272. http://doi.org/10.1071/ RJ12092 Oteros-Rozas, E., Ontillera-Sánchez, R., Sanosa, P., Gómez-Baggethun, E., Reyes-García, V., & González, J. A. (2013b). Traditional ecological knowledge among transhumant pastoralists in Mediterranean Spain. Ecology and Society, 18(3), art33. http://doi.org/10.5751/ES05597-180333 Page, E. A. (2007). Justice between generations: Investigating a sufficientarian approach. Journal of Global Ethics, 3(1), 3–20. http://doi. org/10.1080/17449620600991960 Pak, M., Türker, M. F., & Öztürk, A. (2010). Total economic value of forest resources in Turkey. African Journal of Agricultural Research, 5(15), 1908–1916. http://doi.org/10.5897/AJAR10.018 Panagos, P., Borrelli, P., Meusburger, K., Alewell, C., Lugato, E., & Montanarella, L. (2015a). Estimating the soil erosion cover-management factor
at the European scale. Land Use Policy, 48, 38–50. http://doi.org/10.1016/j. landusepol.2015.05.021 Panagos, P., Borrelli, P., Poesen, J., Ballabio, C., Lugato, E., Meusburger, K., Montanarella, L., & Alewell, C. (2015b). The new assessment of soil loss by water erosion in Europe. Environmental Science & Policy, 54, 438–447. http://doi. org/10.1016/j.envsci.2015.08.012 Panagos, P., Imeson, A., Meusburger, K., Borrelli, P., Poesen, J., & Alewell, C. (2016). Soil conservation in Europe: Wish or reality? Land Degradation and Development, 27(6), 1547–1551. http://doi.org/10.1002/ ldr.2538 Paracchini, M. L., Zulian, G., Kopperoinen, L., Maes, J., Schägner, J. P., Termansen, M., Zandersen, M., Perez-Soba, M., Scholefield, P. A., & Bidoglio, G. (2014). Mapping cultural ecosystem services: A framework to assess the potential for outdoor recreation across the EU. Ecological Indicators, 45, 371–385. http://doi.org/10.1016/j. ecolind.2014.04.018 Pardo-de-Santayana, M., Pieroni, A., & Puri, R. K. (2010). The ethnobotany of Europe, past and present. In M. Pardode-Santayana, A. Pieroni, & R. K. Puri (Eds.), The Ethnobotany in the new Europe: People, health and wild plant resources (pp. 1–15). New York, USA: Berghahn Books. Parrotta, J. A., & Agnoletti, M. (2007). Traditional forest knowledge: Challenges and opportunities. Forest Ecology and Management, 249(1-2), 1-4. http://doi. org/10.1016/j.foreco.2007.05.022 Pascual, U., Balvanera, P., Diaz, S., Pataki, G., Roth, E., Stenseke, M., Watson, R. T., Başak Dessane, E., Islar, M., Kelemen, E., Maris, V., Quaas, M., Subramanian, S. M., Wittmer, H., Adlan, A., Ahn, S. Al-Hafedh, Y. S., Amankwah, E., Asah, S. T., Berry, P., Bilgin, A., Breslow, S. J. Bullock, C., Cáceres, D., Daly-Hassen, H., Figueroa, E., Golden, C. D., Gómez-Baggethun, E., GonzálezJiménez, D., Houdet, J., Keune, H., Kumar, R., Ma, K., May, P. H., Mead, A., O’Farrell, P., Pandit, R., Pengue, W., Pichis-Madruga, R., Popa, F., Preston, S., Pacheco-Balanza, D., Saarikoski, H., Strassburg, B. B., van den Belt,
M., Verma, M., Wickson, F., & Yagi, N. (2017). Valuing nature’s contributions to people: The IPBES approach. Current Opinion in Environmental Sustainability, 26, 7–16. http://doi.org/10.1016/j. cosust.2016.12.006 Pascual, U., Muradian, R., Rodríguez, L. C., & Duraiappah, A. (2010). Exploring the links between equity and efficiency in payments for environmental services: A conceptual approach. Ecological Economics, 69(6), 1237–1244. http://doi. org/10.1016/j.ecolecon.2009.11.004 Pascual, U., Phelps, J., Garmendia, E., Brown, K., Corbera, E., Martin, A., Gomez-Baggethun, E., & Muradian, R. (2014). Social equity matters in payments for ecosystem services. BioScience, 64(11), 1027–1036. http://doi.org/10.1093/biosci/ biu146 Pausas, J. G., Llovet, J., Rodrigo, A., & Vallejo, R. (2008). Are wildfires a disaster in the Mediterranean basin? – A review. International Journal of Wildland Fire, 17(6), 713. http://doi.org/10.1071/WF07151 Pawera, L., Verner, V., Termote, C., Kandakov, A., & Karabaev, N. (2016). Medical ethnobotany of herbal practitioners in the Turkestan Range, southwestern Kyrgyzstan. http://doi.org/10.5586/ asbp.3483 Payyappallimana, U., & Subramanian, S. (2015). Traditional medicine. In WHO & CBD, Connecting global priorities: Biodiversity and human health: A state of knowledge review (pp. 180-199). http://doi. org/10.13140/RG.2.1.3679.6565 Pearce, D. W., & Moran, D. (1994). The Economic Value of Biodiversity. London, UK: Earthscan Publications. Pehlivanov, L., Fikova, R., Ivanova, N., Nevena, R., Kazakov, S., Pavlova, M., & Doncheva, S. (2014). Analysis of ecosystem services of wetlands along the Bulgarian section of the Danube river. Acta Zoologica Bulgarica, 66(Suppl.), 103–107. Pelkonen, P.; Mustonen, M., Asikainen, A., Egnell, G., Kant, P., Leduc, S., & Pettenella, D. (2014). Forest Bioenergy for Europe.
177
THE REGIONAL ASSESSMENT REPORT ON BIODIVERSITY AND ECOSYSTEM SERVICES FOR EUROPE AND CENTRAL ASIA
Pettit, L. R., Smart, C. W., Hart, M. B., Milazzo, M., & Hall-Spencer, J. M. (2015). Seaweed fails to prevent ocean acidification impact on foraminifera along a shallow-water CO2 gradient. Ecology and Evolution, 5(9), 1784–1793. http://doi. org/10.1002/ece3.1475 Pieroni, A., Rexhepi, B., Nedelcheva, A., Hajdari, A., Mustafa, B., Kolosova, V., Cianfaglione, K., & Quave, C. L. (2013). One century later: the folk botanical knowledge of the last remaining Albanians of the upper Reka Valley, Mount Korab, western Macedonia. Journal of Ethnobiology and Ethnomedicine, 9, 22. http://doi. org/10.1186/1746-4269-9-22 Pietilä, M., & Fagerholm, N. (2016). Visitors’ place-based evaluations of unacceptable tourism impacts in Oulanka National Park, Finland. Tourism Geographies, 18(3), 258–279. http://doi.org /10.1080/14616688.2016.1169313 Pilgrim, S. E., Cullen, L. C., Smith, D. J., & Pretty, J. (2008). Ecological knowledge is lost in wealthier communities and countries. Environmental Science & Technology, 42(4), 1004–1009. Piper, R. (2017). Drugs from bugs: The next blockbuster medicine could be lurking inside an insect. Retrieved from www. theconversation.com Plieninger, T., Draux, H., Fagerholm, N., Bieling, C., Bürgi, M., Kizos, T., Kuemmerle, T., Primdahl, J., & Verburg, P. H. (2016). The driving forces of landscape change in Europe: A systematic review of the evidence. Land Use Policy, 57, 204–214. http://doi.org/10.1016/j. landusepol.2016.04.040 Plieninger, T., Hartel, T., MartínLópez, B., Beaufoy, G., Bergmeier, E., Kirby, K., Montero, M. J., Moreno, G., Oteros-Rozas, E., & Van Uytvanck, J. (2015). Wood-pastures of Europe: Geographic coverage, social-ecological values, conservation management, and policy implications. Biological Conservation, 190, 70–79. http://doi.org/10.1016/j. biocon.2015.05.014 Pollock, L. J., Thuiller, W., & Jetz, W. (2017). Large conservation gains possible for global biodiversity facets.
178
Nature, 546(7656), 141–144. http://doi. org/10.1038/nature22368
Applications, 17, 2377–2386. http://doi. org/10.1890/06-0750.1
Popkin, B. M., Adair, L. S., & Ng, S. W. (2011). Global nutrition transition and the pandemic of obesity in developing countries. Nutrition Reviews, 70(1), 3–21. http://doi. org/10.1111/j.1753-4887.2011.00456.x
Rakhmatullaev, S., Huneau, F., Le Coustumer, P., Motelica-Heino, M., & Bakiev, M. (2010). Facts and perspectives of water reservoirs in Central Asia: A special focus on Uzbekistan. Water, 2(2), 307–320. http://doi.org/10.3390/w2020307
Popova, E. E., Yool, A., Coward, A. C., Dupont, F., Deal, C., Elliott, S., Hunke, E., Jin. M., Steele. M., & Zhang, J. (2012). What controls primary production in the Arctic Ocean? Results from an intercomparison of five general circulation models with biogeochemistry. Journal of Geophysical Research: Oceans, 117(C8). http://doi.org/10.1029/2011JC007112 Popp, J., Lakner, Z., Harangi-Rákos, M., & Fári, M. (2014). The effect of bioenergy expansion: Food, energy, and environment. Renewable and Sustainable Energy Reviews, 32, 559-578. http://doi. org/10.1016/j.rser.2014.01.056 Pullin, A., Frampton, G., & Jongman, R. (2016). Selecting appropriate methods of knowledge synthesis to inform biodiversity policy. Biodiversity and Conservation, 25(7), 1285–1300. http://doi.org/10.1007/s10531016-1131-9 Qi, J., Bobushev, T., Kulmatov, R., Groisman, P., & Gutman, G. (2012). Addressing global change challenges for Central Asian socio-ecosystems. Frontiers of Earth Science, 6(2), 115- 121. http://doi. org/10.1007/s11707-012-0320-4 Quave, C. L., Pardo-De-Santayana, M., & Pieroni, A. (2012). Medical ethnobotany in Europe: From field ethnography to a more culturally sensitive evidence-based cam? Evidence-Based Complementary and Alternative Medicine, 2012, 156846. http:// doi.org/10.1155/2012/156846 Queenan, K. (2017). Roadmap to a one health agenda 2030. CAB Reviews: Perspectives in Agriculture, Veterinary Science, Nutrition and Natural Resources, 12(14). http://doi.org/10.1079/ PAVSNNR201712014 Quetier, F., Lavorel, S. Thuiller, W. and Davies, I. (2007). Plant-trait-based modeling assessment of ecosystem-service sensitivity to land-use change. Ecological
Rall, E., Bieling, C., Zytynska, S., & Haase, D. (2017). Exploring city-wide patterns of cultural ecosystem service perceptions and use. Ecological Indicators, 77, 80–95. http://doi.org/10.1016/j. ecolind.2017.02.001 Randolph, S. E., & Dobson, A. D. M. (2012). Pangloss revisited: a critique of the dilution effect and the biodiversitybuffers-disease paradigm. Parasitology, 139(7), 847–863. http://doi.org/10.1017/ S0031182012000200 Read, P., & Fernandes, T. (2003). Management of environmental impacts of marine aquaculture in Europe. Aquaculture, 226(1–4), 139–163. http://doi.org/10.1016/ S0044-8486(03)00474-5 Reed, D. W. (2002). Reinforcing flood-risk estimation. Philosophical Transactions of the Royal Society A, 360, 1373–1387. http:// doi.org/10.1098/rsta.2002.1005 Remme, R. P., Schröter, M., & Hein, L. (2014). Developing spatial biophysical accounting for multiple ecosystem services. Ecosystem Services, 10, 6–18. http://doi. org/10.1016/j.ecoser.2014.07.006 Ressurreição, A., Gibbons, J., Kaiser, M., Dentinho, T. P., Zarzycki, T., Bentley, C., Austen, M., Burdon, D., Atkins, J., Santos, R. S., & EdwardsJones, G. (2012). Different cultures, different values: The role of cultural variation in public’s WTP for marine species conservation. Biological Conservation, 145(1), 148–159. http://doi.org/10.1016/j. biocon.2011.10.026 Reyers, B., Polasky, S., Tallis, H., Mooney, H. A., & Larigauderie, A. (2012). Finding common ground for biodiversity and ecosystem services. Bioscience, 62(5), 503–507. http://doi.org/10.1525/ bio.2012.62.5.12
CHAPTER 2. NATURE’S CONTRIBUTIONS TO PEOPLE AND QUALITY OF LIFE
Reyes-García, V., Menendez-Baceta, G., Aceituno-Mata, L., Acosta-Naranjo, R., Calvet-Mir, L., Domínguez, P., Garnatje, T., Gomez-Baggethun, E., Molina-Bustamante, M., Molina, M., Rodriguez-Franco, R., Serrasolses, G., Valls, J., & Pardo-de-Santayana, M. (2015). From famine foods to delicatessen: Interpreting trends in the use of wild edible plants through cultural ecosystem services. Ecological Economics, 120, 303–311. http://doi.org/10.1016/j. ecolecon.2015.11.003 Reyes-García, V., Vila, S., AceitunoMata, L., Calvet-Mir, L., Garnatje, T., Jesch, A., Lastra, J. J., Parada, M., Rigat, M., Valles, J., & Pardode-Santayana, M. (2010). Gendered homegardens: A study in three mountain areas of the Iberian Peninsula. Economic Botany, 64, 235–247. http://doi. org/10.1007/s12231-010-9124-1 Ricketts, T. H., & Lonsdorf, E. (2013). Mapping the margin: Comparing marginal values of tropical forest remnants for pollination services. Ecological Applications, 23(5), 1113–1123. http://doi. org/10.1890/12-1600.1 Rigg, R., Finďo, S., Wechselberger, M., Gorman, M. L., Sillero-Zubiri, C., & Macdonald, D. W. (2011). Mitigating carnivore–livestock conflict in Europe: Lessons from Slovakia. Oryx, 45(2), 272–280. http://doi.org/10.1017/ S0030605310000074 Roberge, J. M., Laudon, H., Björkman, C., Ranius, T., Sandström, C., Felton, A., Sténs, A., Nordin, A., Granström, A., Widemo, F., Bergh, J., Sonesson, J., Stenlid, J., & Lundmark, T. (2016). Socioecological implications of modifying rotation lengths in forestry. Ambio, 45, 109–123. http://doi.org/10.1007/s13280-015-0747-4 Roberti di Sarsina, P. (2007). The social demand for a medicine focused on the person: The contribution of CAM to healthcare and healthgenesis. EvidenceBased Complementary and Alternative Medicine, 4(Suppl.), 45–51. http://doi. org/10.1093/ecam/nem094 Rockström, J., Steffen, W., Noone, K., Persson, A., Chapin, F. S., Lambin, E. F., Lenton, T. M., Scheffer, M., Folke, C., Schellnhuber, H. J., Nykvist, B., de
Wit, C. A., Hughes, T., van der Leeuw, S., Rodhe, H., Sörlin, S., Snyder, P. K., Costanza, R., Svedin, U., Falkenmark, M., Karlberg, L., Corell, R. W., Fabry, V. J., Hansen, J., Walker, B., Liverman, D., Richardson, K., Crutzen, P., & Foley, J. A. (2009). A safe operating space for humanity. Nature, 461(7263), 472–475. http://doi.org/10.1038/461472a Roleda, M. Y., Cornwall, C. E., Feng, Y., McGraw, C. M., Smith, A. M., & Hurd, C. L. (2015). Effect of ocean acidification and pH fluctuations on the growth and development of coralline algal recruits, and an associated benthic algal assemblage. PLoS ONE, 10(10), e0140394. Romagosa, F., Eagles, P. F. J., & Lemieux, C. J. (2015). From the inside out to the outside in: Exploring the role of parks and protected areas as providers of human health and well-being. Journal of Outdoor Recreation and Tourism, 10, 70–77. http:// doi.org/10.1016/j.jort.2015.06.009 Rook, G. A. W., & Knight, R. (2015). Environmental microbial diversity and noncommunicable diseases. In WHO & CBD, Connecting global priorities: Biodiversity and human health: A state of knowledge review (pp. 150-163). http://doi. org/10.13140/RG.2.1.3679.6565 Roques, A., Rabitsch, W., Rasplus, J.-Y., Lopez-Vaamonde, C., Nentwig, W., & Kenis, M. (2009). Alien terrestrial invertebrates of Europe. In DAISIE, Handbook of alien species in Europe (pp. 63–79). Dordrecht, The Netherlands: Springer. http://doi.org/10.1007/978-14020-8280-1_5 Rotherham, I. D. (2007). The implications of perceptions and cultural knowledge loss for the management of wooded landscapes: A UK case-study. Forest Ecology and Management, 249(1–2), 100–115. http:// doi.org/10.1016/j.foreco.2007.05.030 Roué, M., & Molnár, Z. (Eds.). (2016). Knowing our lands and resources: Indigenous and local knowledge of biodiversity and ecosystem services in Europe and Central Asia. Paris, France: UNESCO. Ruiz-Frau, A., Edwards-Jones, G., & Kaiser, M. J. (2011). Mapping stakeholder values for coastal zone management.
Marine Ecology Progress Series, 434, 239– 249. http://doi.org/10.3354/meps09136 Rulli, M. C., Bellomi, D., Cazzoli, A., De Carolis, G., & D’Odorico, P. (2016). The water-land-food nexus of first-generation biofuels. Scientific Reports, 6, 22521. http:// doi.org/10.1038/srep22521 Rulli, M. C., Saviori, A., & D’Odorico, P. (2013). Global land and water grabbing. Proceedings of the National Academy of Sciences of the United States of America, 110(3), 892–897. http://doi.org/10.1073/ pnas.1213163110 Ruokolainen, L., Paalanen, L., Karkman, A., Laatikainen, T., von Hertzen, L., Vlasoff, T., Markelova, O., Masyuk, V., Auvinen, P., Paulin, L., Alenius, H., Fyhrquist, N., Hanski, I., Mäkelä, M. J., Zilber, E., Jousilahti, P., Vartiainen, E., & Haahtela, T. (2017). Significant disparities in allergy prevalence and microbiota between the young people in Finnish and Russian Karelia. Clinical and Experimental Allergy, 47(5), 665–674. http://doi. org/10.1111/cea.12895 Ruskule, A., Nikodemus, O., Kasparinskis, R., Bell, S., & Urtane, I. (2013). The perception of abandoned farmland by local people and experts: Landscape value and perspectives on future land use. Landscape and Urban Planning, 115, 49–61. http://doi.org/10.1016/j. landurbplan.2013.03.012 Ruyts, S. C., Ampoorter, E., Coipan, E. C., Baeten, L., Heylen, D., Sprong, H., Matthysen, E., & Verheyen, K. (2016). Diversifying forest communities may change Lyme disease risk: Extra dimension to the dilution effect in Europe. Parasitology, 143(10), 1310–1319. http:// doi.org/10.1017/S0031182016000688 Rzadkowski, S., & Kalinowski, M. (2013). Harvesting of non-wood forest products in Poland and their resources an overview. In Harvesting of non-wood forest products (pp. 133–138). Sæbø, A., Popek, R., Nawrot, B., Hanslin, H. M., Gawronska, H., & Gawronski, S. W. (2012). Plant species differences in particulate matter accumulation on leaf surfaces. Science of the Total Environment, 427–428,
179
THE REGIONAL ASSESSMENT REPORT ON BIODIVERSITY AND ECOSYSTEM SERVICES FOR EUROPE AND CENTRAL ASIA
347–354. http://doi.org/10.1016/j. scitotenv.2012.03.084 SAEPF, UNEP, & UNDP. (2012). The national report on the state of the environment of the Kyrgyz Republic for 2006-2011. Sahlén, V., Friebe, A., Sæbø, S., Swenson, J. E., & Støen, O. G. (2015). Den entry behavior in Scandinavian brown bears: Implications for preventing human injuries. Journal of Wildlife Management, 79(2), 274–287. http://doi.org/10.1002/ jwmg.822 Sánchez-Mata, M. D., & Tardío, J. (2016). Mediterranean wild edible plants: Ethnobotany and food composition. New York, USA: Springer. Sánchez-Zapata, J. A., Clavero, M., Carrete, M., DeVault, T. L., Hermoso, V., Losada, M. A., Polo, M. J., SánchezNavarro, S., Pérez-García, J. M., Botella, F., Ibáñez, C., & Donázar, J. A. (2016). Effects of renewable energy production and infrastructure on wildlife. In R. Mateo, B. Arroyo, & J. T. García (Eds.), Current trends in wildlife research (pp. 97–123). Cham, Switzerland: Springer International Publishing. Sanderson, F. J., Donald, P. F., Pain, D. J., Burfield, I. J., & van Bommel, F. P. J. (2006). Long-term population declines in Afro-Palearctic migrant birds. Biological Conservation, 131(1), 93–105. http://doi. org/10.1016/j.biocon.2006.02.008 Santos-Martín, F., Martín-López, B., García-Llorente, M., Aguado, M., Benayas, J., & Montes, C. (2013). Unraveling the relationships between ecosystems and human wellbeing in Spain. PLoS ONE, 8(9), e73249. http://doi. org/10.1371/journal.pone.0073249 Schierhorn, F., Müller, D., Beringer, T., Prishchepov, A. V., Kuemmerle, T., & Balmann, A. (2013). Post-Soviet cropland abandonment and carbon sequestration in European Russia, Ukraine, and Belarus. Global Biogeochemical Cycles, 27(4), 1175–1185. http://doi. org/10.1002/2013GB004654 Schirpke, U., Hölzler, S., Leitinger, G., Bacher, M., Tappeiner, U., & Tasser, E. (2013). Can we model the scenic beauty
180
of an alpine landscape? Sustainability (Switzerland), 5(3), 1080–1094. http://doi. org/10.3390/su5031080 Schlegel, J., Breuer, G., & Rupf, R. (2015). Local insects as flagship species to promote nature conservation? A survey among primary school children on their attitudes toward invertebrates. Anthrozoos, 28(2), 229–245. http://doi.org/10.2752/089 279315x14219211661732 Schley, L., Dufrêne, M., Krier, A., & Frantz, A. C. (2008). Patterns of crop damage by wild boar (Sus scrofa) in Luxembourg over a 10-year period. European Journal of Wildlife Research, 54(4), 589–599. http://doi.org/10.1007/ s10344-008-0183-x Schmalz, B., Kruse, M., Kiesel, J., Müller, F., & Fohrer, N. (2016). Waterrelated ecosystem services in western Siberian lowland basins - Analysing and mapping spatial and seasonal effects on regulating services based on ecohydrological modelling results. Ecological Indicators, 71, 55–65. http://doi. org/10.1016/j.ecolind.2016.06.050 Schmitz, C., Biewald, A., LotzeCampen, H., Popp, A., Dietrich, J. P., Bodirsky, B., Krause, M., & Weindl, I. (2012). Trading more food: Implications for land use, greenhouse gas emissions, and the food system. Global Environmental Change, 22(1), 189–209. http://doi. org/10.1016/j.gloenvcha.2011.09.013 Schokkaert, E., & Devooght, K. (2003). Responsibility-sensitive fair compensation in different cultures. Social Choice and Welfare, 21(2), 207–242. http://doi. org/10.1007/s00355-003-0257-3 Schröter, M., Stumpf, K. H., Loos, J., van Oudenhoven, A. P. E., BöhnkeHenrichs, A., & Abson, D. J. (2017). Refocusing ecosystem services towards sustainability. Ecosystem Services, 25, 35–43. http://doi.org/10.1016/j. ecoser.2017.03.019 Schulp, C. J. E., Lautenbach, S., & Verburg, P. H. (2014a). Quantifying and mapping ecosystem services: Demand and supply of pollination in the European Union. Ecological Indicators, 36, 131–141. http:// doi.org/10.1016/j.ecolind.2013.07.014
Schulp, C. J. E., Thuiller, W., & Verburg, P. H. (2014b). Wild food in Europe: A synthesis of knowledge and data of terrestrial wild food as an ecosystem service. Ecological Economics, 105, 292–305. http://doi.org/10.1016/j. ecolecon.2014.06.018 Schulp, C. J. E., Van Teeffelen, A. J. A., Tucker, G., & Verburg, P. H. (2016). A quantitative assessment of policy options for no net loss of biodiversity and ecosystem services in the European Union. Land Use Policy, 57, 151–163. http://doi. org/10.1016/j.landusepol.2016.05.018 Schulze, E. D., Ciais, P., Luyssaert, S., Schrumpf, M., Janssens, I. A., Thiruchittampalam, B., Theloke, J., Saurat, M., Bringezu, S., Lelieveld, J., Lohila, A., Rebmann, C., Jung, M., Bastviken, D., Abril, G., Grassi, G., Leip, A., Freibauer, A., Kutsch, W., Don, A., Nieschulze, J., Börner, A., Gash, J. H., & Dolman, A. J. (2010). The European carbon balance. Part 4: Integration of carbon and other trace-gas fluxes. Global Change Biology, 16(5), 1451-1469. http:// doi.org/10.1111/j.1365-2486.2010.02215.x Schulze, E. D., Luyssaert, S., Ciais, P., Freibauer, A., Janssens, I. A., Soussana, J. F., Smith, P., Grace, J., Levin, I., Thiruchittampalam, B., Heimann, M., Dolman, A. J., Valentini, R., Bousquet, P., Peylin, P., Peters, W., Rödenbeck, C., Etiope, G., Vuichard, N., Wattenbach, M., Nabuurs, G. J., Poussi, Z., Nieschulze, J., Gash, J. H., & the CarboEurope team. (2009). Importance of methane and nitrous oxide for Europe’s terrestrial greenhouse-gas balance. Nature Geoscience, 2(12), 842–850. http://doi. org/10.1038/ngeo686 Sebastián-González, E., Moleón, M., Gibert, J. P., Botella, F., Mateo-Tomás, P., Olea, P. P., Guimarães Jr, P. R., & Sánchez-Zapata, J. (2015). Nested species-rich networks of scavenging vertebrates support high levels of interspecific competition. Ecology, 97(1), 95–105. http://doi.org/10.1890/15-0212.1 Seeland, K., & Staniszewski, P. (2007). Indicators for a European cross-country state-of-the-art assessment of non-timber forest products and services. SmallScale Forestry, 6(4), 411–422. http://doi. org/10.1007/s11842-007-9029-8
CHAPTER 2. NATURE’S CONTRIBUTIONS TO PEOPLE AND QUALITY OF LIFE
Seidl, A. (2014). Cultural ecosystem services and economic development: World heritage and early efforts at tourism in Albania. Ecosystem Services, 10, 164–171. http://doi.org/10.1016/j.ecoser.2014.08.006 Sekercioglu, C. H., Daily, G. C., & Ehrlich, P. R. (2004). Ecosystem consequences of bird declines. Proceedings of the National Academy of Sciences of the United States of America, 101(52), 18042–18047. http://doi.org/10.1073/ pnas.0408049101 Setälä, H., Viippola, V., Rantalainen, A.-L., Pennanen, A., & Yli-Pelkonen, V. (2013). Does urban vegetation mitigate air pollution in northern conditions? Environmental Pollution, 183, 104–112. http://doi.org/10.1016/j.envpol.2012.11.010 Sevenant, M., & Antrop, M. (2009). Cognitive attributes and aesthetic preferences in assessment and differentiation of landscapes. Journal of Environmental Management, 90(9), 2889–2899. http://doi.org/10.1016/j. jenvman.2007.10.016 Shahgedanova, M., Burt, T. P., & Davies, T. D. (1997). Some aspects of the three dimensional heat island in Moscow. International Journal of Climatology, 17, 1451–1465. http://doi.org/10.1002/(SICI)10970088(19971115)17:133.0.CO;2-Z Shanin, V. N., Komarov, A. S., Mikhailov, A. V., & Bykhovets, S. S. (2011). Modelling carbon and nitrogen dynamics in forest ecosystems of central Russia under different climate change scenarios and forest management regimes. Ecological Modelling, 222(14), 2262–2275. http://doi. org/10.1016/j.ecolmodel.2010.11.009 Skoulikidis, N. T., Sabater, S., Datry, T., Morais, M. M., Buffagni, A., Dorflinger, G., Zogaris, S., Sanchez-Montoya, M. D., Bonada, N., Kalogianni, E., Rosado, J., Vardakas, L., De Girolamo, A. M., & Tockner, K. (2017). Non-perennial Mediterranean rivers in Europe: Status, pressures, and challenges for research and management. Science of the Total Environment, 577, 1–18. http://doi. org/10.1016/j.scitotenv.2016.10.147
Smale, D. A., Burrows, M. T., Moore, P., O’Connor, N., & Hawkins, S. J. (2013). Threats and knowledge gaps for ecosystem services provided by kelp forests: A northeast Atlantic perspective. Ecology and Evolution, 3(11), 4016–4038. http://doi. org/10.1002/ece3.774 Šmid Hribar, M., Bole, D., & Urbanc, M. (2015). Javno in skupno dobro v kulturni pokrajini [Public and common good in cultural landscapes]. Geografski Vestnik [Geographic News], 87(2), 43–57. http://doi. org/10.3986/GV87203 Šmid Hribar, M., & Urbanc, M. (2016). The nexus between landscape elements and traditional practices for cultural landscape management. In M. Agnoletti & F. Emanueli (Eds.), Biocultural diversity in Europe (pp. 523–537). Switzerland: Springer. http://doi.org/10.1007/978-3-31926315-1_28 Smrekar, A., Šmid Hribar, M., & Erhartic, B. (2016). Stakeholder conflicts in the Tivoli, Rožnik hill, and Šiška hill protected landscape area. Acta Geographica Slovenica, 56(2), 305–319. http://doi.org/10.3986/AGS.895 Solín, Ľ., Feranec, J., & Nováček, J. (2011). Land cover changes in small catchments in Slovakia during 1990-2006 and their effects on frequency of flood events. Natural Hazards, 56(1), 195–214. http://doi.org/10.1007/s11069-010-9562-1 Sommer, R., & de Pauw, E. (2011). Organic carbon in soils of Central Asia Status quo and potentials for sequestration. Plant and Soil, 338(1), 273–288. http://doi. org/10.1007/s11104-010-0479-y Sorg, A., Bolch, T., Stoffel, M., Solomina, O., & Beniston, M. (2012). Climate change impacts on glaciers and runoff in Tien Shan (Central Asia). Nature Climate Change, 2(10), 725–731. http://doi. org/10.1038/nclimate1592 Sorokin, A., Bryzzhev, A., Strokov, A., Mirzabaev, A., Johnson, T., & Kiselev, S. V. (2016). The economics of land degradation in Russia. In E. Nkonya, A. Mirzabaev, & J. von Braun (Eds.), Economics of land degradation and improvement – A global assessment for sustainable development (pp. 541–576).
Switzerland: Springer. http://doi. org/10.1007/978-3-319-19168-3 Sorrenti, S. (2017). Non-wood forest products in international statistical systems. Spanish NEA. (2013). Spanish National Ecosystem Assessment: Ecosystems and biodiversity for human wellbeing. Madrid, Spain: Biodiversity Foundation of the Ministry of Environment. Stahl, K., Hisdal, H., Hannaford, J., Tallaksen, L. M., van Lanen, H. A. J., Sauquet, E., Demuth, S., Fendekova, M., & Jódar, J. (2010). Streamflow trends in Europe: evidence from a dataset of near-natural catchments. Hydrology and Earth System Sciences, 14(12), 2367–2382. http://doi.org/10.5194/hess-14-2367-2010 Stahl, K., Tallaksen, L. M., Hannaford, J., & van Lanen, H. A. J. (2012). Filling the white space on maps of European runoff trends: estimates from a multi-model ensemble. Hydrology and Earth System Sciences, 16(7), 2035–2047. http://doi. org/10.5194/hess-16-2035-2012 Ståhlberg, S., & Svanberg, I. (2011). Catching basking ide, Leuciscus idus (L.), in the Baltic Sea. Journal of Northern Studies, 5(2), 87–104. Steffen, W., Richardson, K., Rockstrom, J., Cornell, S. E., Fetzer, I., Bennett, E. M., Biggs, R., Carpenter, S. R., de Vries, W., de Wit, C. A., Folke, C., Gerten, D., Heinke, J., Mace, G. M., Persson, L. M., Ramanathan, V., Reyers, B., & Sorlin, S. (2015). Planetary boundaries: Guiding human development on a changing planet. Science, 347(6223), 1259855. http://doi. org/10.1126/science.1259855 Steinbrecher, R., Smiatek, G., Köble, R., Seufert, G., Theloke, J., Hauff, K., Ciccioli, P., Vautard, R., & Curci, G. (2009). Intra- and inter-annual variability of VOC emissions from natural and semi-natural vegetation in Europe and neighbouring countries. Atmospheric Environment, 43(7), 1380–1391. http://doi. org/10.1016/j.atmosenv.2008.09.072 Sténs, A., Bjärstig, T., Nordström, E. M., Sandström, C., Fries, C., & Johansson, J. (2016). In the eye of the stakeholder: The challenges of governing
181
THE REGIONAL ASSESSMENT REPORT ON BIODIVERSITY AND ECOSYSTEM SERVICES FOR EUROPE AND CENTRAL ASIA
social forest values. Ambio, 45, 87–99. http://doi.org/10.1007/s13280-015-0745-6 Stoffel, M., & Huggel, C. (2012). Effects of climate change on mass movements in mountain environments. Progress in Physical Geography, 36(3), 421–439. http:// doi.org/10.1177/0309133312441010 Stolbovoi V., M. I. (2002). Land Resources of Russia (CD-ROM). Laxenburg, Austria: International Institute for Applied Systems Analysis and the Russian Academy of Science.
and adaptation responses will reshape agriculture in Eastern Europe and Central Asia. Washington, DC, USA: World Bank. Sychev, V. G., Yefremov, E. N., & Romanenkov, V. A. (2016). Monitoring of soil fertility (agroecological monitoring). In L. Mueller, A. K. Sheudshen, & F. Eulenstein (Eds.), Novel methods for monitoring and managing land and water resources in Siberia (pp. 541–561). Switzerland: Springer. http://doi.org/10.1007/978-3-319-244099_24
Stolte, J., Tesfai, M., Keizer, J., Øygarden, L., Kværnø, S., Verheijen, F., Panagos, P., Ballabio, C., & Hessel, R. (2015). Soil threats in Europe. Luxembourg: Publications Office of the European Union. http://doi.org/10.2788/828742
Tallis, M., Taylor, G., Sinnett, D., & Freer-Smith, P. (2011). Estimating the removal of atmospheric particulate pollution by the urban tree canopy of London, under current and future environments. Landscape and Urban Planning, 103(2), 129–138. http://doi.org/10.1016/j. landurbplan.2011.07.003
Stone, D., Ritz, K., Griffiths, B. G., Orgiazzi, A., & Creamer, R. E. (2016). Selection of biological indicators appropriate for European soil monitoring. Applied Soil Ecology, 97, 12–22. http://doi. org/10.1016/j.apsoil.2015.08.005
TEEB. (2010). The economics of ecosystems and biodiversity: Ecological and economic foundations. London, UK: Earthscan.
Støttrup, J. G., Stenberg, C., Dahl, K., Kristensen, L. D., & Richardson, K. (2014). Restoration of a temperate reef: Effects on the fish community. Open Journal of Ecology, 4, 1045–1059. Stoyneva-Gärtner M. P., S., & Uzunov, B.A. (2015). An ethno biological glance on globalization impact on the traditional use of algae and fungi as food in Bulgaria. Journal of Nutrition & Food Sciences, 5(5). http:// doi.org/10.4172/2155-9600.1000413 Sturck, J., Poortinga, A., & Verburg, P. H. (2014). Mapping ecosystem services: The supply and demand of flood regulation services in Europe. Ecological Indicators, 38, 198–211. http://doi.org/10.1016/j. ecolind.2013.11.010 Surová, D., Pinto-Correia, T., & Marušák, R. (2013). Visual complexity and the montado do matter: landscape pattern preferences of user groups in Alentejo, Portugal. Annals of Forest Science, 71(1), 15–24. http://doi.org/10.1007/s13595-0130330-8 Sutton, W.R., Srivastava, J.P. and Neumann, J. E. (2013). Looking beyond the horizon: How climate change impacts
182
Telesca, L., Belluscio, A., Criscoli, A., Ardizzone, G., Apostolaki, E. T., Fraschetti, S., Gristina, M., Knittweis, L., Martin, C. S., Pergent, G., Alagna, A., Badalamenti, F., Garofalo, G., Gerakaris, V., Louise Pace, M., Pergent-Martini, C., & Salomidi, M. (2015). Seagrass meadows (Posidonia oceanica) distribution and trajectories of change. Scientific Reports. 5, 12505. http://doi.org/10.1038/srep12505
landscapes: Accounting for structure, management intensity and value of agricultural and forest landscapes. Land Use Policy, 62, 29-39. http://doi.org/10.1016/j. landusepol.2016.12.001 Tilman, D., Socolow, R., Foley, J. a, Hill, J., Larson, E., Lynd, L., Pacala, S., Reilly, J., Searchiner, T., Somerville, C., & Williams, R. (2009). Beneficial biofuels— The food, energy, and environment trilemma. Science, 325(5938), 270–271. http://doi.org/10.1126/science.1177970 TNC. (n.d.). The atlas of global conservation. Retrieved January 1, 2017, from http://maps.tnc.org/globalmaps.html TNI. (2016). Land grabbing and land concentration in Europe. A Research Brief. Retrieved from https://www. tni.org/files/publication-downloads/ landgrabbingeurope_a5-2.pdf Toivonen, A. L., Roth, E., Navrud, S., Gudbergsson, G., Appelblad, H., Bengtsson, B., & Tuunainen, P. (2004). The economic value of recreational fisheries in Nordic countries. Fisheries Management and Ecology, 11(1), 1–14. http://doi. org/10.1046/j.1365-2400.2003.00376.x Torralba, M., Fagerholm, N., Burgess, P. J., Moreno, G., & Plieninger, T. (2016). Do European agroforestry systems enhance biodiversity and ecosystem services? A meta-analysis. Agriculture, Ecosystems and Environment, 230, 150–161. http://doi. org/10.1016/j.agee.2016.06.002
ten Brink, P., Mutafoglu, K., Schweitzer, J., Kettunen, M., Kuipers, Y., Emonts, M., Tyrväinen, L., Hujala, T., & Ojala, A. (2016). The health and social benefits of nature and biodiversity protection. A report for the European Commission (ENV.B.3/ ETU/2014/0039). http://doi.org/10.13140/ RG.2.1.4312.2807
Tóth, G., Gardi, C., Bódis, K., Ivits, É., Aksoy, E., Jones, A., Jeffrey, S., Petursdottir, T., & Montanarella, L. (2013). Continental-scale assessment of provisioning soil functions in Europe. Ecological Processes, 2, 32. http://doi. org/10.1186/2192-1709-2-32
Tengberg, A., Fredholm, S., Eliasson, I., Knez, I., Saltzman, K., & Wetterberg, O. (2012). Cultural ecosystem services provided by landscapes: Assessment of heritage values and identity. Ecosystem Services, 2, 14–26. http://doi.org/10.1016/j. ecoser.2012.07.006
Tribot, A., Mouquet, N., Villéger, S., Raymond, M., Hoff, F., Boissery, P., Holon, F., & Deter, J. (2016). Taxonomic and functional diversity increase the aesthetic value of coralligenous reefs. Scientific Reports, 6, 34229. http://doi. org/10.1038/srep34229
Tieskens, K., Schulp, C. J. E., Levers, C., Kuemmerle, T., Lieskovský, J., Plieninger, T., & Verburg, P. H. (2017). Characterizing European cultural
Turtiainen, M., & Nuutinen, T. (2012). Evaluation of information on wild berry and mushroom markets in European countries.
CHAPTER 2. NATURE’S CONTRIBUTIONS TO PEOPLE AND QUALITY OF LIFE
Small-Scale Forestry, 11(1), 131–145. http://doi.org/10.1007/s11842-011-9173-z Tveit, M., Ode, Å., & Fry, G. (2006). Key concepts in a framework for analysing visual landscape character. Landscape Research, 31(3), 229–255. Uca, S. (2007). Türk Toplumunda Hıdrellez [Hidrellez in Turkish society]. Atatürk Üniversitesi Türkiyat Araştırmaları Enstitüsü Dergisi [Ataturk University Journal of Turkic Studies], 34, 113–138. UK NEA. (2011). The UK National Ecosystem Assessment: Technical report. Cambridge, UK: UNEP-WCMC. Ulbrich, K., Schweiger, O., Klotz, S., & Settele, J. (2015). Biodiversity impacts of climate change - the PRONAS software as educational tool. Web Ecology, 15, 49–58. http://doi.org/10.5194/we-15-49-2015 UN-Water. (2011). Water quality. Policy Brief. UN-Water. (2013). Water security and the global water agenda. Analytical Brief. http://www.unwater.org/publications/watersecurity-global-water-agenda/ UNEP. (1999). Cultural and spiritual values of biodiversity. UNEP. (2004). Exploring the links: Human well-being, poverty, and ecosystem services. Mountain Research and Development (Vol. 22). UNEP-WCMC, & IUCN. (2016). Protected planet report 2016. UNEP & UNECE. (2016). GEO-6 Assessment for the pan-European region. Nairobi, Kenya: United Nations Environment Programme. UNESCO. (n.d.). UNESCO Atlas of the world’s languages in danger. Retrieved November 1, 2015, from http://www. unesco.org/languages-atlas/ UNESCO. (2003). Convention for the safeguarding of intangible cultural heritage. Retrieved from https://ich.unesco.org/en/ convention UNFCCC. (2014). National greenhouse gas inventory data for the period 1990–
2013. Note by the secretariat. Retrieved from http://unfccc.int/documentation/ documents/advanced_search/items/6911. php?priref=600008730 UNICEF. (2014). Children of the recession. The impact of the economic crisis on the child well-being in rich countries. Innocenti report card 12. Children in the developed world. US Energy Information Administration. (2017). International Energy Statistics Biofuels. Valin, H., Peters, D., Van den Berg, M., Frank, S., Havlik, P., Forsell, N., & Hamelinck, C. (2015). The land use change impact of biofuels consumed in the EU quantification of area and greenhouse gas impacts. Van den Berg, A. E., & Koole, S. L. (2006). New wilderness in the Netherlands: An investigation of visual preferences for nature development landscapes. Landscape and Urban Planning, 78(4), 362–372. http:// doi.org/10.1016/j.landurbplan.2005.11.006 Van Den Berg, M., Wendel-Vos, W., Van Poppel, M., Kemper, H., Van Mechelen, W., & Maas, J. (2015). Health benefits of green spaces in the living environment: A systematic review of epidemiological studies. Urban Forestry & Urban Greening, 14(4), 806–816. http://doi.org/10.1016/j. ufug.2015.07.008 van der Ploeg, J. D., Franco, J. C., & Borras, S. M. (2015). Land concentration and land grabbing in Europe: A preliminary analysis. Canadian Journal of Development Studies / Revue Canadienne D’études Du Développement, 36(2), 147–162. http://doi. org/10.1080/02255189.2015.1027673 van Oudenhoven, F., & Haider, J. (2015). With our own hands: A celebration of food and life in the Pamir Mountains of Afghanistan and Tajikistan. Utrecht, The Netherlands: LM Publishers. Van Swaay, C., Cuttelod, A., Collins, S., Maes, D., Munguira, M. L., Šašić, M., Settele, J., Verovnik, R., Verstrael, T., Warren, M., Wiemers, M., & Wynhoff, I. (2010). European red list of butterflies. Luxembourg: Publications Office of the European Union. http://doi. org/10.2779/83897
Van Wijnen, H. J., Rutgers, M., Schouten, A. J., Mulder, C., de Zwart, D., & Breure, A. M. (2012). How to calculate the spatial distribution of ecosystem services - Natural attenuation as example from The Netherlands. Science of the Total Environment, 415, 49–55. http:// doi.org/10.1016/j.scitotenv.2011.05.058 Van Zanten, B. T., Van Berkel, D. B., Meentemeyer, R. K., Smith, J. W., Tieskens, T. F., & Verburg, P. H. (2016). Continental scale quantification of landscape values using social media data. Proceedings of the National Academy of Sciences of the United States of America, 113(46), 12974-12979. http://doi.org/10.1073/ pnas.1614158113 Van Zanten, B. T., Verburg, P. H., Koetse, M. J., & Van Beukering, P. J. H. (2014). Preferences for European agrarian landscapes: A meta-analysis of case studies. Landscape and Urban Planning, 132, 89–101. http://doi.org/10.1016/j. landurbplan.2014.08.012 Varga, A., & Molnár, Z. (2014). The role of traditional ecological knowledge in managing wood-pastures. In T. Hartel & T. Plieninger (Eds.), European wood-pastures in transition: A social–ecological approach. (pp. 185–202.). Abingdon, UK and New York, USA: Earthscan. Verkerk, P. J., Mavsar, R., Giergiczny, M., Lindner, M., Edwards, D., & Schelhaas, M. J. (2014). Assessing impacts of intensified biomass production and biodiversity protection on ecosystem services provided by European forests. Ecosystem Services, 9, 155–165. http://doi. org/10.1016/j.ecoser.2014.06.004 Verschuuren, B. (2006). An overview of cultural and spiritual values in ecosystem management and conservation strategies. Verschuuren, B., Wild, R., Mcneely, J., & Oviedo, G. (2010). Sacred natural sites: Conserving nature and culture. B. Verschuuren, R. Wild, J. Mcneely, & G. Oviedo (Eds.). Abingdon, UK: Earthscan. Vesterinen, J., Pouta, E., Huhtala, A., & Neuvonen, M. (2010). Impacts of changes in water quality on recreation behavior and benefits in Finland. Journal of Environmental Management, 91(4), 984–994. http://doi. org/10.1016/j.jenvman.2009.12.005
183
THE REGIONAL ASSESSMENT REPORT ON BIODIVERSITY AND ECOSYSTEM SERVICES FOR EUROPE AND CENTRAL ASIA
Vidal-Abarca Gutiérrez, M. R., & Suárez Alonso, M. L. (2013). Which are, what is their status and what can we expect from ecosystem services provided by Spanish rivers and riparian areas? Biodiversity and Conservation, 22(11), 2469–2503. http:// doi.org/10.1007/s10531-013-0532-2 Vuichard, N., Ciais, P., Belelli, L., Smith, P., & Valentini, R. (2008). Carbon sequestration due to the abandonment of agriculture in the former USSR since 1990. Global Biogeochemical Cycles, 22(4). http:// doi.org/10.1029/2008GB003212 Walker, W. S., & Uysal, A. (1973). An ancient god in modern Turkey: Some aspects of the cult of Hizir. The Journal of American Folklore, 86(341), 286–289. Walker, G., & Burningham, K. (2011). Flood risk, vulnerability and environmental justice: Evidence and evaluation of inequality in a UK context. Critical Social Policy, 31(2), 216–240. http://doi. org/10.1177/0261018310396149 Watson, R. A., Green, B. S., Tracey, S. R., Farmery, A., & Pitcher, T. J. (2015a). Provenance of global seafood. Fish and Fisheries, 17, 585-595. http://doi. org/10.1111/faf.12129 Watson, R., Nowara, G. B., Hartmann, K., Green, B. S., Tracey, S. R., & Carter, C. G. (2015b). Marine foods sourced from farther as their use of global ocean primary production increases. Nature Communications, 6, 7365. http://doi. org/10.1038/ncomms8365 Waycott, M., Duarte, C. M., Carruthers, T. J. B., Orth, R. J., Dennison, W. C., Olyarnik, S., Calladine, A., Fourqurean, J. W., Heck, K. L., Hughes, A. R., Kendrick, G. A., Kenworthy, W. J., Short, F. T., & Williams, S. L. (2009). Accelerating loss of seagrasses across the globe threatens coastal ecosystems. Proceedings of the National Academy of Sciences of the United States of America, 106(30), 12377–81. http://doi.org/10.1073/ pnas.0905620106 Wetlands International. (2015). A pilot wintering waterbird indicator for the European Union. White, P. C. L., Bennett, A. C., & Hayes, E. J. V. (2001). The use of willingness-to-
184
pay approaches in mammal conservation. Mammal Review, 31(2), 151–167. http://doi. org/10.1046/j.1365-2907.2001.00083.x WHO. (2008a). Diabetes country profiles. Retrieved February 8, 2017, from: http:// www.who.int/diabetes/country-profiles/en/ WHO. (2008b). Global health observatory data. Retrieved February 8, 2017, from: http://www.who.int/gho/countries/en/ WHO. (2017). Culture matters: Using a cultural contexts of health approach to enhance policy-making. http://doi. org/10.13140/RG.2.2.17532.74881 WHO & CBD. (2015). Connecting global priorities: Biodiversity and human health: A state of knowledge review. http://doi. org/10.13140/RG.2.1.3679.6565
Wittman, H., Desmarais, A. A, & Wiebe, N. (2010). The origins & potential of food sovereignty. In A.A. Desmarais, N. Wiebe, & H. Wittman (Eds.), Food Sovereignty: Reconnecting Food, Nature and Community (pp. 1-14). Oakland, USA: Food First Books. Wood, C. L., & Lafferty, K. D. (2013). Biodiversity and disease: A synthesis of ecological perspectives on Lyme disease transmission. Trends in Ecology and Evolution, 28(4), 239–247. http://doi. org/10.1016/j.tree.2012.10.011 Wood, C. L., Lafferty, K. D., DeLeo, G., Young, H. S., Hudson, P. J., & Kuris, A. M. (2017). Does biodiversity protect humans against infectious disease? Ecology, 95(4), 817-832. http://doi.org/10.1890/131041.1
Wiggs, G. F. S., O’hara, S. L., Wegerdt, J., Van Der Meer, J., Small, I., & Hubbard, R. (2003). The dynamics and characteristics of aeolian dust in dryland Central Asia: Possible impacts on human exposure and respiratory health in the Aral Sea basin. The Geographical Journal, 169(2), 142–157. https://doi. org/10.1111/1475-4959.04976
World Bank. (2017). World Development Indicators. Retrieved July 27, 2017, from http://databank.worldbank.org/data/reports. aspx?source=world-development-indicators
Wilbon, P. A., Chu, F., & Tang, C. (2013). Progress in renewable polymers from natural terpens, terpenoids and rosin. Macromolecular Rapid Communications, 34(1), 8–37. https://doi.org/10.1002/ marc.201200513
Xirouchakis, S. M. (2010). Breeding biology and reproductive performance of griffon vultures Gyps fulvus on the island of Crete (Greece). Bird Study, 57(2), 213–225. http://doi. org/10.1080/00063650903505754
Wild, R., & McLeod, C. (Eds.). (2008). Sacred natural sites: Guidelines for protected area managers. Gland, Switzerland: IUCN.
Yu, Y., Feng, K., & Hubacek, K. (2013). Tele-connecting local consumption to global land use. Global Environmental Change, 23(5), 1178–1186. http://doi.org/10.1016/j. gloenvcha.2013.04.006
Willis, K. J. (Ed.). (2017). State of the world’s plants 2017. Kew, UK: Kew Royal Botanic Gardens. Wilson, D. E., Mittermeier, R. A., & Cavallini, P. (Eds.). (2009). Handbook of the mammals of the world. Barcelona, Spain: Lynx Edicions. Wilson, E. E., & Wolkovich, E. M. (2011). Scavenging: How carnivores and carrion structure communities. Trends in Ecology and Evolution, 26(3), 129–135. http://doi. org/10.1016/j.tree.2010.12.011
World Bank. (2016). Percentage of population with access to improved drinking water sources. Retrieved from https://data. worldbank.org/indicator/SH.H2O.SAFE.ZS
Zabel, F., Putzenlechner, B., & Mauser, W. (2014). Global agricultural land resources - A high resolution suitability evaluation and its perspectives until 2100 under climate change conditions. PloS ONE, 9(9), e107522. https://doi.org/10.1371/ journal.pone.0107522 Zaehle, S., Ciais, P., Friend, A. D., & Prieur, V. (2011). Carbon benefits of anthropogenic reactive nitrogen offset by nitrous oxide emissions. Nature Geoscience, 4(9), 601–605. http://doi.org/10.1038/ ngeo1207
CHAPTER 2. NATURE’S CONTRIBUTIONS TO PEOPLE AND QUALITY OF LIFE
Zafra-Calvo, N., Pascual, U., Brockington, D., Coolsaet, B., CortesVazquez, J. A., Gross-Camp, N., Plamo, I., & Burgess, N. D. (2017). Towards an indicator system to assess equitable management in protected areas. Biological Conservation, 211, 134–141. http://doi. org/10.1016/j.biocon.2017.05.014 Zedler, J. B. (2017). What’s new in adaptive management and restoration of coasts and estuaries? Estuaries and Coasts, 40(1), 1–21. http://doi.org/10.1007/s12237016-0162-5 Zedler, J. B., & Kercher, S. (2005). Wetland resources: Status, trends,
ecosystem services, and restorability. Annual Review of Environment and Resources, 30(1), 39–74. http://doi.org/10.1146/ annurev.energy.30.050504.144248 Zimmerman, R. C., Hill, V. J., Jinuntuya, M., Celebi, B., Ruble, D., Smith, M., Cedeno, T., & Swingle, W. M. (2017). Experimental impacts of climate warming and ocean carbonation on eelgrass Zostera marina. Marine Ecology Progress Series, 566, 1–15. http://doi.org/10.3354/ meps12051
in Athens. Environmental Monitoring and Assessment, 156(1), 275–292. http://doi. org/10.1007/s10661-008-0483-3 Zumbrunnen, T., Menendez, P., Bugmann, H., Conedera, M., Gimmi, U., & Bürgi, M. (2012). Human impacts on fire occurrence: A case study of hundred years of forest fires in a dry alpine valley in Switzerland. Regional Environmental Change, 12, 935–949. http://doi. org/10.1007/s10113-012-0307-4
Zoulia, I., & Santamouris, M., & Dimoudi, A. (2008). Monitoring the effect of urban green areas on the heat island
185