Portions of this paper were written while Blau and Kahn were Visiting Scholars ... Baker and Benjamin (1997) posits a family investment model in which, upon ...
NBER WORKING PAPER SERIES
THE ROLE OF THE FAMILY IN IMMIGRANTS’ LABOR-MARKET ACTIVITY: EVIDENCE FROM THE UNITED STATES
Francine D. Blau Lawrence M. Kahn Joan Y. Moriarty Andre Portela Souza
Working Paper 9051 http://www.nber.org/papers/w9051
NATIONAL BUREAU OF ECONOMIC RESEARCH 1050 Massachusetts Avenue Cambridge, MA 02138 July 2002
Draft. Comments welcome. Portions of this paper were written while Blau and Kahn were Visiting Scholars at the Russell Sage Foundation, to which they are grateful for research support.The views expressed herein are those of the authors and not necessarily those of the National Bureau of Economic Research.
© 2002 by Francine D. Blau, Lawrence M. Kahn, Joan Y. Moriarty and Andre Portela Souza. All rights reserved. Short sections of text, not to exceed two paragraphs, may be quoted without explicit permission provided that full credit, including © notice, is given to the source.
The Role of the Family in Immigrants’ Labor-Market Activity: Evidence from the United States Francine D. Blau, Lawrence M. Kahn, Joan Y. Moriarty and Andre Portela Souza NBER Working Paper No. 9051 July 2002 JEL No. J1, J2, J3
ABSTRACT We use Census of Population microdata for 1980 and 1990 to examine the labor supply and wages of immigrant husbands and wives in the United States in a family context. Earlier research by Baker and Benjamin (1997) posits a family investment model in which, upon arrival, immigrant husbands invest in their human capital while immigrant wives work to provide the family with liquidity during this period. Consistent with this model, they find for Canada that immigrant wives work longer hours upon arrival than comparable natives, but, with time in Canada, they are eventually overtaken by native wives. In contrast, we find that, among immigrants to the United States, both husbands and wives work and earn less than comparable natives upon arrival, with similar shortfalls for men and women. Further, both immigrant husbands and wives have similar, positive assimilation profiles in wages and labor supply and eventually overtake both the wages and the labor supply of comparable natives.
Francine D. Blau School of Industrial and Labor Relations Cornell University 265 Ives Hall Ithaca, NY 14853-3901 NBER and CESifo
Lawrence M. Kahn School of Industrial and Labor Relations Cornell University 264 Ives Hall Ithaca, NY 14853-3901 and CESifo
Joan Y. Moriarty School of Industrial and Labor Relations Cornell University ILR Graduate Student Mailboxes Ives Hall Ithaca, NY 14853-3901
Andre Portela Souza University of Sao Paulo Faculdade de Economia, Administracao e Contabilidade Av. Professor Luciano Gualberto, 908 Cidade Universitaria, Predio FEA 1 Sao Paulo, SP 05508-900 Brazil
I. Introduction Most research on the labor market outcomes of immigrants has studied the behavior of individuals, focusing primarily on the wage assimilation process, or the excess returns to experience which immigrants obtain in their destination country's labor market (e.g., Barry R. Chiswick, 1978; George J. Borjas, 1985). Recently, however, attention has been directed to analyzing immigrant labor market outcomes in a family context, an approach which combines information about an individual’s own labor market opportunities and the family context in which labor market decisions take place. In a recent paper in this Review, Michael Baker and Dwayne Benjamin (1997) evaluate alternative explanations for the observed labor supply patterns of Canadian immigrants in the 1986-91 period. Specifically, when immigrant husbands arrive in Canada, they typically work less than comparable natives; however, immigrant wives work more than natives, other things equal. With assimilation, the labor supply of immigrant husbands eventually catches up to that of natives, while immigrant wives’ labor supply falls relative to comparable natives and is ultimately overtaken by that of natives. The authors take these patterns to be most consistent with a family investment model. In this scenario, upon arrival, husbands invest in their human capital, while wives work to provide the family with liquidity during this investment period. With increased time in Canada, husbands’ labor supply increases rapidly due to their growing skills in the Canadian labor market, while wives’ labor supply falls off in part because they originally took “dead-end” jobs upon arrival in order to finance their husbands’ investments in human capital. Interestingly, although this fact goes uncommented upon, their estimated wage equations do not support their model—they find similar rates of wage assimilation for husbands and wives. This does not match their story of dead-end jobs for wives and large human capital investments of their husbands. An alternative possible explanation examined by the authors involves a simple price model in which the observed labor supply patterns reflect labor supply responses to each spouse’s wages. For example, the initially high but eventually falling level of wives’ labor
supply (relative to comparable natives) could be a response to their husbands’ initially low, but rising, wages. While this reasoning, like the family investment model, is broadly consistent with the data, the authors conclude that the simple price model cannot be the entire explanation since, in order to explain the full labor supply patterns of immigrants, it would require unrealistically high labor supply elasticities, and, further, that the assimilation patterns noted above remain even when wages of husband and wife are controlled for. The authors then go on to present a variety of evidence that is consistent with wives in immigrant families in Canada financing their husbands’ human capital investments early in their stay in Canada. In this paper, we use microdata from the U.S. Census of Population for 1980 and 1990 to examine whether these patterns characterize the experience of immigrants in the United States. While Baker and Benjamin cite studies by Harriet Orcutt Duleep and Seth Sanders (1993) and David A. McPherson and James B. Stewart (1989) for the United States that obtain results which they characterize as consistent with their Canadian findings, these studies are based on a single cross-section of data. As Borjas (1985) showed, if the unmeasured characteristics of cohorts of immigrants are changing over time, as appears to be the case in the U.S., such studies may produce biased estimates of immigrant assimilation effects. This problem may be mitigated by employing more than one nationally representative cross-section as we do here and as Baker and Benjamin did in their analysis of Canada.1 In contrast to the patterns which Baker and Benjamin (1997) found for Canada, we find that, among immigrants to the United States, both husbands and wives work less than comparable natives upon arrival. Further, both immigrant husbands and wives have positive assimilation profiles in labor supply and eventually overtake the labor supply of comparable natives. Both the male and female immigrant hours shortfalls upon arrival and the positive assimilation profiles for men and women have similar magnitudes. It thus appears that in the United States the labor supply patterns of immigrant husbands and wives similarly reflect 1
There may however be biases in this "synthetic cohort" approach as well. The chief concern is an alteration in the unmeasured composition of the group over the intervening period due say to the return migration of immigrants, or in our case movements into and out of the currently married category. We return to this point below. 2
assimilation into the new country’s market. Our results suggest that investment is indeed important, but that, in sharp contrast to the family investment model, both spouses seem to invest primarily in their own human capital rather than their spouse’s. In this respect our findings are consistent with a long line of research on the growth in married women's labor supply in the United States which suggests that married women’s labor supply decisions are more responsive to their own labor market opportunities than to their husband’s income (e.g., Jacob Mincer 1962; Claudia Goldin 1990; and Chinhui Juhn and Kevin M. Murphy 1997). Finally, our paper has significance for the Economics of Gender. In the Baker and Benjamin (1997) model, married women are clearly “secondary earners” in the immigrant family. Our results for the U.S. suggest more similar economic behavior of men and women within the immigrant family in that they are both investing in their own human capital. Our results imply that the extent to which the family investment model applies to immigrants may vary depending on such factors as the composition of the immigrant group and conditions in the receiving country. While Baker and Benjamin (1997) have obtained some evidence suggesting that the model may hold in Canada, we have found that the model does not explain immigrant behavior in the United States. Similar studies of other countries need to be done in order to determine whether Canada or the United States is an exceptional case. However, our results do imply that the family investment model is inadequate for at least one major immigrant-receiving country, the United States.
II. The Labor Supply and Wage Assimilation Patterns of Married Immigrants in the United States A. Basic Results We examine the labor market assimilation patterns of married U.S. immigrants using a pooled sample of married couples from the 5% Public Use Samples of the 1980 and 1990 Censuses. These include native couples, immigrant couples, and “mixed couples” (i.e., those 3
with one immigrant and one native spouse). The Census is particularly suitable for analyzing immigrant outcomes because of its large sample size (while immigration has been increasing rapidly, immigrants remained a relatively small proportion of population in 1980 and 1990) and its information on race and ethnicity, as well as on the source countries of immigrants. In order to focus on differences between outcomes in the United States and Canada, we follow the specifications and sample restrictions in Baker and Benjamin’s (1997) Canadian study as closely as possible.2 The entire 5% sample is used for couples including immigrants, nonwhites, and Hispanics, but a random sample was employed for couples where both spouses were native whites.3 In all the analyses reported below, observations are weighted to represent the U.S. population. Our weighting also takes into account Census sampling weights which are available for 1990 but not provided by the Census for 1980. Results were very similar when we ran unweighted regressions. To analyze labor supply, we estimate the following equation on the pooled sample of married immigrants and married natives separately for wives and husbands:
(1)
Hit = B′Xit + ΣcγWc + ΣcγHc + a1YSMWit + a2(YSMWit)2 + b1YSMHit + b2(YSMHit)2 + kt + uit,
where for individual i in year t (t=1980 or 1990), H is annual hours worked in the previous year (usual weekly hours * weeks worked, including those who did not work outside the home), γWc and γHc are immigrant cohort-of-arrival effects referring to cohort c for wives and husbands, respectively, YSMW and YSMH are years since migration for immigrant wives and immigrant 2
Following Baker and Benjamin, we restrict the sample to those couples in which both members are aged 16-64 and exclude the self-employed and individuals with positive wage and salary income but implausible values of wages (in our case, less than $1 or greater than $250 in 1989 dollars using the Personal Consumption Expenditures deflator). Also, as is standard in research examining immigrant outcomes in the United States or using U.S. Census data to study wages, we exclude natives born abroad, at sea or in U.S. territories, individuals who are in the military, and those with allocated wage and salary income. Note that this is a sample of married couples. Thus, if one member of the couple did not meet the sample inclusion restrictions, both were excluded. 3 This sample corresponded to 2/1000 of the U.S. population. 4
husbands, respectively, but equal 0 for natives, k is a common year effect, X is a vector of control variables to be discussed shortly, and u is an error term. In equation (1), immigrants and natives are pooled. We define the cohort of arrival dummy variables (whose coefficients are the γs) to include each possible arrival cohort as coded in the Census: 1985-89, 1980-84, 1975-79, 1970-74, 1965-69, 1960-64, 1950-59, and pre-1950. Thus the sum of the wife (husband) cohort dummies in the wife (husband) labor supply equation would be identical to an immigrant dummy variable, which therefore is not separately included in (1). The equation allows each spouse’s arrival cohort (if either spouse is an immigrant) to affect the labor supply behavior of both spouses. In addition, the years since migration (YSMW and YSMH) variables allow us to estimate assimilation profiles with respect to the individual's own time in the U.S. as well as his or her spouse’s time, if either spouse is an immigrant.4 The pooled sample across two Census years and the assumption of a common time effect for immigrants and natives together allow us to separately identify immigrant cohort and assimilation effects (Borjas, 1985).5 The combination of the cohort dummies and the assimilation effects allows us to completely characterize immigrant labor supply over time starting with arrival in the U.S. of any arrival cohort relative to that of natives, controlling for the X variables and the time effect. The X variables include quadratics in age for both the husband and wife, years of schooling for both husband and wife, English language ability indicators (speaking English “well,” “not well” or “not at all”, with native English speakers as the omitted category) for both husband and wife, number of children, a dummy variable for the presence of children less than six years old, three race/ethnicity dummy variables for husband and wife (black, other nonwhite, and Hispanic, with white non-Hispanic the omitted category), a metropolitan area dummy variable, and regional 4
Following Borjas (1995), we calculated the years since migration variables by evaluating the categorical period of immigration variables at the midpoints of the indicated intervals and used 40 years in 1980 and 50 years in 1990 for the open-ended category (before 1950). 5 Of course, the common time effect may not hold to the extent that immigrants have different skill levels from natives. In our context, this factor could produce problems comparing the U.S. and Canada to the extent that immigrants’ relative skill levels differ in the two countries. This point is pursued further below. 5
dummy variables to account for the nine Census regions. Other than the control for race/ethnicity, the specification is very similar to that of Baker and Benjamin (1997), and omitting these variables from our equations did not affect the basic results.6 Log-wage equations had a similar form to (1) except that, following Baker and Benjamin (1997), no spouse cohort or assimilation variables were included. These were omitted by the authors in order to focus on individuals’ own determinants of wage growth, while the labor supply equations emphasize family considerations.7 Wages were defined as the previous year’s wage and salary income divided by (weeks worked * usual weekly work hours) and were expressed in 1989 dollars. Table 1a contains basic regression results for work hours and wages from reduced form models. Overall, in contrast to Baker and Benjamin’s (1997) Canadian results, we obtain similar wage and labor supply assimilation patterns for immigrant husbands and wives in the U.S. Consider first the results for the labor supply equation for wives. We find that the coefficients on the years since migration (YSM) and cohort variables are similarly signed to the results obtained for Canada by Baker and Benjamin; however, there are some crucial differences in their magnitudes. As in the case of Canada, the annual hours of immigrant women increase with wife’s own time in the U.S. (through 30.3 years)8 and decrease with her husband's. However, while the coefficient on wife’s own YSM is similar in magnitude to the coefficient estimated for Canada, the effect for her husband’s YSM is small and insignificant. Similarly, while the impact of a woman's own cohort variables are all negative and of her husband's positive (with one exception), estimated husband's cohort effects are considerably smaller in magnitude in the U.S. than in Canada. Signs are also similar for the YSM and cohort variables of immigrant husbands in the U.S. and Canada. Both own and wives’ cohort effects are negative; and immigrant 6
Baker and Benjamin (1997) were unable to include controls for race and ethnicity in their analysis because this information was not available in their data, the 1986 and 1991 Canadian Survey of Consumer Finances. 7 While we recognize that the family investment model implies that spouse’s time in the U.S. affects one’s own human capital, we use Baker and Benjamin’s (1997) specification for comparability. Note that, following Baker and Benjamin, we include spouse’s time in the U.S. and cohort variables when we examine results for immigrant and mixed families separately below. Inclusion of these variables does not alter our findings. 8 Mean YSM of immigrant wives is 16.344. 6
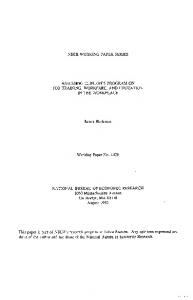
husbands are found to increase their hours worked with both their own YSM (through 33.0 years) and their wives’ YSM (through 30.4 years).9 As in the case of Canada, own effects are larger than cross effects, although cross effects are found to be a bit larger in the U.S. than in Canada. The net effects of the estimated YSM and cohort effects on the hours assimilation profiles of immigrant wives and husbands are illustrated in Table 1b for immigrant couples where both the wife and the husband arrived between 1975 and 1979. Results are qualitatively similar for other cohorts. Relative to natives with similar characteristics, we find that immigrant wives supply 212.7 fewer hours upon arrival (i.e. –264.592 + 51.897); and immigrant husbands 389.7 fewer hours. The assimilation effects for men and women both imply rising annual hours worked relative to comparable natives with time in the U.S., with immigrant wives overtaking native-born wives after 10-15 years, and immigrant husbands surpass native-born husbands after about 15 years. The hours assimilation profile is concave for both groups. The U.S.-Canada comparison is clarified in Figure 1 which shows the hours assimilation profiles summarized in Table 1b for the U.S. and analogous results for Canada derived from Baker and Benjamin (1997). We focus on hypothetical immigrant married couples that migrated at roughly the same time, where the base immigration entry cohort is assumed to be 1975-79 for the U.S. and 1976-80 for Canada. The Figure shows that our results for immigrant husbands are similar to those obtained for Canada by Baker and Benjamin; however, our results differ sharply for immigrant wives. Their results imply that, in Canada, immigrant wives work more than comparable natives upon arrival but that hours converge smoothly until reaching parity after 30 years. In contrast, as noted, immigrant wives in the U.S. initially have lower hours but eventually surpass hours of comparable natives. Note also the qualitatively similar profiles for immigrant husbands and wives in the U.S. To assess the magnitudes of the assimilation and cohort entry effects for immigrant husbands and wives in the United States, recall that the dependent variable is annual hours 9
Mean YSM of immigrant husbands is 16.902. 7
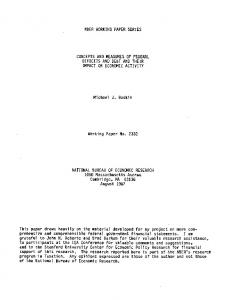
worked.10 In our pooled sample, the weighted means for annual hours (including those not employed) averaged 1038.3 for wives and 1961.0 for husbands.11 If we convert the parameter values into elasticities evaluated at these means using the results in Table 1b for the 1975-79 cohort, we find that the labor supply behavior of immigrant husbands and wives relative to comparable natives is very similar, both at arrival and over time in the U.S. At arrival, wives work 20.5% less than the average, all else equal, while husbands work 19.9% less. Over the next 25 years, immigrant wives increase their labor supply relative to comparable natives by 28.1% of the sample average, while immigrant husbands raise theirs by 26.4%. The results in Table 1a indicate that, in the U.S., wage assimilation profiles are also similar for immigrant husbands and wives. Evaluating these results for the 1975/79 cohort in Table 1c shows that both groups start 12-15% below comparable natives. But, after 25 years, immigrant wives have moved up 18.9%, while immigrant husbands’ wages have increased 19.4% relative to comparable natives. Like the hours profiles (at least considered as elasticities), the log wage profiles for husbands and wives display similar concavity. Interestingly, Figure 2 shows that our wage results are similar to those of Baker and Benjamin (1997) in that they also find similar wage assimilation profiles for immigrant husbands and wives. This suggests that some investment activity by both husbands and wives in their own human capital occurs in both countries. Moreover, the similarity of the wage assimilation profiles for husbands and wives in Canada (and our own findings for the U.S.) does not suggest that women are taking dead-end jobs to finance their husbands’ human capital investments. And, although wages increase considerably more rapidly with time in the receiving country for immigrant husbands in Canada than in the U.S., the same is true for immigrant wives.12 This suggests that the steeper slope of 10
We use hours instead of log hours because we retain those with zero hours (i.e., the non-employed) in the analysis. 11 Annual work hours were 7-12% higher among natives than immigrants. For example, annual work hours averaged 934.4 hours for wives and 1844.8 hours for husbands among immigrants; and 1048.1 for wives and 1971.14 for husbands among natives. Because the means for immigrants and natives are fairly close, we would obtain similar qualitative conclusions about elasticities using immigrant, native or pooled means. 12 Evaluated at the mean YSM in the U.S. of 16.623, the return to an additional year in the receiving country is .0063 for wives and .0070 for husbands in the U.S., and .0140 for wives and .0124 for husbands in Canada. 8
immigrant husbands’ wage profiles in Canada compared to the U.S. is not necessarily due to the financing of their human capital investments by their wives.13 In Table 2, we present structural labor supply equations where we include own and spouse’s wages or estimated wage offers, as well as the couple’s asset income, to see whether responses to these variables can account for the assimilation patterns which we observe in Tables 1a and b. Following Baker and Benjamin (1997) and Juhn and Murphy (1997), we impute wage offers to those without jobs by predicting log wages from a regression on a sample of those who worked less than 20 weeks in the previous year (estimated separately by gender).14 Table 2 shows ordinary least squares (OLS) and two stage least squares (2SLS) results, where in the latter, following Baker and Benjamin, own and spouse’s wage offers are instrumented using the gender-specific decile in which one’s wage offer (actual or predicted in the case of non-workers) falls. This instrumental variable procedure can potentially correct for measurement error in the wage variables, since error is likely to be much less frequent in measuring wage decile than actual wages.15 13
It is possible that the assumption of a common time effect for immigrants and natives has a larger negative effect on immigrants’ wage assimilation profiles in the U.S. than in Canada. Specifically, according to Borjas (1993), immigrants are less skilled relative to natives in the U.S. than in Canada. Further, it appears that the fortunes of the less-skilled generally declined by more in the U.S. than in Canada in the 1980s (Richard B. Freeman and Karen Needels, 1993). Then if, as is necessary to account for immigrant cohort effects, we assume a common time effect, this may cause us to understate true immigrant assimilation profiles by more in the U.S. than in Canada. That is, the more negative immigrant time effect in the U.S. becomes a less steeply sloped assimilation profile in a model that forces a common time effect (this is similar to the argument made by Robert J. LaLonde and Robert H. Topel (1992) in assessing male immigrant wage assimilation in the U.S. in the 1980s). While a similar point may apply to the hours analyses as well, these relative biases cannot explain the divergent profiles for Canadian and U.S. immigrant wives shown in Figure 1. If anything, true U.S. immigrant women’s employment assimilation profiles are even more positively sloped relative to those in Canada than Figure 1 indicates. 14 This regression included the respondent’s age, age squared, own and spouse’s education, a metropolitan area indicator, regional dummies, a year effect, race/ethnicity, and own cohort dummies for immigrants. This specification is similar to Baker and Benjamin’s, except for our inclusion of cohort dummies for immigrants (made possible by our larger sample size) and the addition of race. Due to an insufficient number of immigrants in the sample of individuals working less than 20 weeks, Baker and Benjamin obtain cohort effects from wage regressions using the sample of all working individuals. As noted above, Baker and Benjamin omit race/ethnicity from their analyses because it was not available in their data; recall that omitting race/ethnicity did not affect our results. 15 While it is true that measurement error in wage deciles is less frequent than in actual levels, the consequences of making an error in denoting one’s decile are likely to be greater than the consequences of a small measurement error in actual wage levels. For example, wrongly classifying a 9th decile worker as an 8th decile earner implies an error as large in log points as the difference between log wages in the 9th vs. the 8th deciles. Thus, the wage decile instrument may not adequately correct for measurement error in actual wages. Note that whatever the merit of this instrument, the OLS and 2SLS results in Table 2 are very similar. 9
The key findings in Table 2 are that, even controlling for wages, there are comparable positive hours assimilation profiles for immigrant husbands and wives. And, among immigrant couples in the same cohort, both husbands and wives are estimated to start out below comparable natives in work hours, controlling for wages, family asset income, period and the control variables. In contrast, using a similar specification, Baker and Benjamin continue to find that, among families that immigrated together, wives start out working more than comparable natives, but have negative assimilation profiles. They take their results to imply that simple labor supply models cannot account for their data. Our results similarly suggest that a simple labor supply model cannot account for our findings, but in the case of the U.S. it appears that the primary pattern is for both immigrant wives and husbands to invest in their own human capital. We note however that one interpretation of our results, as well as those of Baker and Benjamin, is that time in the U.S. provides additional information about labor market opportunities, even controlling for wages.16 A final point meriting comment in results presented in Tables 1a and 2 is the estimated positive effect of wife’s YSM on husband’s labor supply in all the models estimated. As noted above, Baker and Benjamin obtain the same result but in their case there is a ready interpretation for this finding. Wives are found to scale back their labor supply with time in Canada and hence it makes sense that husband's labor supply is increasing in wife's YSM. How can we explain our result in the face of rising wife’s labor supply and wages with own YSM? It is possible that this positive coefficient is the result of greater information that the wife brings to her partner with additional time in the U.S., thus furthering his assimilation process. However, if that is the case, 16
Note that, in addition to the YSM variables, a number of the control variables, including husband’s and wife’s education and presence of children, may capture some of the effects of wages on labor supply. For the wives’ results in Table 2, the coefficient on wife’s own log wage (WW) is smaller in absolute value than the coefficient on husband’s log wage (WH) in both the OLS and 2SLS regressions. This is counter to expectations based on the labor supply literature cited above in which wives were found to be more responsive to their own wage opportunities than to their husband’s income. However, when we estimated more conventional models we found the expected results. For example, when the models in Table 2 were reestimated continuing to include the YSM and immigrant cohort variables but omitting own and husband’s education and presence of children, the estimated coefficients and standard errors were 338.969 (2.303) for WW and –236.5 (2.149) for WH in the OLS specification and 504.777 (3.402) for WW and –334.854 (3.563) for WH in the 2SLS specification. 10
we would expect to find a similar positive effect of husband’s YSM on wife’s labor supply. The fact that we find no evidence of this might be taken as indirect evidence in support of the family investment model. That is, it may be that the positive information effect of husband’s YSM on wife's hours is offset by the wife’s reduction in her labor supply as her husband accumulates human capital and no longer needs her contribution to family liquidity. However, if wives undertake such a role to some extent in the U.S., our evidence strongly suggests that the dominant pattern for immigrant husbands and wives is a simple process of human capital accumulation: both husbands and wives start with low wages and low hours but both have positive assimilation profiles, and the magnitudes of these effects are similar for husbands and wives. Further evidence on the family investment model is provided in Tables 3 and 4 which show results for the labor supply and wages separately for wives and husbands in immigrant families (i.e. where both spouses are immigrants) and mixed families (i.e. where only one spouse is an immigrant).17 This analysis follows that of Baker and Benjamin who reasoned that a mixed family would be less liquidity constrained than an immigrant family. They found that immigrant wives in mixed families behaved much less according to the family investment model than those in immigrant families. Specifically, immigrant wives in mixed families worked less than comparable natives upon arrival in Canada but had a positive assimilation profile, while immigrant wives in immigrant families generally worked more than comparable natives upon arrival, but had negative assimilation profiles. In contrast to Baker and Benjamin, the results for the U.S. shown in Table 3 indicate that immigrant wives in both types of family work significantly less than comparable natives upon arrival and both have significantly positively sloped hours assimilation profiles. The hours shortfall at arrival relative to natives is generally smaller in mixed than in immigrant families, and the hours assimilation profile is more steeply sloped for wives in immigrant than in mixed 17
These results are estimated in regression equations specified as in (1), which include separate assimilation and cohort variables for immigrant husbands and wives in immigrant and mixed families. 11
families. These two contrasts could reflect a lower initial level of human capital and labor market knowledge among immigrant wives in immigrant than in mixed families. This interpretation is bolstered by the wage results in Table 3. Specifically, while immigrant wives in both types of families start below comparable natives, the effects are much smaller in absolute value in mixed families, and the wage assimilation profile is much flatter in mixed families as well. The findings in Table 3 are not consistent with the idea that immigrant wives in immigrant families behave more according to the family investment model than those in mixed families. Table 4 shows that the same patterns characterize immigrant husbands as immigrant wives in mixed versus immigrant families. For both husbands and wives, being married to a native is generally associated with a higher initial level of hours and wages and less steeply sloped assimilation profiles than being married to an immigrant. Indeed, perhaps surprisingly, we show no evidence of wage assimilation for immigrant husbands in mixed families—we return to this point below. Table 5 shows results for some direct measures of husband’s human capital investment and wife’s role in financing this investment. First, the table shows that, upon arrival, immigrant husbands in immigrant families are more likely to be in school than comparable natives, but over time, this difference decays. This matches Baker and Benjamin’s findings for Canada and suggests front-loading of immigrant husband’s human capital investment upon arrival in the United States. While this is consistent with the family investment model, such front-loading would of course also be predicted by human capital models applied to individual investment behavior (Becker, 1975). The latter seems a better explanation of our results in that, in contrast to Baker and Benjamin, we find similar results for immigrant husbands in mixed families, while for Canada, they found that husbands in mixed families were usually less likely to attend school than natives and had positive school attendance assimilation profiles. Moreover, again in
12
contrast to the results for Canada, we find no evidence that wives’ assimilation drives the excess enrollment decrease of men in immigrant families.18 Evidence on childbirth patterns can also shed light on the role of wives in financing their husbands’ school attendance. If immigrant wives in immigrant families are more likely to be performing this role than those in mixed families, then we expect the latter to front-load their childbearing to a greater degree than the former and indeed Baker and Benjamin found evidence that this was the case in Canada. However, the results in Table 5 are not consistent with this scenario. Specifically, relative to natives, the presence of young children (a proxy for recent childbearing) appears to be more front-loaded for immigrant than for mixed families. While husbands are clearly investing in human capital relatively intensively upon arrival, there is little evidence that wives in immigrant families are financing this activity by postponing childbearing.19
B. Alternative Specifications: Age at Immigration and Region-of-Origin Effects
Up to now we have attempted to replicate as closely as possible Baker and Benjamin’s specifications and have found that, in contrast to their results for Canada, immigrant wives in the United States appear to follow similar human capital accumulation patterns relative to natives as their husbands. In this section, we determine whether these results hold up to alternative specifications. We first consider issues relating to the age at which individuals migrated to the U.S., and second, whether our results could be explained by region-of-origin effects, which were not included in (1). 18
The individual husband and wife YSM (and YSM2) effects are roughly similar in magnitude though none are significant. The net YSM (and YSM2) effects are however significant and consistent with a reduction in school attendance with years in the U.S. (through 19.5 years). 19 In an examination of immigrant-native differences in total fertility (i.e., children ever born), Blau (1992) found evidence for the 1970-80 period, that women’s fertility tended to be disrupted by immigration. That is, upon arrival, immigrant women had fewer children than otherwise similar natives but that children increased relative to similar natives with time in the U.S. The results in Table 5 suggest the possibility that this pattern may no longer hold although it is possible that the positive coefficient on most of the cohort variables for presence of young children reflects an attempt by immigrants whose fertility has been disrupted to attain their desired family size. 13
Regarding the impact of age at migration, in our full sample of immigrants, some will have arrived in the U.S. as children and will have attained age 16, and therefore eligibility for our sample, some time between 1980 and 1990. While equation (1) relies on within-cohort changes to estimate assimilation effects, we do not observe a true within-cohort change in labor supply for those who recently arrived as children because they are not in the 1980 sample. More generally, results including those migrating to the U.S. as children may be misleading to some extent since they are more like Americans when they reach adulthood than those migrating as adults. To address these issues, following Rachel M. Friedberg (1993) and Borjas (1995), we have re-estimated all of our models on a sample of immigrants who migrated to the U.S. at age 18 or older.20 Representative results for the adult immigrant sample are shown in Tables 6 and 7, and are similar in most respects to the corresponding Tables 3 and 4 for the sample including all immigrants. Specifically, immigrant wives and immigrant husbands who came to the U.S. when they were at least 18 both work less than comparable natives upon arrival, regardless of whether they are in an immigrant family or a mixed family. The effects are stronger for immigrant families than mixed families among men, while the relative magnitude of cohort of arrival effects for women between immigrant and mixed families are ambiguous.21 Moreover, immigrant husbands and wives in both types of families have positively sloped hours assimilation profiles, with stronger effects for immigrant families than mixed families. Regarding wages, Table 6 shows that immigrant wives who came to the U.S. as adults have significantly positively sloped assimilation profiles regardless of family type, with a steeper slope for those in immigrant than in mixed families. Moreover, immigrant wives in immigrant families usually start with lower wages relative to comparable natives than those in mixed families. These findings are very similar to those in Table 3, although we now find stronger 20
To implement this sample selection, we evaluated the categorical period of immigration variables as in our computation of the YSM variables. 21 For some cohorts, the cohort dummies are more negative for wives in immigrant families, while, for other cohorts, the effects are more negative for wives in mixed families. 14
evidence of positive wage assimilation in mixed families. Immigrant husbands who came to the U.S. as adults now have wage patterns that are similar across the immigrant and mixed families (Table 7). Specifically, they start with low wages and have positively sloped assimilation profiles, and these effects are of similar magnitude across the two family types. It is possible that restricting the sample to adults has led to improved estimates of the wage profile for husbands and wives in mixed families because the latter may be more likely to include child immigrants. But, overall, our conclusion that wives appear to be investing in a similar manner to husbands (all relative to natives) is valid even restricting the immigrant sample to those who migrated as adults. One possible reason for the differences we have obtained in the behavior of immigrant families in the U.S. compared to Baker and Benjamin’s findings for Canada is that the U.S. and Canadian immigrants tend to come from different source countries and there may be behavioral differences associated with country of origin.22 For example, it is possible that female immigrants to the U.S. come from areas where women are more prone to invest in their own human capital than female immigrants to Canada. To investigate this possibility, we estimated the labor supply model in equation (1) and the associated wage equation separately for immigrants from each major world region. The regions were: Europe, North America, South America, Central America, the Caribbean, Africa, Asia, and Oceania, where region was defined by the focal individual (i.e. wife or husband). Our region-by-region series of regressions of immigrants versus natives showed results very similar to those in Table 1. First, husbands and wives who migrated at the same time had positively sloped, concave hours assimilation profiles for both husbands and wives within a region. Second, both husbands and wives within a region usually showed positive wage assimilation profiles.23 Finally, in almost every case, both husbands and wives started below 22
For example, European immigrants are a larger share of the total in Canada than in the U.S. For further evidence on U.S.-Canadian differences in source countries, see Borjas (1993). Since Baker and Benjamin’s data did not include information on source country, they were unable to examine region-of-origin effects. 23 Exceptions were negatively-sloped profiles for husbands and wives from Central America and husbands from Oceania. 15
comparable natives upon arrival in the U.S. with respect to hours and wages.24 Since our basic findings characterize almost all cohorts for every region, even if immigrants to the United States came from the same regions in the same proportions as those in Canada, we would have obtained results similar to the ones presented here in Table 1.25
C. Qualifications and Possible Explanations
The results we have presented suggest that for the United States, immigrant husbands and wives appear to invest similarly in their own human capital with time in the U.S. Our results are not consistent with the family investment model, and contrast strongly with Baker and Benjamin’s (1997) evidence in support of that model for Canada. However, there are some potential problems with the data and the empirical analysis that potentially apply to both studies which deserve serious consideration. First, with the exception of recent arrivals, in neither the Canadian nor the U.S. data are we able to observe marital status at the time of arrival in the receiving country. Hypothetical assimilation profiles for married couples are constructed on the assumption that all currentlyobserved married couples were married to each other for their entire stay in the U.S. or in Canada. To the extent that this assumption does not hold, the inferences made about assimilation profiles may be incorrect. Essentially, the problem is that the composition of the married populations may shift over time.26 However, it should be pointed out that for those in 24
There were three exceptions: Central America where, for some cohorts, husbands and wives worked more or earned more on arrival than comparable natives, and for other cohorts, they earned or worked less; wives from the Caribbean who had some positive and some negative hours arrival effects for different cohorts; and both husbands and wives from North America who had some positive and some negative wage arrival effects for different cohorts. 25 We also re-estimated the labor supply and wage equations including a full set of husband and wife country-oforigin dummy variables. There were 87 country dummies, resulting in a total of 174 additional variables included in the labor supply equations and 87 in the wage equations. The results for the cohort and assimilation variables were very similar to those in Table 1a. 26 Some well-known longitudinal data sets such as the National Longitudinal Surveys or the Michigan Panel Study of Income Dynamics allow one to observe marital status over time. However, concerns about sample size and the representativeness of the immigrant subsamples in these data files reduce their usefulness for our purposes compared to the Census. 16
the most recent cohort, we do observe marital status close to the time of entry in the receiving country.27 Thus, our basic finding that U.S. immigrant men and women start out with work hours below that of comparable natives, and by similar percentages, is likely to be accurate, as are Baker and Benjamin’s (1997) findings that Canadian immigrant wives start out with hours greater than comparable native wives’ and that immigrant husbands begin with hours below those of comparable native husbands. Moreover, a related study by Edward Funkhouser (2000) found that both male and female immigrants to the United States initially have lower employment rates then natives, but that employment rates tend to converge after 6-10 years in the country. While he did not look explicitly at the family context (i.e., did not focus on married women or examine the impact of spouse's characteristics), Funkhouser’s findings provide us with some confidence that the assimilation pattern which we observe for married immigrant women is not due to selection into the currently married category. Second, as we have seen, Baker and Benjamin estimated structural labor supply models to assess the simple labor supply hypothesis as an alternative to the family investment model in explaining the hours assimilation profiles they estimated. One can, however, question the estimation strategy for these labor supply models. In particular, the authors do not take account of the endogeneity of husband’s and wife’s wages which is implied by the human capital investment and family investment models,28 and they also treat asset income (which is clearly affected by wages) as exogenous. Thus, the true magnitudes of the wage elasticities and the assimilation profiles controlling for wages may be different from those estimated by Baker and Benjamin for Canada and those that we estimated for the U.S. However, Baker and Benjamin make the reasonable argument that in order for the labor supply model to explain their reduced form assimilation patterns, the required elasticities would be implausibly high in absolute value. Thus, the likelihood that an appropriate treatment of these endogeneities (with suitable 27
There may be some individuals who move into or out of the married category during this brief time interval, but this is likely to be a fairly small group. 28 Recall that wages are instrumented by wage decile to account for measurement error, a procedure that does not take into account these sources of endogeneity. 17
instruments) would lead to labor supply elasticities that could completely explain the Canadian hours assimilation patterns is small. In our case, we find in reduced form analyses for immigrants to the U.S. that husbands and wives have similar hours and similar wage assimilation profiles (Table 1). For labor supply responses to completely explain the reduced form results in Table 1, the following labor supply elasticities (evaluated at the sample mean hours and time in the U.S.) are required: own wage elasticities of 0.878 for husbands and 1.703 for wives; cross wage elasticities for 0.332 for husbands and -0.525 for wives.29 The required own wage elasticities are larger than those reported in Richard Blundell and Thomas MaCurdy’s (1999) review of labor supply studies. These ranged from -0.25 to 0.25 for men with most studies showing an elasticity of less than 0.1 in absolute value and .05 to 2.03 for married women, with 16 of the 17 studies cited having an elasticity of 1.18 or below. Regarding the cross-elasticities, the positive required value for men (.332) is counter to the vast majority of studies showing negative income effects for men (Blundell and MaCurdy 1999). For women, the required cross-elasticity of -0.525 is larger in absolute value than the income effect in every study cited by Blundell and MaCurdy, the vast majority of which ranged from -0.1 to -0.3.30 Thus, as was the case for Canada, the pure labor supply model implies parameter values that are implausible and thus is unlikely to be the full explanation for the hours profiles of U.S. immigrants. We also note that for the family investment model to have any explanatory power in Canada, it is necessary for the labor supply model to explain less than the full pattern of immigrant wives’ labor supply there—i.e. the negative hours assimilation profile. And Baker and Benjamin do indeed conclude that this is the case. In the U.S., the labor supply model also explains less than the full pattern of immigrant wives’ labor supply assimilation. However, in 29
These elasticities are computed as (∂ln(Hours)/∂ln(YSM))/(∂ln(Wages)/∂ln(YSM)). The required cross-wage elasticity of -0.525 for women is the same as the required income elasticity if all of the family’s income is earned by the husband. If the wife is working or if there is nonlabor income, then a cross-wage elasticity of -0.525 implies an income elasticity even larger in absolute value, since a given percentage change in the husband’s wage entails a smaller percentage change in family income, which is the denominator of the income elasticity.
30
18
this case, the hours assimilation profile is positively sloped. The fact that wives’ hours assimilation profiles are more steeply sloped than may be explained by the response to own and spouse wages is counter to the family investment model. Only if conventional labor supply parameters predicted a steeper than observed hours assimilation profile for immigrant women in the U.S. could we say that the assimilation profile of immigrant wives in the U.S. is what would be expected based on the family investment model. And of course we find exactly the opposite. If simple labor supply models are not the entire explanation for Baker and Benjamin’s (1997) Canadian hours assimilation and wage profiles and those we have found for the U.S., what can explain the differences between immigrant labor supply patterns in the two countries? First, we note that although U.S. immigration policy is more tilted toward admitting immigrants with low skills than Canadian policy, this difference is unlikely to explain our results. Specifically, Borjas (1993) finds that the relative skills of immigrants coming from the same country are similar in Canada and the U.S., implying that the overall difference in skills of immigrants in the two countries is entirely due to country of origin. Since we find similar results for each region of origin, different immigrant skill levels are not likely to explain the differences between our results and those of Baker and Benjamin. Second, Baker and Benjamin used a 1986-91 window to identify their immigrant assimilation profiles and cohort effects, while we used a 1980-90 window. On the one hand, a shorter window means that there are fewer unmeasured effects that may change over time than a longer window. On the other hand, the closer the end points of one’s interval (i.e., the shorter the period), the more like a single cross-section one’s data becomes, limiting one’s ability to separately identify cohort and assimilation effects. In any case, this difference in the data may help to explain our results. Note that we have used the Census rather than other microdata bases such as the Current Population Survey because the Census has far more observations on immigrants. Third, Canada has greater union coverage and much more generous social insurance programs than the United States (David Card and Freeman, 1993). While it is not obvious how 19
these differences could explain why the family investment model appears to work better in Canada than in the U.S., there could be a connection between such institutional features of the economy and immigrant behavior. Finally, we note that our tabulations based on the 1994-96 International Adult Literacy Survey (IALS) microdata, ever-married immigrant women were more likely to be currently widowed or divorced both absolutely and relative to natives in the U.S. than in Canada.31 Specifically, among 16-65 year old ever-married native women, the percentage currently married was 79.1% in the U.S. and 81.6% in Canada; however, among ever-married immigrant women, 72.4% were currently married in the U.S., compared to 83.0% in Canada. These differences were not explained by relative age, schooling or adult literacy differences between immigrants in Canada and those in the U.S. (Blau, Kahn, Moriarty and Souza, 2000). Thus, immigrant women’s marriages in the U.S. are overall more fragile than those in Canada. It is possible that the greater anticipated likelihood of being on one’s own in the U.S. leads women to invest in their own human capital to a greater degree than immigrant women in Canada.32 Of course, immigrant wives and husbands investing in their own human capital to a similar extent in the U.S. and following a family investment model in Canada could be the cause of, rather than a response to, the observed differences in marital stability.
III. Conclusions
This paper has examined the wage and labor supply assimilation patterns of immigrant husbands and wives in the United States in 1980 and 1990. We find that, upon arrival in the U.S., both immigrant husbands and wives earn and work less than comparable natives, with comparable shortfalls for men and women. However, with time in the U.S., the wage rates and 31
The IALS is the result of an international cooperative effort; for a further description. For a description, see OECD (1998). 32 For evidence of the impact of divorce rates on married women’s labor force supply, see William R. Johnson and Jonathan Skinner (1986). 20
work hours of both immigrant husbands and wives increase to a similar extent and eventually overtake those of comparable natives. It thus appears that husbands and wives are investing equally in their human capital. These patterns for women contrast sharply with those of Baker and Benjamin (1997) for Canada over the 1986-91 period. They found that, upon arrival in Canada, immigrant wives worked more than natives but that this advantage declined with time in the country. Immigrant husbands, however, had the same pattern we found for the U.S.: they started below natives in their labor supply but eventually caught up. These results were interpreted as consistent with a family investment model in which immigrant wives initially work to finance their husbands’ human capital investments but then reduce their labor force commitment (relative to comparable natives) when this investment is completed. Our results for the United States give little support for the family investment model and suggest that the primary pattern in the U.S. is for both immigrant wives and husbands to invest in their own human capital. The broader significance of our findings is that the extent to which the family investment model prevails for immigrants is likely to vary with the composition of the immigrant group and the circumstances in the receiving country. We have found that for at least one major country, the United States, this model is inadequate to explain immigrant assimilation patterns.
21
References Baker, Michael and Dwayne Benjamin, “The Role of the Family in Immigrants’ Labor-Market Activity: An Evaluation of Alternative Explanations,” American Economic Review 87 (September 1997): 705-727. Becker, Gary S., Human Capital (New York: Columbia University Press, 1975). Blau, Francine D., "The Fertility of Immigrant Women: Evidence from High-Fertility Source Countries," in George J. Borjas and Richard B. Freeman, eds., Immigration and the Work Force: Economic Consequences for the United States and Source Areas (Chicago IL: University Of Chicago Press, 1992), pp. 93-133. Blau, Francine D., Lawrence M. Kahn, Joan Moriarty, and Andre Souza, "The Role of the Family in Immigrants’ Labor-Market Activity: Evidence from the United States,” Working Paper, Cornell University, September 2000. Blundell, Richard, and Thomas MaCurdy, “Labor Supply: A Review of Alternative Approaches,” in Orley Ashenfelter and David Card, eds., Handbook of Labor Economics, Volume 3A (Amsterdam: Elsevier, 1999), pp. 1559-1695. Borjas, George J., “Assimilation, Changes in Cohort Quality, and the Earnings of Immigrants,” Journal of Labor Economics 3 (October 1985): 463-489. Borjas, George J., "Immigration Policy, National Origin, and Immigrant Skills: a Comparison of Canada and the United States," in David Card and Richard B. Freeman, eds., Small Differences That Matter: Labor Markets and Income Maintenance in Canada and United States (Chicago IL: University Of Chicago Press, 1993), pp. 21-43. Borjas, George J., “Assimilation and Changes in Cohort Quality Revisited: What Happened to Immigrant Earnings in the 1980s?” Journal of Labor Economics 13 (April 1995): 201245. Card, David and Richard B. Freeman, Small Differences That Matter (Chicago: University of Chicago Press, 1993). Chiswick, Barry R., "The Effect of Americanization on the Earnings of Foreign Born Men," Journal of Political Economy 86 (October 1978): 897-921. Duleep, Harriet Orcutt and Seth Sanders, “The Decision to Work by Married Immigrant Women,” Industrial and Labor Relations Review 46 (July 1993): 677-690. Freeman, Richard B., and Karen Needels, “Skill Differentials in Canada in an Era of Rising Labor Market Inequality,” in David Card and Richard B. Freeman, eds., Small Differences That Matter: Labor Markets and Income Maintenance in Canada and United States (Chicago IL: University Of Chicago Press, 1993), pp. 45-67. Friedberg, Rachel M., “Immigration and the Labor Market,” Ph.D. Dissertation, MIT, 1993. Funkhouser, Edward, "Convergence in Employment Rates of Immigrants," in George J. Borjas, ed., Issues in the Economics of Immigration (Chicago: University of Chicago Press, 2000), pp. 143-184.
Johnson, William R. and Jonathan Skinner, “Labor Supply and Marital Separation,” American Economic Review, 76 (June 1986): 455–69. Juhn, Chinhui and Kevin M. Murphy, “Wage Inequality and Family Labor Supply,” Journal of Labor Economics 15 (January 1997): 72-97. Goldin, Claudia, Understanding the Gender Gap: an Economic History of American Women (Oxford: Oxford University Press, 1990). LaLonde, Robert J., and Robert H. Topel, “The Assimilation of Immigrants in the U.S. Labor Market,” in George J. Borjas and Richard B. Freeman, eds., Immigration and the Work Force: Economic Consequences for the United States and Source Areas (Chicago IL: University Of Chicago Press, 1992), pp. 67-92. MacPherson, David A. and James B. Stewart, “The Labor Force Participation and Earnings Profiles of Married Immigrant Females,” Quarterly Review of Economics and Business 29 (Autumn 1989): 57-72. Mincer, Jacob. "Labor Force Participation of Married Women," in H. Gregg Lewis, ed., Aspects of Labor Economics, Universities-National Bureau Committee for Economic Research (Princeton, NJ: Princeton University Press, 1962). OECD, Human Capital Investment: An International Comparison (Paris: OECD, 1998).
23
Figure 1: Hours Profiles for Immigrant Families Relative to Native Families 300 WIVES: CANADA
Annual Hours Difference: Immigrants Minus Natives
200
100
0 0
5
10
15
20
-100 WIVES: USA -200 HUSBANDS: CANADA -300 HUSBANDS: USA -400
-500 Years Since Migration for Immigrants (assumed to be zero for natives)
25
30
Figure 2: Log Wage Profiles for Immigrant Families Relative to Native Families 0.2
Log Wage Difference: Immigrants Minus Natives
0.1
0 0
5
10
15
20
WIVES: USA -0.1 HUSBANDS: USA WIVES: CANADA
HUSBANDS: CANADA
-0.2
-0.3
-0.4 Years Since Migration for Immigrants (assumed to be zero for natives)
25
30
Table 1a - Assimilation Profiles of Hours and Wages Hours Independent Variable YSM, wife (x100 for log wage)
Wives Coeff. Std. Err.
Husbands Coeff. Std. Err.
Log Wages Wives Husbands Coeff. Std. Err. Coeff. Std. Err.
25.207
2.170
9.473
1.845
1.1410
0.1300
-0.416
0.036
-0.156
0.031
-0.0154
0.0024
-2.054
2.233
24.323
1.898
-0.043 -609.353 -251.208 -264.592 -180.993 -244.220 -317.414 -340.645 -291.181 -29.006 38.110 51.897 96.004 119.961 78.190 118.211 186.885 0.153 650,266
0.036 16.314 19.873 19.893 25.203 30.786 34.934 38.254 43.982 17.597 20.186 20.730 26.129 32.070 36.606 40.228 45.971
-0.368 -80.765 -95.234 -122.841 -78.472 -94.549 -98.459 -108.739 -97.112 -422.652 -217.384 -266.833 -214.143 -277.808 -307.492 -317.708 -312.185 0.126 650,258
0.031 13.839 16.879 16.939 21.457 26.197 29.722 32.548 37.423 14.904 17.117 17.647 22.238 27.281 31.133 34.208 39.088
2
YSM , wife (x100 for log wage) YSM, husband (x100 for log wage)
0.9950
0.1040
-0.0088
0.0019
-0.2120 -0.1792 -0.1513 -0.1058 -0.1111 -0.1238 -0.1676 -0.2257 0.229 594,440
0.0090 0.0106 0.0099 0.0122 0.0148 0.0170 0.0184 0.0223
2
YSM , husband (x100 for log wage) IM8589, wife IM8084, wife IM7579, wife IM7074, wife IM6569, wife IM6064, wife IM5059, wife IM50p, wife IM8589, husband IM8084, husband IM7579, husband IM7074, husband IM6569, husband IM6064, husband IM5059, husband IM50p, husband R2 Sample Size
-0.2731 -0.1630 -0.1153 -0.0788 -0.0946 -0.1353 -0.1612 -0.1604
0.176 435,356
0.0113 0.0133 0.0125 0.0151 0.0182 0.0208 0.0227 0.0280
Note: Additional controls for all equations include quadratics in age for both husband and wife, years of schooling of both husband and wife, English skill indicators for both husband and wife, number of children, a dummy variable for presence of children under 6 years old, race and ethnicity dummies for both husband and wife (black, other nonwhite, Hispanic), a metropolitan area dummy variable, regional dummy variables, and a year dummy.
Table 1b: Immigrant-Native Differences in Hours for Husbands and Wives in the 1975/79 Cohort Immigrant-Native Difference Evaluated at YSM = 5 10 15 20 25
Net YSM
Net YSM2
Wives
23.154 (1.831)
-0.459 -212.696 (0.035) (16.645)
-108.394 (11.928)
-27.025 31.411 66.914 79.484 69.121 (11.626) (14.037) (16.972) (19.673) (22.172)
Husbands
33.796 (1.558)
-0.524 -389.674 (0.030) (14.175)
-233.793 (10.150)
-104.110 -0.625 76.664 127.754 152.647 (9.875) (11.918) (14.411) (16.709) (18.838)
Group
0
30
Notes: Based on regression results reported in Table 1a evaluated assuming husbands and wives are in the same 2 arrival cohort; ie., the coefficients on own and spouse's YSM, YSM and IM7579 are summed.
Table 1c: Immigrant-Native Differences in Wages for Husbands and Wives in the 1975/79 Cohort
2
Immigrant-Native Difference Evaluated at YSM = 5 10 15 20 25
Group
YSM
YSM
Wives
1.141 (0.130)
-0.015 (0.002)
-11.527 (1.245)
-6.206 (0.871)
-1.652 (0.795)
2.134 (0.938)
5.152 (1.138)
7.403 (1.328)
8.886 (1.500)
Husbands
0.995 (0.104)
-0.009 (0.002)
-15.132 (0.987)
-10.377 (0.691)
-6.062 (0.640)
-2.186 (0.764)
1.250 (0.932)
4.246 (1.089)
6.803 (1.232)
0
Notes: Based on regression results reported in Table 1a; wage effects and standard errors have been multiplied by 100.
30
Table 2 - Labor Supply Equations Including Wage and Income Variables
Independent Variable Log (wife wage) Log (husband wage) Asset income YSM, wife 2 YSM , wife YSM, husband 2 YSM , husband IM8589, wife IM8084, wife IM7579, wife IM7074, wife IM6569, wife IM6064, wife IM5059, wife IM50p, wife IM8589, husband IM8084, husband IM7579, husband IM7074, husband IM6569, husband IM6064, husband IM5059, husband IM50p, husband R2 Sample Size
Wife's Annual Hours OLS 2SLS Coeff. Std. Err. Coeff. Std. Err. 228.207 -231.135 -0.008 24.767 -0.401 -0.814 -0.048 -568.967 -243.437 -263.405 -191.417 -251.773 -322.160 -345.041 -299.962 -71.885 6.870 20.996 75.490 98.866 56.450 88.738 149.303
2.364 2.116 0.000 2.135 0.035 2.197 0.036 16.059 19.554 19.573 24.798 30.290 34.372 37.639 43.274 17.319 19.863 20.398 25.708 31.555 36.018 39.581 45.232
325.547 -360.818 -0.007 24.628 -0.395 -0.141 -0.052 -551.172 -240.986 -263.544 -196.777 -255.780 -325.109 -348.663 -307.058 -94.265 -9.996 4.190 64.338 88.010 45.576 73.365 128.256
3.787 3.690 0.000 2.143 0.036 2.206 0.036 16.132 19.630 19.649 24.893 30.406 34.503 37.783 43.440 17.394 19.943 20.480 25.808 31.676 36.156 39.734 45.408
Husband's Annual Hours OLS 2SLS Coeff. Std. Err. Coeff. Std. Err. -13.944 -201.031 -0.002 10.051 -0.158 25.922 -0.383 -88.542 -104.014 -131.590 -85.858 -101.737 -107.715 -122.279 -115.040 -463.298 -246.665 -293.742 -230.325 -295.146 -325.790 -343.048 -344.859
2.025 1.812 0.000 1.827 0.030 1.879 0.031 13.708 16.713 16.772 21.245 25.938 29.429 32.227 37.053 14.761 16.950 17.474 22.019 27.012 30.826 33.870 38.703
-67.321 -135.717 -0.002 10.144 -0.161 25.601 -0.381 -98.436 -105.643 -131.742 -83.150 -99.753 -106.421 -120.713 -111.609 -451.964 -238.305 -285.333 -224.730 -289.689 -320.325 -335.410 -334.385
0.180
0.175
0.143
0.131
650,266
650,266
650,258
650,258
3.239 3.150 0.000 1.830 0.030 1.882 0.031 13.738 16.737 16.796 21.275 25.975 29.470 32.273 37.106 14.790 16.977 17.502 22.050 27.051 30.870 33.919 38.759
Note: Additional controls for all equations include quadratics in age for both husband and wife, years of schooling of both husband and wife, English skill indicators for both husband and wife, number of children, a dummy variable for presence of children under 6 years old, race and ethnicity dummies for both husband and wife (black, other nonwhite, Hispanic), a metropolitan area dummy variable, regional dummy variables, and a year dummy. Two-stage least-squares (2SLS) estimates use the decile of husband's and wife's wage as instruments for the husband's and wife's log-wages.
Table 3: Immigrant Wives' Assimilation and Cohort Profiles by Family Type A. Assimilation Profiles: Annual Hours
YSM, wife YSM2, wife YSM, husb YSM2, husb YSM, net YSM2, net
Immigrant family Coeff. Std. Err. 61.072 5.830 -0.791 0.068 -34.613 5.832 0.194 0.066 26.459 1.911 -0.597 0.043
Log wages Mixed Family Coeff. Std. Err. 6.396 1.884 -0.120 0.041 2.584 2.079 -0.048 0.046
Immigrant family Coeff. Std. Err. 0.02309 0.00485 -0.00031 0.00006 -0.00882 0.00484 0.00005 0.00005 0.01427 0.00159 -0.00026 0.00004
Mixed Family Coeff. Std. Err. 0.00011 0.00154 0.00002 0.00003 0.00265 0.00163 -0.00002 0.00004
B. Cohort Profiles: Both immigrants in same cohort IM8589 IM8084 IM7579 IM7074 IM6569 IM6064 IM5059
Coeff. -631.996 -208.937 -202.970 -60.489 -98.964 -203.834 -149.228
Std. Err. 15.506 19.884 16.689 21.068 24.765 28.487 27.817
Annual Hours Immigrant wife and native husband Coeff. -476.796 -179.724 -174.166 -89.243 -87.253 -101.328 -89.780
Std. Err. 29.030 31.413 23.647 24.957 26.908 27.140 21.518
Native wife and immigrant husband Coeff. -117.705 -54.065 -86.942 -62.705 -32.700 -61.307 -51.171
Std. Err. 33.256 32.103 25.818 28.266 31.273 31.413 23.510 2
Both immigrants in same cohort Coeff. -0.29394 -0.17543 -0.10534 -0.06077 -0.07502 -0.10624 -0.07048
Std. Err. 0.01404 0.01618 0.01446 0.01723 0.02021 0.02332 0.02347
Log wages Immigrant wife and native husband Coeff. -0.17346 -0.08049 -0.06152 -0.00377 0.01029 -0.00592 -0.03333
Std. Err. 0.02302 0.02431 0.01916 0.02012 0.02164 0.02201 0.01785
Native wife and immigrant husband Coeff. -0.03013 -0.00896 -0.03327 0.01858 0.02000 0.02006 -0.01833
Std. Err. 0.00023 0.00023 0.00019 0.00022 0.00024 0.00024 0.00019
Note: To obtain net YSM effects the coefficients on own and spouse's YSM and YSM are summed giving the effect for an immigrant whose spouse is in the same cohort. Additional controls for all equations include quadratics in age for both husband and wife, years of schooling of both husband and wife, English skill indicators for both husband and wife, number of children, a dummy variable for presence of children under 6 years old, race and ethnicity dummies for both husband and wife (black, other nonwhite, Hispanic), a metropolitan area dummy variable, regional dummy variables, and a year dummy.
Table 4: Immigrant Husbands' Assimilation and Cohort Profiles by Family Type A. Assimilation Profiles: Annual Hours
YSM, wife YSM2, wife YSM, husb YSM2, husb YSM, net YSM2, net
Log wages Mixed Family Coeff. Std. Err. 5.326 1.605 -0.103 0.035 7.359 1.769 -0.133 0.039
Immigrant family Coeff. Std. Err. -12.238 4.942 -0.020 0.058 41.519 4.944 -0.539 0.056 29.282 1.627 -0.560 0.037
Immigrant family Coeff. Std. Err. -0.00476 0.00368 0.00004 0.00004 0.01164 0.00369 -0.00012 0.00004 0.00688 0.00123 -0.00008 0.00003
Mixed Family Coeff. Std. Err. -0.00083 0.00120 0.00004 0.00003 -0.00047 0.00132 0.00004 0.00003
B. Cohort Profiles: Both immigrants in same cohort IM8589 IM8084 IM7579 IM7074 IM6569 IM6064 IM5059
Coeff. -483.752 -265.364 -341.801 -210.013 -264.470 -262.723 -204.817
Std. Err. 13.143 16.889 14.216 17.941 21.087 24.261 23.692
Annual Hours Immigrant wife and native husband Coeff. -91.295 -67.113 -109.895 -65.830 -70.221 -54.264 -58.494
Std. Err. 24.708 26.768 20.133 21.258 22.935 23.133 18.333
Native wife and immigrant husband Coeff. -374.356 -107.121 -144.199 -90.018 -83.325 -86.779 -72.431
Std. Err. 28.066 27.093 21.952 24.034 26.584 26.681 20.001 2
Both immigrants in same cohort Coeff. -0.19449 -0.16135 -0.12541 -0.06260 -0.05035 -0.04781 -0.04857
Std. Err. 0.01018 0.01266 0.01084 0.01337 0.01575 0.01812 0.01788
Log wages Immigrant wife and native husband Coeff. -0.05483 -0.02105 -0.01459 0.00872 0.01654 0.01347 -0.00715
Std. Err. 0.01805 0.01957 0.01484 0.01569 0.01703 0.01724 0.01386
Native wife and immigrant husband Coeff. -0.21324 -0.08417 -0.07709 -0.00611 0.03028 0.03717 0.00926
Std. Err. 0.02103 0.01983 0.01620 0.01767 0.01958 0.01970 0.01495
Note: To obtain net YSM effects the coefficients on own and spouse's YSM and YSM are summed giving the effect for an immigrant whose spouse is in the same cohort. Additional controls for all equations include quadratics in age for both husband and wife, years of schooling of both husband and wife, English skill indicators for both husband and wife, number of children, a dummy variable for presence of children under 6 years old, race and ethnicity dummies for both husband and wife (black, other nonwhite, Hispanic), a metropolitan area dummy variable, regional dummy variables, and a year dummy.
Table 5: Pooled Results Allowing Differential Effects Across Family Types A. Assimilation Profiles: Husband's School Attendance
YSM, wife YSM2, wife YSM, husb YSM2, husb YSM, net YSM2, net
Immigrant family Coeff. Std. Err. -0.0614 0.1470 0.0019 0.0017 -0.0479 0.1470 0.0009 0.0017 -0.1093 0.0484 0.0028 0.0011
Mixed Family Coeff. Std. Err. -0.0085 0.0478 -0.0001 0.0011 -0.1350 0.0527 0.0035 0.0012
Presence of Young Children Immigrant family Coeff. Std. Err. -0.1160 0.2630 0.0035 0.0031 -0.0155 0.2630 -0.0026 0.0030 -0.1315 0.0866 0.0009 0.0020
Mixed Family Coeff. Std. Err. -0.0268 0.0852 0.0013 0.0019 0.4000 0.0940 -0.0081 0.0021
B. Cohort Profiles: Husband's School Attendance Both immigrants in same cohort IM8589 IM8084 IM7579 IM7074 IM6569 IM6064 IM5059 a
Coeff. 0.1080 0.0678 0.0610 0.0215 0.0173 0.0154 0.0133
Std. Err. 0.0039 0.0050 0.0042 0.0053 0.0063 0.0072 0.0071
Native wife and immigrant husband Coeff. 0.0930 0.0740 0.0602 0.0365 0.0204 0.0220 0.0192
Std. Err. 0.0084 0.0081 0.0065 0.0072 0.0079 0.0079 0.0060
Presence of Young Children Both immigrants in same cohort Coeff. -0.0086 0.1150 0.0808 0.1003 0.0370 -0.0019 0.0237
Std. Err. 0.0069 0.0090 0.0075 0.0095 0.0112 0.0129 0.0126
Immigrant wife and native husband Coeff. -0.0618 0.1038 0.0082 0.0326 -0.0075 -0.0197 -0.0186
Std. Err. 0.0131 0.0142 0.0107 0.0113 0.0122 0.0123 0.0097
Coefficients and standard errors multiplied by 100 in the school attendance regressions. 2
Note: To obtain net YSM effects the coefficients on own and spouse's YSM and YSM are summed giving the effect for an immigrant whose spouse is in the same cohort. Additional controls for husband's school attendance include quadratics in age for both husband and wife, years of schooling of both husband and wife, English skill indicators for both husband and wife, number of children, a dummy variable for presence of children under 6 years old, race and ethnicity dummies for both husband and wife (black, other nonwhite, Hispanic), a metropolitan area dummy variable, regional dummy variables, and a year dummy. Controls are the same for the presence of young children regression except that number of children and the dummy variable for presence of children under 6 years old are excluded.
Table 6: Immigrant Wives' Assimilation and Cohort Profiles by Family Type, Adult Immigrants A. Assimilation Profiles: Annual Hours
YSM, wife YSM2, wife YSM, husb YSM2, husb YSM, net YSM2, net
Immigrant family Coeff. Std. Err. 86.751 8.760 -1.436 0.160 -37.964 8.904 0.105 0.149 48.787 3.421 -1.330 0.102
Log wages Mixed Family Coeff. Std. Err. 26.730 5.025 -0.593 0.127 7.354 5.663 -0.126 0.142
Immigrant family Coeff. Std. Err. 0.0304 0.0073 -0.0004 0.0001 -0.0096 0.0074 -0.00004 0.0001 0.0208 0.0029 -0.0004 0.0001
Mixed Family Coeff. Std. Err. 0.0083 0.0044 -0.0002 0.0001 0.0058 0.0043 -0.0001 0.0001
B. Cohort Profiles: Annual Hours Both immigrants in same cohort IM8589 IM8084 IM7579 IM7074 IM6569 IM6064 IM5059
Coeff. -689.347 -316.862 -298.483 -164.630 -227.597 -292.667 -253.824
Std. Err. 18.836 28.406 22.864 30.180 35.106 39.459 42.097
Immigrant wife and native husband Coeff. -531.465 -305.311 -318.469 -265.245 -314.079 -350.232 -348.395
Std. Err. 33.934 46.088 37.433 46.174 53.029 53.897 53.394
Log wages Native wife and immigrant husband Coeff. -127.477 -62.981 -115.751 -99.326 -115.789 -108.325 -92.855
Std. Err. 39.334 49.881 41.869 52.657 62.431 64.809 60.710 2
Both immigrants in same cohort Coeff. -0.3129 -0.2228 -0.1492 -0.1218 -0.1427 -0.1839 -0.1482
Std. Err. 0.0171 0.0234 0.0202 0.0247 0.0285 0.0320 0.0352
Immigrant wife and native husband Coeff. -0.1972 -0.1367 -0.1256 -0.1032 -0.0961 -0.1342 -0.1713
Std. Err. 0.0273 0.0379 0.0328 0.0400 0.0455 0.0462 0.0471
Native wife and immigrant husband Coeff. -0.0317 -0.0129 -0.0486 -0.0099 -0.0208 -0.0162 -0.0409
Std. Err. 0.0278 0.0367 0.0314 0.0402 0.0478 0.0497 0.0480
Note: To obtain net YSM effects the coefficients on own and spouse's YSM and YSM are summed giving the effect for an immigrant whose spouse is in the same cohort. Additional controls for all equations include quadratics in age for both husband and wife, years of schooling of both husband and wife, English skill indicators for both husband and wife, number of children, a dummy variable for presence of children under 6 years old, race and ethnicity dummies for both husband and wife (black, other nonwhite, Hispanic), a metropolitan area dummy variable, regional dummy variables, and a year dummy. Immigrants who came to the US as children and their spouses are excluded.
Table 7: Immigrant Husbands' Assimilation and Cohort Profiles by Family Type, Adult Immigrants A. Assimilation Profiles: Annual Hours
YSM, wife YSM2, wife YSM, husb YSM2, husb YSM, net YSM2, net
Immigrant family Coeff. Std. Err. -16.714 7.420 -0.209 0.137 70.889 7.541 -1.057 0.127 54.176 2.903 -1.267 0.086
Log wages Mixed Family Coeff. Std. Err. 19.710 4.256 -0.464 0.107 33.291 4.813 -0.773 0.121
Immigrant family Coeff. Std. Err. -0.0047 0.0055 0.0002 0.0001 0.0150 0.0056 -0.0003 0.0001 0.0103 0.0023 -0.0001 0.000001
Mixed Family Coeff. Std. Err. 0.0068 0.0033 -0.0002 0.0001 0.0098 0.0038 -0.0002 0.0001
B. Cohort Profiles: Annual Hours Both immigrants in same cohort IM8589 IM8084 IM7579 IM7074 IM6569 IM6064 IM5059
Coeff. -554.264 -430.509 -469.900 -366.149 -425.442 -397.055 -367.675
Std. Err. 15.961 24.110 19.444 25.650 29.838 33.565 35.806
Immigrant wife and native husband Coeff. -121.565 -150.934 -196.844 -177.271 -207.426 -184.813 -175.768
Std. Err. 28.847 39.156 31.790 39.183 45.001 45.751 45.279
Log wages Native wife and immigrant husband Coeff. -450.709 -281.037 -327.287 -312.392 -338.467 -274.212 -252.403
Std. Err. 33.181 42.163 35.640 44.791 53.061 55.054 51.632 2
Both immigrants in same cohort Coeff. -0.2042 -0.2159 -0.1734 -0.1219 -0.1079 -0.1144 -0.1258
Std. Err. 0.0125 0.0184 0.0151 0.0194 0.0225 0.0253 0.0271
Immigrant wife and native husband Coeff. -0.0725 -0.0714 -0.0686 -0.0634 -0.0702 -0.0850 -0.1059
Std. Err. 0.0213 0.0294 0.0242 0.0299 0.0344 0.0351 0.0351
Native wife and immigrant husband Coeff. -0.2423 -0.1538 -0.1524 -0.1053 -0.0679 -0.0582 -0.0840
Std. Err. 0.0251 0.0319 0.0273 0.0342 0.0405 0.0420 0.0403
Note: To obtain net YSM effects the coefficients on own and spouse's YSM and YSM are summed giving the effect for an immigrant whose spouse is in the same cohort. Additional controls for all equations include quadratics in age for both husband and wife, years of schooling of both husband and wife, English skill indicators for both husband and wife, number of children, a dummy variable for presence of children under 6 years old, race and ethnicity dummies for both husband and wife (black, other nonwhite, Hispanic), a metropolitan area dummy variable, regional dummy variables, and a year dummy. Immigrants who came to the US as children and their spouses are excluded.