NBER WORKING PAPER SERIES
TRADE AND INVESTMENT UNDER POLICY UNCERTAINTY: THEORY AND FIRM EVIDENCE Kyle Handley Nuno Limão Working Paper 17790 http://www.nber.org/papers/w17790 NATIONAL BUREAU OF ECONOMIC RESEARCH 1050 Massachusetts Avenue Cambridge, MA 02138 January 2012
The Bank of Portugal provided financial and research support to prepare the empirical application of this paper for its 2010 Annual Conference on Portuguese Development. The views expressed herein are those of the authors and do not necessarily reflect the views of the National Bureau of Economic Research. NBER working papers are circulated for discussion and comment purposes. They have not been peerreviewed or been subject to the review by the NBER Board of Directors that accompanies official NBER publications. © 2012 by Kyle Handley and Nuno Limão. All rights reserved. Short sections of text, not to exceed two paragraphs, may be quoted without explicit permission provided that full credit, including © notice, is given to the source.
Trade and Investment under Policy Uncertainty: Theory and Firm Evidence Kyle Handley and Nuno Limão NBER Working Paper No. 17790 January 2012 JEL No. D8,D92,E22,F02,F1,F5,H32,O24 ABSTRACT We provide theoretical and empirical evidence that policy uncertainty can significantly affect firm level investment and entry decisions in the context of international trade. When market entry costs are sunk, policy uncertainty can create a real option value of waiting to enter foreign markets until conditions improve or uncertainty is resolved. Using a dynamic, heterogeneous firms model we show that: (i) investment and entry into export markets is reduced when trade policy is uncertain, and (ii) preferential trade agreements (PTAs) are valuable to exporters even if applied trade barriers are currently low or zero. We derive a structural equation that predicts how firm entry responds to changes in applied tariffs and a theory-based measure of policy uncertainty. Our novel approach using observable trade policies allows us to estimate the impact of policy uncertainty and quantify its aggregate implications. We apply this method to Portugal's accession to the European Community in 1986 using new firm-level trade data. We find that (i) the trade policy reform accounted for a large fraction of the observed Portuguese exporting firms' entry and sales upon accession (ii) the accession removed uncertainty about future preferences and (iii) this uncertainty channel accounted for a large fraction of the predicted growth. These results have broader implications for other PTAs and our approach can be applied to analyze other sources of policy uncertainty. Kyle Handley Stanford University
[email protected] Nuno Limão Department of Economics University of Maryland 3105 Tydings Hall College Park, MD 20742 and NBER
[email protected]
1
Introduction
Firms face considerable uncertainty about future conditions affecting their costs, demand and profitability. This uncertainty can arise from purely economic shocks–e.g. to productivity or tastes–or policy shocks– e.g. monetary and fiscal innovations, tax and regulatory reforms. The role of future conditions is particularly important when firms must decide on costly irreversible investments such as adopting a technology, producing a new good or selling in a new market. In these cases, firms may wait for current conditions to be sufficiently good or for uncertainty about future conditions to be sufficiently low before they invest. We examine the impact of policy uncertainty on a firm’s decision to invest and export to new markets, which is an interesting setting for several reasons. First, the rising share of exports in firms’ sales increased their exposure to foreign policy uncertainty. Second, trade policy can be quite uncertain, as we discuss in detail in section 3. This uncertainty arises not because trade policy changes very frequently but because when it does, the changes can be quite large and persistent. One recent example was the widespread fear during the great recession that countries would shut their markets to international trade, as they did in the 1930’s.1 Third, there is growing evidence that firms must incur substantial fixed costs before exporting (cf. Roberts and Tybout, 1997). To capture the interaction between these fixed cost investments policy uncertainty we develop a tractable dynamic heterogenous firm model and derive the impacts of current and future trade policy on investment and export decisions. We then test the predictions of the model and quantify its aggregate implications by combining novel and detailed firm-level and trade policy data. Our work is also motivated by the importance of domestic policy uncertainty for economic activity, which has been the subject of recent debate.2 The basic theoretical impacts of uncertainty on investment are understood (cf. Bernanke, 1983 and section 2), and there is some recent evidence for the effects of aggregate volatility shocks.3 But there is little empirical evidence of the importance of policy uncertainty for firms. This is partly due to the difficulty in measuring policy uncertainty and linking it to specific investment decisions. The international trade setting can help address these issues. First, it allows us to construct detailed measures of policy uncertainty that are easy-to-interpret and vary across several dimensions: countries, 1 This fear was further fuelled by the worldwide trade collapse that started in late 2008 and was the sharpest trade contraction since WWII. To counter this uncertainty, leaders of the G-20 repeatedly pledged that “We will not repeat the historic mistakes of protectionism of previous eras.” http://www.londonsummit.gov.uk/en/summit-aims/summit-communique/ 2 Some have argued that the recent weak recovery in the U.S. is partially due to uncertainty over fiscal policy and regulatory reform. See for example, “Minutes of the Federal Open Market Committee,” August 9, 2011, http://federalreserve.gov/monetarypolicy/fomcminutes20110809.htm; “Uncertainty and the Slow Recovery,” Wall Street Journal, January 4, 2010. Becker, Gary S., Steven J. Davis and Kevin M. Murphy. 3 Bloom et al. (2007) and Bloom (2009) provide evidence that shocks to stock market volatility delay firm-level investment and attenuate its response to demand shocks.
1
products and time. Second, we can trace the effects of these measures to specific firm investment and sales decisions that also vary along those dimensions. To the extent that other taxes are persistent but uncertain, as trade policy is, our findings for a strong role of trade policy uncertainty (henceforth TPU) suggest there is a potentially important role of domestic policy uncertainty as well on firms. Our basic theoretical framework can be applied to different settings. However, in order to clearly measure trade policy uncertainty and estimate its effects, we must focus on a specific one. In this paper we analyze preferential trade agreements (PTAs), whereby countries eliminate protection relative to a subset of partners, which is the most active form of trade policy in the last 20 years. As of July 2010, there were 283 PTAs in force–a dramatic increase since 1990–and 474 have so far been notified to the World Trade Organization (WTO).4 There are multiple reasons for PTAs and active research on their real value. PTAs can be a source of policy uncertainty because in any given year, an exporter to a market is now more likely to have a price advantage (if it becomes a PTA member) or disadvantage (if another country does). While on average countries may currently face more TPU due to rising numbers of PTAs, the members of each PTA secure preferences, which can lower the TPU they face in exporting to that market. We discuss this motivation for several recent PTAs in section 3. To examine the impact of TPU on firms we require detailed data. We will argue that Portugal’s accession to the EC provides an excellent setting to study this issue for several reasons. First, the focus on a specific country and policy event allows us to cleanly identify the effect and carefully control for a number of factors. Second, we expect the effects of TPU to be most important for small, developing, open economies where trade is central both to consumers and firms.5 So, Portugal’s experience in 1986 may be highly relevant for many developing countries today seeking secure access to US and EC markets. Third, Portuguese trade increased dramatically after 1986. As we document in section 3, that increase was largest towards the EC partners, suggesting that it was caused by the accession. Finally, the export expansion upon accession was characterized by considerable entry of Portuguese firms into EC markets even in industries where applied tariffs did not change, which indicates the potential role for the agreement in reducing TPU. In section 3 we show that this expansion cannot be explained by standard aggregate determinants of trade such as income and exchange rates, which suggests they may be driven by changes in expectations about trade policies. In section 4 we build a dynamic model to show precisely how reductions in TPU increase entry and trade. 4 http://www.wto.org/english/tratop_e/region_e/region_e.htm
(accessed November 29, 2010) large fraction of Portuguese firms are engaged in some form of international trade–about 24%–and account for a large fraction of private sector non-agricultural employment–58% or 46% if we focus only on exporters. These figures for 1987 are based on merged information Quadros de Pessoal and International Trade statistics available from INE. 5A
2
We derive a structural equation that relates the entry decision to current policy and a measure of TPU: the percent loss in profits due to a negative tariff shock that eliminates tariff preferences. In section 5 we test and find evidence for the entry and export predictions. We estimate that Portuguese exporters believed there was a 39% probability of losing preferences before the agreement and zero after. So the agreement eliminated that source of TPU. Overall, the trade policy changes accounted for a substantial share of the observed growth in entry (61%) and export value (87%) in the data. Moreover, we perform counterfactuals to decompose the role of applied tariffs vs. TPU. We find that the applied tariff changes can account only for between 0.4-0.5 of the total policy effect for Spain and 0.1-0.2 for the EC-10, so a large part of the PTA’s effect was due to the credible elimination of TPU. In this sense our results may have broader implications for evaluating how the investment and market-entry effects of other types of trade or tax policy reforms depend on their credibility.6 In the final section we discuss additional applications of our framework and implications of the results.
2
Related Literature
To examine the impact of policy uncertainty we focus on a dynamic model of firm investment and entry. If entry costs are sunk and at least partially irreversible, a prospective firm must consider the time path of other variables that affect profitability. Dixit (1989) shows that uncertainty about future prices creates an option value of waiting so firms will delay investments in entry or exit until they receive more information. In this setting, entry and exit depend on the variance of shocks, their persistence and the size of sunk costs. Baldwin and Krugman (1989) extend these theoretical insights in a model with uncertainty about the exchange rate and homogenous firms. They show there is a possibility for “beachhead effects”: after a firm receives a positive shock and pays the sunk cost of entry into exporting it will not immediately reverse its investment even if the initial shock is reversed. Thus even temporary shocks can have lasting effects. There is considerable evidence that firms are heterogenous, a fact that is particularly important in the context of international trade. Starting with Bernard and Jensen (1995) an extensive literature has developed, which documents the fact that exporters tend to be larger and more efficient than non-exporters.7 6 To the extent that some PTAs are more credible than others our results can help explain recent aggregate evidence on large impacts of some PTAs on trade flows and the mixed results for others (Baier, et al. 2007). 7 We can also verify this directly in our data for Portugal in the period we are interested: in 1987 the median number of employees for all exporting firms (with at least one employee) was 28, which is 7 times larger than the median number for all private non-agricultural firms in the economy.
3
Moreover, there is evidence of self-selection into exporting: i.e. that the larger, more productive firms are the ones that can overcome fixed costs and export. A large number of recent models incorporate firm heterogeneity and show it has important theoretical and empirical implications for trade (cf. Melitz, 2003, and Bernard et al. 2003). Particularly important from our perspective is the fact that in this type of model the extensive margin may dominate the response of trade flows to reductions in trade barriers (as argued by Chaney, 2008) and that the failure to control for firm heterogeneity in gravity models results in an upward bias to aggregate estimates of trade frictions (Helpman et al., 2008). Therefore we will focus on a dynamic model of entry into exports where firms have heterogenous productivity. The increasing evidence of sunk costs in export-market entry (cf. Roberts and Tybout, 1997), has lead some to consider alternative sources of uncertainty that can generate hysteresis and real option problems in trade models. These sources of uncertainty include exchange rate, demand, productivity, and our focus, policy uncertainty. However, most theoretical and nearly all empirical analysis of uncertainty remains confined to the impact of exchange rate volatility, about which evidence remains mixed.8 Das et al. (2007) find that sunk costs are quantitatively important in explaining export participation of marginal firms in Colombia and use a structural model to show that subsidies to sunk costs could raise entry substantially but find limited evidence that exchange rate volatility affects entry and exit. More broadly, studies of the impact of exchange rate volatility on aggregate trade flows find that effect is negative but “fairly small and is by no means robust” (IMF, 2004, p.6).9 The impact of trade and tax policy uncertainty when there are sunk costs of investment, has received far less attention. One difficulty is that most policy processes are not readily adapted to a standard stochastic process and major regime changes may be “rare events”. This does not mean however that such “rare events” are irrelevant for investment decisions, as recently emphasized in a different context by Barro (2006). Even if the fears of temporary reversal to protection or major trade wars never materialize, the small possibility of these worst case scenarios can have measurable economic effects. The scant work on this area is largely theoretical, for example Rodrik (1991) develops a model of capital investment when firms believe an investment tax credit reform may be reversed in the future. If the probability or cost of a policy 8 Campa
(2004) finds evidence of sunk costs of entry for Spanish firms but smaller than anticipated effects of exchange rate volatility. Baldwin (1988) uses aggregate data and finds that large exchange rate shocks in the 1980s may have led to “beachhead effects” but is unable to rule out alternative explanations for the findings given the aggregate nature of the data. 9 Impullitti et al. (2011) incorporate evolving productivity uncertainty into a heterogeneous firms model to show that sunk costs can generate a large number of small persistent exporters, which is consistent with having an option value of waiting to exit. Arkolakis (2011) explains this same pattern by assuming increasing fixed costs of market penetration to reach consumers in a model without an option value of waiting to enter.
4
reversal is high, a reform to promote investment may produce exactly the opposite outcome. Empirically, Aizenman and Marion (1993) show that low persistence of monetary and fiscal aggregates has negative effects on investment and growth in cross-country regressions. Trade models generally assume policy is static or assume that reforms are either fully anticipated or unanticipated (cf. Constantini and Melitz, 2008; Burstein and Melitz, 2011). We can learn something about the response of trade to reform in these models. But many reforms are not perceived as permanent ex-ante or genuinely unanticipated. Moreover, the models may be calibrated to elasticities estimated under uncertainty, which we will argue do not generally reflect the true impact of a reform when uncertainty is itself changing. Our model can capture some of the extreme assumptions about anticipation of shocks as special cases and allow for the more general and possibly realistic behavior where firms may expect a reform but remain uncertain about its timing and magnitude. There is an ongoing empirical debate regarding the value of bilateral and multilateral trade agreements. The impact of European Community (EC) membership on trade flows, which we examine here for the case of Portugal, is certainly no exception. Early work on the trade effects of PTAs delivered mixed results, e.g. Frankel (1997) reports small and sometimes negative effects of EC membership on bilateral trade between members in the 1960s and 1970s but positive ones in the 1980s and 1990s. Small trade effects have also been found by ex-post econometric studies of other PTAs, which seems puzzling given the ex-ante zeal of policy makers for entering such agreements. Baier and Bergstrand (2007) argue that accounting for potential selection into PTAs is important and find that when this is done some of these agreements can increase trade by as much as 100%. However, the aggregate trade impact of some PTAs remains mixed.10 In addition to self-selection there are other potential explanations for the recent findings of the large trade impacts of some PTAs. They may be due to competitive reallocation and productivity enhancing investments induced by trade liberalization (Constantini and Melitz, 2008; Chaney, 2005; Trefler, 2004). Alternatively, PTAs may imply permanent reductions in trade frictions so future shocks to macro variables may have larger effects on expected profits and this can generate entry as argued by Ruhl (2008). The latter motive is related to the one we explore but we model the TPU channel and estimate its impact econometrically. Much less is known about how and why trade grows following PTAs. Most empirical work 1 0 Applied general equilibrium models often grossly under predict the response of trade flows to the tariff reductions in PTAs, a challenge documented by Kehoe (2005) for the North American Free Trade Agreement. PTAs may also be valued if market agents prefer policy stability as hypothesized by Mansfield and Reinhart (2008) who also provide aggregate evidence that PTAs reduce trade variability and increase exports.
5
remains at the aggregate cross-country level and does not examine the details of PTA policy changes.11 Handley (2011) extends the model we employ to analyze not PTAs but instead the role of multilateral policy commitments by WTO members known as tariff “bindings.”12 He measures uncertainty faced by exporters using the gap between applied and WTO bound tariffs set by Australia and finds that this form of TPU lowers both the level of product entry and the elasticity of entry to applied tariff reductions. To our knowledge there are no tests of the impact of TPU (unilateral, preferential or multilateral) on firm level investment and entry decisions into export markets.
3
Trade Policy Uncertainty and Portugal’s European Integration
The main purpose of this section is to provide some facts and a preliminary aggregate analysis of Portugal’s European trade integration. We first describe some basic features of the world trading system and highlight several sources of TPU. We then provide background information on Portugal’s preferential agreements with various European countries. The EC accession in 1986 generated considerable aggregate export growth towards those partners and it was characterized by the entry of new firms into those markets. We argue that the aggregate evidence is consistent with an uncertainty-reducing role of EC accession but possibly also with other explanations thus in section 5 we explore the firm-level predictions.
3.1
Trade Policy Uncertainty in the World Trading System
As we note in the Introduction there are good reasons to be concerned about TPU and yet very little research on its sources and impacts. This may partly be due to the fact that trade policy is perceived not to be very volatile; after all statutory tariff rates are legislated at most on a yearly basis. However, applied trade policy can be more volatile than what is suggested by focusing on statutory tariff rates since they are by no means the only type of protection. Limão and Tovar (2011) employ the estimates in Kee et al. (2009) and note that the trade restrictiveness index for the typical country in the world is equivalent to a uniform tariff of 14% , but this jumps to 27% when non-tariff barriers are included. Several of these NTBs are not strictly (if at all) regulated by the WTO and even the ones that are can be used by countries, sometimes 1 1 One exception is Evenett et al. (2004) who examine whether MFN tariffs are more secure than the ad-hoc preferential duties of the Generalized System of Preferences (GSP). They find inconclusive evidence for Bulgaria and Ecuador’s exports to developed countries. 1 2 Recent independent work by Sala et al. (2010) also studies the impact of WTO bindings on exports theoretically but not empirically.
6
on a temporary basis and for specific goods. But even temporary measures can remain in place for months or years.13 The ability to use unregulated policy instruments can interact with macroeconomic or political shocks to generate considerable uncertainty. For example, there was widespread fear that the recent economic downturn would result in a substantial increase in protectionism. This included the possibility of anti-dumping measures; increases in developing country tariffs from their applied level to the maximum allowed under international agreements; and the use of government procurement measures such as the “buy-American” provision attached to the US stimulus bill. Even though the worst fears of a trade war were not realized, the real possibility of the outcome created uncertainty. Our model illustrates how these fears can affect investment and exporting decisions. Turning to more permanent sources of TPU a number of examples stand out: first, concerns with product quality and safety raise the possibility that certain products may be completely banned from a market, e.g. genetically modified foods in the EU; second, the US threat of import duties to counter Chinese currency “manipulation”; third, the possibility of using “environmental” duties at the border to offset differences in carbon emissions in production. Again we stress that even if these policies remain only a remote possibility, the fact that if they materialize they would be significant and possibly permanent can have important impacts in current investment and export decisions. It is conceivable that these effects could be larger than temporary exchange rate movements that may be hedged against. One measure of governments’ concern with this source of policy uncertainty are their attempts to negotiate trade agreements. One of the central reasons for the formation of the GATT was the desire to avoid the disastrous tariff wars in the 1930’s, which shut down many markets to exporters. Reductions in applied protection after 1945 were small, but Irwin (1994) suggests the credibility of the GATT regime may have played a role in the trade and economic growth of post-war western Europe. To this day the GATT’s successor, the WTO, lists as one of its functions and principles: “Predictability through bindings and transparency [to] promote investment and allow(s) consumers to fully enjoy the benefits of competition.” (www.wto.org) and we will see that these channels will be central in our model. However, multilateral agreements are themselves uncertain in terms of timing, negotiation outcomes and 1 3 For example, in June 2001 the US started an investigation that eventually lead to the steel safeguards of about 30% in March of 2002. These duties remained in place for almost 20 months and were only removed after a negative ruling from the WTO. Foreign exporters of steel were not compensated for this loss. More generally, Grinols and Perrelli (2006) report that the typical U.S. dispute under the WTO lasts about 18 months with a large standard deviation of about 10 months. Another example of NTBs is anti-dumping duties, which can be punitive.
7
implementation. Successive rounds of trade negotiations have repeatedly failed and later been resurrected. For example, an aborted attempt was made to start the Uruguay Round in 1982 and negotiations only restarted in 1986. After that round, attempts to start a new round failed at Seattle in 1999. Moreover, each successive round has taken longer to complete than the previous. The Uruguay Round took over 7 years to complete, twice as long as expected, and the Doha Round was launched in 2001 and nine years later it is still unresolved. Even when an agreement is successfully concluded the implementation takes some time, disputes arise and not all policies are covered. Moreover, multilateral agreements do not regulate all types of trade policy. This can generate uncertainty in periods of crisis, as discussed above, but also in quieter times. To see why note that currently two firms exporting a similar product to the same market may face very different policy barriers. While the tariffs that countries negotiate multilaterally must be available to all WTO members, this so called Most-FavouredNation (MFN) tariff is in practice often the policy faced by the “least-favoured-nation”. The reason is the myriad of preference schemes available. These include not only the standard PTAs but also unilateral preferences the US, EU and several other developed countries extend to developing nations, e.g. through the Generalized System of Preferences (GSP). These preferences generate uncertainty for the “least-favourednations” whose firms don’t know if they will face more competition from firms that receive preferences and also become less certain of any future multilateral tariff reductions14 . Unilateral preference schemes, such as the GSP, are also extremely uncertain for the recipients themselves. These preferences are often conditional not only on trade but also non-trade related criteria that can and have triggered non-renewal for specific countries.15 This is one reason why recipients of such unilateral preferences try to negotiate more permanent arrangements even if that requires them to open up their markets. For example, Peru and Colombia received unilateral preferences along with other Andean countries through the ATPA and then sought FTAs with the US to secure permanent preferential access. A USITC report describes the issue as follows
“The probable future effects of ATPA are likely to be minimal, as investor uncertainty over ATPA renewal and concerns about the impact of recently negotiated U.S. bilateral FTAs with Colombia and Peru have dampened regional interest in investment to produce ATPA-eligible 1 4 Limão (2006) and Karacaovali and Limão (2008) find that preferences provided by the US and EU respectively caused them to maintain relatively higher multilateral tariffs against the rest of the world in the Uruguay Round. Estevadeordal et al (2008) find that PTAs within Latin America generated reductions in external tariffs in those Latin American countries. 1 5 During the period 1993-2008, the United States allowed the GSP to expire seven times for periods lasting from two to fourteen months (Jones, 2008).
8
exports, particularly in Bolivia and Ecuador. (p. ix)” (USITC, 2008)
As just noted, preferences tend to be more secure when they are part of a formal and reciprocal preferential trade agreement (PTAs). There are currently hundreds of such arrangements reflecting both trade and non-trade motives (Limão, 2007). Potential trade benefits include not only guaranteeing access to specific markets to secure pre-existing unilateral preferences (as described for US-Colombia, and as we will argue for Portugal’s EC accession) but also to insure (i) against some forms of protection in that country (e.g. U.S. PTA partners were exempt from the steel safeguards) or (ii) against a trade war breaking out in the rest of the world (Perroni and Whalley, 2000). But even the best laid plans to move forward on regional and bilateral arrangements are fraught with uncertainty. Plans for an FTA of the Americas began in the 1990s and have been abandoned. The US signed FTAs with Korea and Colombia that awaited ratification years after the main negotiations ended. Several Eastern European countries had preferential market access to the EU before securing those preferences more permanently as EU members. Moreover, there is still a long list of candidates that have begun or await negotiations to join the EU. Similar issues have affected accessions to the European Market: the United Kingdom was initially vetoed for membership in the 1960s, but later joined the club in 1972; Turkey has been in negotiations for over 20 years; and Portugal’s road to full membership was also long and fraught with uncertainty, as we now describe.
3.2 3.2.1
Portugal’s European Trade Integration Background and Stylized Facts
Portugal’s market access to its European partners in the 1970s and early 80s displayed many of the same characteristics associated with uncertainty outlined above. Prior to joining the European Community (EC), Portugal was a founding member of the European Free Trade Area (EFTA), which was signed in 1960. By the late 1960s, EFTA had achieved free trade in industrial products. When the UK and Denmark left EFTA in 1972 to joint the EC, the remaining EFTA countries (including Portugal) signed bilateral agreements with the EC that implemented free trade in industrial products by 1977. Portugal’s trade with neighboring Spain remained highly restricted until the EFTA-Spain agreement of 1980. This agreement began a partial liberalization of Spain’s tariffs against the EFTA countries. In the first phase from 1980-1983, a three tiered system of reductions on industrial products would reduce tariffs
9
by 25% to 60% with EFTA partners. Portugal was granted even greater reductions of up to 80%.16 A second phase of reductions over a period of indeterminate length was supposed to commence in 1984. The EFTA-Spain agreement contained no definite timetable or scheduled reductions for the second phase and was thus potentially incompatible with GATT Article XXIV’s requirement that PTAs implement zero tariffs on substantially all trade. This uncertainty about the elimination of tariffs is clear from a GATT report where one of its members noted that the EFTA-Spain agreement
“provided only an expectation that at some point in time the duties and other regulations of commerce would be eliminated but no specific provisions existed in this respect. There was a great difference between an expectation and a specific plan and schedule”.17
The same document notes that subsequent notifications to the GATT show that the preferential reductions between Spain and EFTA in place by 1983 were simply extended and then renewed multiple times by an oversight committee. By 1984 both Spain and Portugal were in protracted negotiations for accession to the EC. The Articles of Accession to the EC required another round of tariff reductions between Portugal, Spain and the EC-10 countries and harmonization with the EC Common Customs Tariff (CCT). The agreement was signed in the middle of 1985 and the accession entered into force on March 1, 1986. Protocol 3 of the Acts of Accession required Spain to fully liberalize industrial tariffs against Portugal immediately to harmonize with the preferences already granted by the existing EC-10 countries to Portugal. Spain’s agricultural tariffs were reduced by 12.5% per year, with respect to Portugal and the EC-10, to achieve free trade in most products by 1993. Some non-tariff measures and quantitative restrictions would be fully or partially liberalized only by 1996. Both Spain and Portugal would implement the external CCT either (i) immediately if the national tariff was within 15 percentage points of the CCT or (ii) by 1993 for products where the initial tariff was outside this range. The EC-10 countries phased in full liberalization by 1992 of agricultural tariffs against Portugal at 14.3% per year. Before modelling and estimating the impact of uncertainty it is useful to examine the broader impacts of these preferences on Portugal’s trade and investment in exporting. During the 1950’s and 60’s Portugal 1 6 Details of the reductions can be found in the text of the “Agreement Between the EFTA Countries and Spain,” signed May 26, 1979 and entering into force on May 1, 1980. Annex P contains the timetable and list products with tariff reduction for Spain and Portugal. GATT notifications indicate that these scheduled reductions were implemented as planned (“Agreement Between the EFTA Countries and Spain, Information Furnished by Parties to the Agreement" L/5465, March 8, 1983). 1 7 “Agreement between the EFTA countries and Spain”, Report of the Working Party," L/5405, October 24, 1980, p.3
10
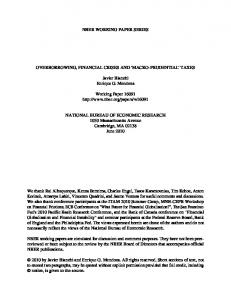
was relatively closed to trade; its goods trade/GDP ratio averaged only about 30% going above 40% in the 1970’s and 50% in the 1980’s.18 Between 1985 and 1992 real exports grew by 90% and imports by about 300%.19 The fraction of firms involved in trade went from 22% in 1986 to 26% in 1992 and employment in firms that trade increased by about 200,000.20 The historical impact of European preferential agreements on Portugal’s aggregate trade/GDP ratio is sometimes clear, e.g. imports/GDP rose rapidly upon EC accession, but not always. What seems clear is that these agreements had a strong effect on the trade orientation towards preferential partners. The trade share with EFTA countries increased from about 20% in 1960 to 30% in 1973, as shown in Figure 1.21 The figure also reveals that the termination of agreements is important. The exit of Denmark and the UK (which accounted for half of Portugal’s trade with EFTA) to join the EC in 1973 initiated a rapid decline in Portugal’s trade share with these countries.
0.16
0.30
Portuguese Trade Shares with original EFTA countries
1951
1960
1972 year
1992
1960: EFTA signed; 1972: EFTA-EC agree FTA; UK/DK exit EFTA
Figure 1 1 8 The 2006 ratio is from Bank of Portugal online statistics. The historical ratios for trade in goods are calculated from current price data in Pinheiro et al (1997). 1 9 Authors’ calculations based on data from Pinheiro et al (1997) 2 0 Authors’s calculation from merged information of Quadros de Pessoal and International Trade statistics from INE. 2 1 Source of the trade data: IMF Direction of Trade Statistics.
11
0.40
0.50
0.60
0.70
0.80
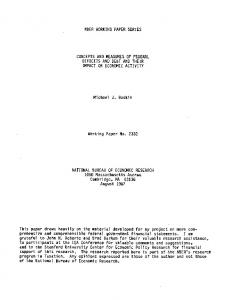
Portuguese Trade Shares with EC-10 & Spain
1951
1972 year
1985
1992
1972: EC industrial preferences agreed 1985: Accession signed
Figure 2
Figure 2 shows the re-orientation of Portugal’s trade with its EC preferential partners starting in 1985. The share with the EC-10 and Spain goes up from 52% in 1985 to 72% in 1992. If we exclude Spain we still find that the trade share with EC-10 went from 47% to 57% over that period. The other interesting point is that the initial preferential agreement between the EC and Portugal (agreed in 1972, fully implemented by 1977) and Spain and Portugal (early 1980’s) left their trade share nearly unchanged at about 50% between 1972 and 1985.22 The strong increase in trade shares with the EC after 1985 was not merely a switch away from exporting to other markets. There is strong evidence of trade creation: total real exports in 1993 were almost twice as high as in 1985 (Pinheiro et al., 1997). Starting in 1981 we have access to data from the Portuguese census (INE) that, to our knowledge, has never been analyzed for this period: international trade by Portuguese firms at the transaction level. This allows us to examine whether the source of the growth in trade is related to firms entering the preferential markets. To determine if net entry is differentially larger for preferential markets we contrast it to the growth in the number of firms exporting to large non-preferential markets such as the U.S. As the dotted line in Figure 3 shows there was positive and rather substantial net entry of exporting firms into the US between 1981 and 1985 but almost none between 1985 and 1992. In contrast to this, the number of Portuguese firms exporting to Germany (dashed line) grew by 65 log points between 1985 and 1992.23 Entry into the Spanish market was even more pronounced, over 150 log points in the 1985-1992 period with an apparent upward 2 2 We
can detect more of an effect during this period if we focus on Portuguese export shares alone, which go from 50% to 62% in this 13 year period. But export growth is faster after the 1986 accession and the EC share in Portugal exports goes up to 73% in only 7 years. 2 3 Other important Portuguese preferential markets such as the UK displayed a similar trend to Germany, as did France but the latter exhibiting faster growth post-1985.
12
break in the trend around 1985.24
-.5
0
.5
1
1.5
Portugal's Export Firm Entry Growth 1981-1992
1980
1985
1990
Spain
Germany
1995 US
Figure 3
3.2.2
Aggregate Evidence of EC Impact on Portuguese Exports and Entry
We now provide evidence that the increase in Portuguese exports and number of firms towards the EC after accession cannot be fully explained by standard determinants. We also find the accession has a quantitatively important effect on the extensive margin (number of firms) and this translated into significant aggregate export increases. The main objective of these and other findings we discuss in this section (and in further detail in the appendix section B.4) is not to test a specific channel by which accession worked. We seek to gauge the aggregate importance of accession and help motivate the model we develop to provide detailed predictions on the channels linking accession to trade and investment, which we test in section 5. The EC accession was not the only notable economic event Portugal experienced in the 1980’s. Earlier, in August 1983, Portugal completed an agreement with the IMF to help it resolve a balance of payment crisis. The nominal Portuguese exchange rate continued to depreciate against the major European currencies until 1990, but starting in 1985 it experienced some appreciation relative to the US dollar.25 To account for this and other effects, e.g. changes in incomes and prices, we can estimate an aggregate gravity equation for Portuguese exports. This is by now a standard tool to estimate the impact of PTAs on aggregate trade flows. To account for the potential endogeneity of PTAs (e.g. because they may be more common between countries that already trade more) we include bilateral fixed effects. These also account for other time 2 4 Our analysis here stops in 1992 for two reasons. First, as discussed above this was the end of the initial period accession. Second, there was a major change in the data collection procedures in 1993 due to the removal of physical customs barriers within the EC. The new system, Intrastat, is based on self-reporting and has minimum export value thresholds, both of which imply that the number of firms in the data in 1993 exhibits a discrete fall that affects only EC partners. 2 5 The aggregate real exchange rate did not exhibit large changes between 1980-1991 according to the IMF IFS statistics.
13
invariant differences in Portuguese exports to each of its partners (distance, colonial ties, etc.).26 We also include year effects to control among other things for Portuguese productivity and price changes (since we use nominal export values). Moreover, we control for bilateral nominal exchange rates, price deflators in the import country and their real GDP. By interacting an EC accession time dummy (=1 for 1986 and subsequent years) with the member country dummies (Spain or EC-10) we can then test if Portuguese exports to these preferential markets grew differentially relative to the rest of the world. To avoid confounding the trade policy effects of accession with other possible motives why accession may have increased trade, as discussed below, we end our sample in 1990. The results in the first column of Table 1 show an increase of 23 log points towards the EC-10 in the post-accession period that cannot be accounted for by the standard determinants. That increase is 5 times larger for Spain. Given our interest in the role of investment and entry we also go beyond the standard gravity estimation and use the (ln) number of firms as a dependent variable.27 Those results, in the second column of Table 1, show that the pattern in the previous graphs cannot be explained by aggregate income, exchange rate or price indices: the number of firms exporting to Spain and the EC-10 was significantly higher than to other countries after accession. While our objective in this section is not to determine the channel by which accession worked, we can nonetheless argue against two potentially important alternatives: monetary integration and infrastructure investments. It is unlikely that the estimated accession effect is due to exchange rate effects or the prospect of a monetary union for two reasons. First, the sample we use ends in 1990–two years before the signing of the Maastricht Treaty setting out the timetable for the Euro and nine years before the national exchange rates were irrevocably fixed. Second, if accession affected exchange rates then these effects are controlled for by including its level (as we do in the baseline results) and its volatility, which we also did and found did not affect the accession coefficients.28 Portugal received substantial EC support for transport infrastructure. But this funding only started in 1989 so it could at most have started to reduce trade costs in 1990 and thus can’t explain the large trade increases before then.29 2 6 The use of bilateral fixed effects as a way to address PTA endogeneity is argued by Baier and Bergstrand (2007). In our setting these reduce to importer fixed effects since the only exporter in the data is Portugal. 2 7 Our model will provide a formal justification for using this dependent variable in a gravity regression. Bernard et al. (2007) present similar type specifications for the U.S. 2 8 These results are available on request. The estimated trade elasticities to volatility is negative but quantitatively inconsequential. For a recent review of the academic literature see IMF (2004). The measure we use is the one the report cites as the preferred one: log(standard deviation of monthly exchange rate changes). 2 9 Pereira and Andraz (2005) report that public investment in transport infrastructure was identical (as a share of GDP) in 1981-85 and 1986-1988 (1.3%) and increased only after EC funds started: to 1.8% on average between 1989-93 and 2.2% in 1994-98.
14
We conclude by discussing more specific findings; some of these guide our subsequent modelling assumptions and others are consistent with the predictions resulting from that model. First, we note that the typical new exporter to a given market (defined as a firm exporting to a country at but not − 1) is smaller than a continuing firm (about 6 times smaller for Spain and 20 times for the EC-10). This is one reason why we focus on a model of heterogenous firms with fixed costs of entry. Moreover, this size heterogeneity implies that if accession had increased the number of entrants but not the average sales of continuing firms then we should observe a reduction in average sales per firm as we find for the EC-10 in column 3 of Table 1. These effects are consistent with a model, such as the one we develop, where reductions in policy uncertainty increase entry but have little effect on the current sales of existing firms provided that applied policy does not change much, as was the case with EC-10.30 One of the central objectives of the paper is to determine the relative importance of applied vs. expected policy on the number of firms in a market. Analyzing this issue is particularly interesting if policy changes have large effects on the number of firms and this translates into significant new investment and aggregate exports. As the results in column 2 show the accession lead to a large additional number of firms. Moreover, in the appendix we find evidence that this increase mainly reflects new entrants (as opposed to fewer exits) and thus is likely to have required considerable entry investments. It would be simple to see that new entrants also generated considerable export growth if we knew accession had not affected the exports of continuing firms. In that case column 1 of Table 1 would reflect only entrants’ exports but otherwise that is an upper bound on the role of entrants on aggregate exports. In the appendix, we provide evidence that even though entrants are smaller they had a significant impact on aggregate exports. First, the raw data shows that entrants (those that did not export just before the agreement was implemented but did so shortly thereafter) account for a substantial share of export growth between 1986 and 1990 (over 54% for Spain and 73% for the EC). Second, we employ a gravity approach to predict the effect of accession for different subsets of firms and find that about 30% of the predicted increase in exports is accounted for by new firms. In sum, there is strong evidence of an increase in the number of Portuguese firms and aggregate exports towards EC-10 and Spain following accession that can’t be explained by standard determinants. Given that Portuguese exporters already enjoyed some trade preferences in Spain and zero tariffs in the EC-10 (on manufacturing) these impacts of accession seem puzzling. The model in the next section provides a potential explanation — the agreement removed policy uncertainty faced by exporters — and shows how to test it. 3 0 Average exports by firm to Spain remained unchanged but this is still consistent with the model since Spanish applied protection fell, thus increasing average sales of continuing firms.
15
4
Theory
We now model the impact of policy uncertainty on firms’l investment and export entry decisions. First, we determine the optimal demand, supply, pricing and profits for each firm conditional on exporting. Second, we examine its decision to invest to enter that market and how it is affected by policy uncertainty.
4.1
Demand, Supply and Pricing
The utility function of the representative consumer, = 01− , is identical across countries and defined over a numeraire good, denoted by 0, which is homogenous and freely traded on world markets, and a subutility index, , defined over differentiated goods with constant expenditure share . We consider a CES aggregator over a continuum of differentiated goods, indexed by , from the set Ω of available goods For simplicity of exposition we focus on a symmetric structure with common elasticity of substitution, = 1 (1 − ) 1.31 =
∙Z
∈Ω
¸1
(1)
Each country has aggregate income equal to and consumers in face prices so their optimal demand for each , , is standard and given by
=
where =
hR
∈Ω
( )1−
i1(1−)
µ
¶−
(2)
is the CES price index. The consumer price, , includes any existing
trade costs. We focus on ad valorem import tariffs and note that they are generally not firm specific but rather product or industry specific, and denote the tariff factor that sets on the group of products by ≥ 1 , so free trade is represented by = 1. Therefore, producers of any ∈ receive where will be unity if the good is produced and sold in (i.e. we assume no domestic sales taxes). We first determine the optimal price and operating profits for each monopolistically competitive firm conditional on supplying a market. The marginal cost parameter, , is constant and heterogenous across firms. We can interpret 1 as either labor productivity or the productivity of an input bundle, so given a wage, , in the exporting country , the firms’ marginal cost is . Since our analysis focuses on firms 3 1 We can show that most theoretical and empirical results can be easily extended to a multi-sector structure that allows for different elasticities of substitution within each sector and across sectors. For example, could instead be a Cobb-Douglas aggregator across sectors, each representing a distinct CES aggregate, as we consider in the empirical robustness section.
16
in a particular exporting country we drop the “” subscript. In a deterministic setting the firm simply chooses prices (or quantities) to maximize operating profits in each period, = ( − ) , leading to the standard mark-up rule over cost, = , and the consumer faces this price augmented by any import tariff in that industry.
= ( )
(3)
Under uncertainty we need to be clear about the timing of the firm’s production and pricing decisions. We allow the firm to make all its production and pricing decisions after the policy and thus demand are known, so only its investment decision will be made under uncertainty.32 This production flexibility has two basic implications. First, the pricing decision is exactly the same as above. Second, we are making the firms less averse to policy risk, e.g. to variability in tariffs, after they enter the market since they can optimally adjust to shocks and their operating profits are convex in the policy. To clearly see the last point we substitute the optimal price into demand to calculate revenue received by the producer
1−
( ) = ( )− 1−
(4)
We can see that, all else equal, the export values for a firm that has entered a market are directly affected only by the current applied policy–there is no direct effect of uncertainty. This occurs because production occurs after the uncertainty is resolved. Therefore the direct impact of uncertainty on individual firms in our model will arise via the investment/entry margin rather than the intensive margin.33 Substituting revenues into the operating profit expression and simplifying we obtain
= ( )− 1−
(5)
where ≡ (1 − ) ( )1− , summarizes aggregate conditions, e.g. domestic wage, , and foreign 3 2 If we were focusing on uncertainty surrounding a variable with high frequency variation it may be reasonable to consider production, and possibly pricing, decisions undertaken prior to the realization of the state of foreign demand. But since we are focusing on trade policy, which changes at low frequency, we don’t think that is the most relevant friction to focus on in analyzing the impact of uncertainty. 3 3 In practice, a reduction in uncertainty could affect the intensive margin if it triggered technology upgrading for example. In related work we show how to incorporate this effect without qualitatively affecting the market entry investment decisions that we focus on here. Uncertainty can also affect the intensive margin indirectly if the resulting change in the number of exporting firms is sufficiently large to affect the price index. In the empirical application we consider the exporter is small so this effect is negligible (and addressed econometrically), therefore we also abstract from this indirect effect in the model.
17
demand.34 In general, we can allow for stochastic innovations to that are independent of innovations to tariffs. We control for such dynamics in the empirical section, but we do not model them here.
4.2
Firm Value, Investment and Export Entry Setup
We focus on how foreign TPU affects the decision to enter export markets. Therefore, we assume there are no fixed costs to enter or produce in the domestic market (as in Helpman et al., 2008). As such, for each industry there exists a mass of firms in the exporting country equal to ; all of which produce for their home market but only a subset of them, to be determined, will export to any given market.35 As we noted above, these firms are heterogeneous only in terms of their productivity, which has a cumulative distribution function (1) that is strictly increasing. To serve a foreign market a firm must first make a fixed cost investment that is sunk. As noted in section 2 there is evidence that these investments can be large when it comes to serving foreign markets. To understand the basic effect of these costs consider first a deterministic environment where profits are constant. A firm considering entering a new export market invests and enters if the present discounted value of its profits exceeds the investment cost of entry , ≥ 1−
(6)
We allow this investment to be destination market and possibly industry-specific in that firms producing ∈ all face the same cost, but this cost may differ for another industry. In a purely deterministic environment, the discount factor reflects only the “true” discount rate , but it is straightforward to show that the expression above also applies when operating profits are constant but there is an exogenous “exit” probability, , in which case = (1 − )(1 + ). This defines a zero profit cutoff for unit costs as a function of the tariff, ( ) for firms considering exporting product ∈ to country ( ) =
∙
( )− (1 − )
¸1(−1)
(7)
3 4 We are ignoring exchange rates but these can be incorporated and would simply entail redefining to include a multiplicative effect . Since this variable does not vary across product it will not have a first order effect in our empirical results and thus we do not include it here. Future work may consider interactions in uncertainty processes between tariffs and exchange rates and try to estimate those second order effects. 3 5 This simplification does not affect our basic empirical results since, as we will see, our identification approach controls for industry-time effects and thus accounts for domestic entry into any particular industry.
18
Clearly tariff reductions induce entry since they increase demand and thus allow the fixed cost investment to be covered even by firms that are less productive. The elasticity of the cutoff to a once-and-for-all change . It is also clear that the cutoff is common to all firms that face a similar tariff in is ln ln = − −1
and fixed cost, so for ∈ all firms with ( ) enter. The marginal entrant is the least productive and thus smallest, which is consistent with the finding that new exporters are smaller than incumbents.36 As we discuss in section 3 there are several potential sources of TPU that exporters face. Moreover, potential exporters can optimally choose not just whether to invest but when to do so. Therefore ongoing policy uncertainty generates an option value of waiting, which can have important effects for investment. The analysis below applies for each firm in an export country that is considering the decision to invest to enter in market and sell some good so we drop these subscripts for simplicity. Formally, the firm’s decision to enter an export market is modeled as an optimal stopping problem.37 Firms can be divided into exporters and non-exporters. The value of being an exporter is denoted by Π and such a firm exits only when hit by a “death” shock since it has no other fixed costs after it enters.38 Nonexporters enter a foreign market only when the value of exporting net of the sunk entry costs, , exceeds the option value of waiting, Π . The value of this option in our model arises because in the following period conditions may improve and so the firm may be better off waiting until that occurs and then entering. The investment and entry decision rule for each firm, identified by its unit cost requirement , can be defined as a function of a threshold tariff ¯ that makes it indifferent between entry and waiting.
) − = Π (¯ ) Π (¯
(8)
So, any tariff ≤ ¯ () triggers entry by any firm with cost . To determine this export cutoff and the impact of policy uncertainty we now describe the policy process and define these value functions. Trade policy is affected by several factors: economic, political, unilateral, bilateral, etc. From the perspective of most individual firms, TPU in foreign markets may be taken as given.39 Therefore we do 3 6 The cutoff elasticity with respect to tariffs exceeds unity because the tariff is not paid by the exporter, so profit increases more rapidly in the tariff than in the cost, as seen in (5). 3 7 Formally, our approach is similar to Baldwin and Krugman (1989) with some key differences. First, we focus on trade policy, which as we describe below has a different stochastic process and is more permanent than exchange rates. Second, they focus on homogenous firms whereas we incorporate firm heterogeneity, which allows us to analyze the effect of policy uncertainty both between and within industries that already have some export participation. 3 8 While the assumption of no per period fixed costs of exporting may seem extreme, Das et al. (2007) find these per period fixed costs are negligible, on average, across all sectors analyzed in their structural model of Colombian exporters. 3 9 An interesting topic for future research is to examine endogenous choice of uncertainty levels by countries and the role of industry lobbies.
19
not explicitly model the source of these shocks but simply posit that they can arise due to changes in political pressure by interest groups, by the initiation, conclusion or breakdown of trade agreements, by macroeconomic shocks, etc. So trade policy is summarized by a random variable with two components: the timing of policy changes and the magnitude of those changes when they arrive. More specifically, we model policy shocks as a Poisson process with arrival rate .40 We will generally think of these as aggregate shocks (e.g. a new agreement, arrival of a new government with different policy preferences, etc.). When a shock arrives, a policy maker reconsiders the current policy and sets a new one denoted 0 . Even though the outcome of policy changes is unknown ex-ante, firms can form expectations over future policies. We assume they do so based on their belief of and a probability measure of tariff outcomes, ( 0 ), with support 0 ∈ [1 ] , where is the worst case scenario. We assume that both and are similar across firms in a given industry so that entry decisions will depend only on a firms’ productivity relative to a cutoff rather than informational asymmetries. In general we can allow to differ across industries in order to captures the possibility that after a shock, e.g. a trade agreement, some products will be expected to experience larger policy changes than others. This process implies a “long-run” mean policy, which in the limit is solely determined by the mean of the distribution ( 0 ). Therefore a government that announces a current policy equal to will not have any impact on the long-run expected policy unless they can also convince the producers that either (i) this policy is now permanent, i.e. that = 0, or (ii) that the underlying distribution of all future policies, , has somehow changed. We show the resulting lack of credibility, captured by , lowers the value of current tariff reductions and thus their effectiveness in generating investment in foreign markets. Therefore our goal is to contrast the effect of changes in current policies at different with the effect of changing itself where we will argue that certain agreements work precisely because they successfully reduce the current tariff and make that reduction credible, i.e. they also lower or eliminate . Since captures the probability that current policy will change we will simply refer to it as policy uncertainty.41 4 0 Similar Poisson arrival processes for policy shocks are used by Rodrik (1991), Aizenman and Marion (1993) and Hassett and Metcalf (1999). 4 1 Technically, 1 − captures the degree of persistence of tariff policy but clearly also affects short term policy variance, e.g. if = 0 the variance is zero and if the current policy is at the long-run mean then (+1 ) = ( 0 ).
20
4.3
Value of Credible vs. “Incredible” Policies
The prospective exporter’s decision to enter or wait given the current trade policy depends on a set of value functions, which we now derive. We then solve for the equilibrium value of exporting to examine the value of credible vs. “incredible” (i.e. non-credible) policy changes. Since the value functions apply for each firm with cost subscript , we omit this to simplify the notation. The expected value of starting to export at time conditional on having observed is
Π ( ) = ( ) + [(1 − )Π ( ) + E Π ( 0 )] {z } | {z } | No Shock
(9)
Shock
which includes current operating profits upon entering and the discounted future value. With probability 1 − , there is no policy shock and the firm value next period is still Π ( ). With probability , a policy shock arrives changing the policy to some value, 0 , and so the third term is the ex-ante expected value of exporting following a shock, which is given by
E Π ( 0 ) = E ( 0 ) + E Π ( 0 )
(10)
Note that E Π ( 0 ) = E( 0 ) (1 − ), which is time invariant and simplifies the analysis.42 Note however that the conditional mean of the tariff and value of exporting, Π ( ) , still vary over time since they depend on the current tariff. We then compute the value of waiting as
))Π ( ) + (¯ )(E Π ( 0 | 0 ≤ ¯) − )] Π ( ) = 0 + [(1 − )Π ( ) + (1 − (¯ {z } | {z } | {z } | No Shock
Shock Ab ove Trigger
(11)
Shock Below Trigger
A non-exporter at time receives zero profits from it today. In the following period the continuation value is still Π ( ) if no policy shock arrives (the first term) or if the shock still entails a tariff above the trigger (the second term). If a policy shock arrives, it will be below ¯ with probability (¯ ) and the firm will find it optimal to pay and transition to the exporting state. The conditional expected value of exporting if 4 2 The reason is simple: the distribution of future tariffs, ( 0 ), is time invariant so even if there is a new tariff at + 1 this provides no additional information at time about future tariffs.
21
≤ ¯ in the last term is given by E Π ( 0 | 0 ≤ ¯) = E ( 0 | 0 ≤ ¯) + [(1 − )E Π ( 0 | 0 ≤ ¯) + E Π ( 0 )]
(12)
This equation is structurally the same as (9). The key difference is that profit flows are evaluated ex-ante at the conditional expected value of exporting for a firm that enters following a more favorable policy shock. The set of four equations (9), (10), (11) and (12) is linear in four unknowns: Π ( ), E Π ( 0 ), Π ( ) and E Π ( 0 | 0 ≤ ¯). Thus we can solve explicitly for the value exporting and waiting at the current tariff for a firm that has a threshold tariff ¯(). We still omit from () for notational simplicity.43 ( ) E( 0 ) + 1 − (1 − ) 1 − 1 − (1 − ) ½ ¾ E( 0 | 0 ≤ ¯()) (¯ ()) E( 0 ) + − if ¯() Π () = 1 − (1 − (¯ )) 1 − (1 − ) 1 − 1 − (1 − )
Π ( ) =
(13) (14)
The interpretation of Π ( ) is straightforward: after investment, the value of exporting conditional on equals the discounted value of expected profits. If were zero this would be the deterministic value ( ) (1 − ). But with a probability 0 the policy will change and the ensuing per period expected profits are E( 0 ). If the current tariff is above a given firm’s trigger, ¯(), then it does not export today and its value, Π (), would be zero if the tariff remained above that trigger, but with some probability (¯ ) the tariff will fall below the trigger and so the firm will incur and export. The expected value of exporting is then captured by the remaining terms in curly brackets, which are similar to those in Π except ) instead of ( ). we must use E( 0 | 0 ≤¯ We can now ask what is the value for an exporter of alternative policy changes. Consider first a situation where governments announce that the current tariff is being reduced. We will call this a credible policy change or agreement if the exporters expect it to remain in place, i.e. if = 0. We will call it an “incredible” agreement otherwise, i.e. if it is expected to be revised with probability 0. The first basic point is that the credible agreement is more valuable for the exporter since the tariff reduction is permanent, that is
− 4 3 The
( ) ( ) − =− Π ( = 0) = − Π ( 0) 1 − 1 − (1 − )
expression for EΠ ( 0 | 0 ≤ ¯) is given in the appendix.
22
(15)
This complementarity between reductions in current tariffs and uncertainty suggests one reason why some PTAs may not succeed in expanding trade by much: they reduce only applied tariffs but not uncertainty. In the empirical section we will quantify this effect and show its potential importance. The second point, which is related to the first, is that even if the initial agreement is “incredible” so 0, and it has been in place for some time there may still be considerable value to making it credible, i.e. of having = 0. In these cases the primary impact of a formal agreement may simply be to eliminate uncertainty. When the tariff in the initially incredible agreement is low, e.g. if = 1, the reduction of uncertainty increases the value of exporting as shown by this expression
Π ( = 1 = 0) − Π ( = 1 0) =
(1) − E( 0 ) 0 1− 1 − (1 − )
(16)
This expression captures the value of moving from free trade regime of unknown duration to permanent free trade by lowering the expected future level of tariffs. This provides one motive why the recipients of unilateral preferential tariffs spend considerable resources in attempting to make them permanent through formal PTAs. Examples include GSP preferences provided by most developed countries as well as European and US special preferences to developing countries. Since the EC-10 and Spain’s preferences toward Portugal prior to 1986 were uncertain, this change in value captures one of the important channels by which entry into the EC benefited Portuguese exporters. To determine if uncertainty reduction was an important factor we now examine the predictions of the model for investment and entry into foreign markets, which we will then estimate.
4.4
Policy Impacts on Investment and Entry
Using (14), (13) and the expression in (8) we can determine the threshold tariff that would leave any given firm with costs indifferent between starting to export or waiting. From an empirical perspective it will be more useful to recast this in a different way and ask what firms will invest and enter at any given current tariff. We have assumed that firms can be ranked by their productivity (the inverse of unit costs 1) according to a strictly increasing CDF. Therefore, for any current tariff , we can determine a cutoff cost ¡ ¢ = . ¯ that satisfies A firm with costs equal to is indifferent between investing today and starting to export or waiting.
As will be clear that will also be true this period for all firms with lower costs if they had not yet started 23
to export. The model has a closed form expression for in terms of the current tariff. First, we set the difference between Π and Π equal to entry costs and by simplifying the terms we obtain
=
( )[( ( E( ) ) ) − E( | ≤ )] + + 1 − (1 − ) 1 − 1 − (1 − ) 1 − 1 − (1 − )
(17)
Entry requires that the fixed cost does not exceed the sum of the three terms on the RHS, each of which has an intuitive explanation for the marginal entrant. The first term is the discounted flow of profits at the current tariff. We note that in a deterministic model, the firm would discount by rather than (1 − ) and the next two terms would disappear. The second term is the present value of expected profits, ex-ante, following a shock. The third term is non-positive: it is the present value of the expected loss of entering today, given that the next policy change is at or below the tariff entry trigger. We combine the expression in (17) with the operating profit function in (5) to solve directly for as a function of the current tariff. The full expression is in the appendix, after some simplification we obtain
∙
1 − + ( ) = 1 − + | {z =
1 ∙ ¸ −1
− (1 − ) }| {z =
1 ¸ −1
(18)
}
Note that the deterministic model cutoff, , is a special case which obtains here if = 0. Otherwise, the cutoff condition also depends on the uncertainty term, denoted by , which captures the frequency of policy shock arrivals and expectations about future tariffs. We can show that uncertainty in this model generates a lower cutoff, requiring firms to be more efficient to enter, than a deterministic tariff at the level . To do so note that we must have ≤ 1, which requires that ( ) ≤ 1, as is clear from the equation above. In the appendix we derive this term as
( ) − 1 = − (1 − ( ))
− − E( − | ≥ ) ≤0 −
(19)
This is the proportional reduction in operating profits expected to occur if we start at the trigger tariff and a policy shock occurs that (with probability 1 − ( )) worsens conditions by generating a tariff above that trigger level. This inequality is always strict except when the trigger is exactly at the maximum of the tariff distribution in which case the cutoff is the same as the deterministic. Note also that even though the policy shock can trigger a lower or higher tariff, it is only the latter possibility that affects the decision.44 4 4 This
is an example of the “bad news” principle first identified by Bernanke (1983) and is due to the fact that good news
24
In sum, the model predicts that policy uncertainty increases the hurdle for firms to invest and enter into new markets relative to the deterministic case. This occurs despite the convexity of operating profits in tariffs. This result along with the fact that at = 0 we obtain the deterministic cutoff implies that increases in uncertainty lower the cutoff under the option approach at any initial tariff below the maximum. It is also interesting to note how our model can encompass alternative policy regimes. When ∈ (0 1) the model represents a regime of imperfectly anticipated shocks of uncertain magnitude. If instead = 1 and is degenerate at some 0 then it captures a perfectly anticipated reform where the government credibly commits to 0 in the following period. When = 0 the government has committed to the current tariff, . Perhaps less obviously, the model can also capture staged tariff reductions that are typical in agreements, provided that there is uncertainty about their implementation.45 The closed form solution for the cutoff provides other useful insights that we explore in the empirical work. First, we can derive an uncertainty entry cost premium, , which we define as the minimum entry subsidy rate required for the marginal firm under deterministic policy to enter under uncertainty. Formally, this is given by the subsidy rate on fixed costs such that ( 0 (1 − ) ) = ( = 0 ). Using
(18) we obtain = 1 − −1 . Note that if the same rate, , is offered to all firms that had not exported under uncertainty then we obtain the same distribution as under certainty or under a case when tariffs are credibly expected not to rise so ( ) = 1. Since is a summary statistic for the impact of uncertainty on entry that requires no firm specific information on productivity we will provide an estimate for it. We also use (18) to derive the estimation equation. As an intermediate step it is useful to record the semi-elasticity of the cutoff with respect to ln 1− ( ) − 1 | = ≤0 1 − (1 − ) 1 − (1 − ( )) − 1 which is negative given ( ) ≤ 1 . Consider now the impact of applied tariffs on the cutoff. In the absence of uncertainty that elasticity is simply − −1 , as shown for the deterministic case. It is simple to see that is also the limit value for
has a symmetric effect on payoffs whether the firm is already in or not (since it can enter after the shock) whereas bad news will only affect those that are already in. 4 5 For example, suppose an agreement is signed that sets a tariff 1 for today and promises a reduction to 0 in the following period. If exporters believe that the staged reduction will happen in the following period with some probability less than one then the entry prediction above will apply. Moreover, if the current stage is credible (so is believed to be the maximum) then at we have ( ) = = 1 so exporter entry will behave as if is permanent. This implies that when staged reductions are not fully credible the full impact of the agreement on entry will only take place if and when the full implementation is realized and credible.
25
ln ln |→0 .
Since most work, theoretical and empirical ignores the uncertainty component we will take that
as our null hypothesis, = 0, and test if this uncertainty parameter has any first order effects . To do so we employ a first order, log linear Taylor approximation to ( ) around = 0 and the original applied policy values (0 ). We provide the derivation in the appendix. The general form for any period is
ln( ) | =0 =0 =
1 (0 ) − 1 − ln + ln + 1− −1 −1 − 1 (1 − )
(20)
where captures second and higher order terms of the approximation. This shows that increasing uncertainty has a first order effect and reduces the cutoff even if we are initially at = 0 (i.e. in the deterministic case). This is true for any trigger value of the tariff and strictly so if that trigger is below the maximum tariff. It also holds for cases when the current applied tariffs are zero, which stresses the point that even firms that currently, and possibly for some time, have faced zero tariffs may not enter if there is some chance that policy will be reversed in the future. We also see that increasing applied tariffs around = 0 changes , the deterministic elasticity.46 the cutoff by − −1
In sum, we have shown that one potential benefit of an agreement with a country that already applies low policy barriers is to remove uncertainty about those policies. We have also shown that such an agreement will generate entry and identified one potential way to measure the degree of that uncertainty, (0 ) − 1. The final point that we note is that even though the real option approach we employ is somewhat more complicated than the standard net present value (NPV) calculation (which only allows firms to make a once and for all entry decision) it has two distinct advantages. First, the real option approach clearly captures the behavior of firm investment more closely since they have the option to wait and time their investments. Second, some qualitative and quantitative results are different under the two approaches, as we describe in the appendix. 4 6 While the applied tariff effect around no uncertainty is similar to the deterministic case, it will be attenuated by the presence of uncertainty. We provide the exact expression in the appendix, but the intuition should be clear from equation (15) in the last section: a reduction in current tariffs will not lead to as much entry if it may be reversed in the future. This implies that in the presence of considerable uncertainty, e.g. prior to an agreement, the estimated coefficient on the applied tariff in the equation above will be biased towards zero. In the empirical section we estimate this tariff attenuation effect and the complementarity between applied tariffs and uncertainty reduction on entry decisions.
26
5
Evidence
We now use the theoretical framework to address two questions. What are the first order effects of current policy and uncertainty on firm entry into exporting? Do trade agreements reduce uncertainty? We will address these in the context of Portugal’s accession to the EC in 1986, which, as we argued in section 3.2, secured pre-existing preferences in some goods and lowered tariffs faced by Portuguese exporters in others. We first describe how to compute a theory-based measure of uncertainty related to the lost profit term, ( ); and how to relate the unobserved cost cutoff to observables, namely firm export decisions. We then describe the data and implementation, the baseline estimates for entry, and their quantification. The baseline estimates follow the model closely and so are parsimonious, so we also provide some robustness tests. The final section goes beyond entry and examines the implications for export values.
5.1 5.1.1
Empirical Approach Measuring policy uncertainty
To construct ( ) we require a specific tariff probability distribution . We employ a discrete distribution that is tractable and covers the main cases that are present in our data. After a policy shock exporters consider three potential tariff values, ow , edium or igh.
= , Pr( ) = for each ∈ { } We take =1 so it captures the industrial goods that Portugal exported to the EC free of ad valorem tariffs both after the accession and before it. The high tariff, , captures the EC rate that is applied to GATT/WTO members that did not receive any preferences. This may somewhat underestimate the degree of uncertainty in these goods but seems a reasonable approximation of what the Portuguese exporters may have feared as the worst case scenario. The medium tariff, , represents an intermediate level; it captures the possibility of transitional preferences that were mostly a feature of Spanish policy towards Portugal prior to the agreement. It is important to stress that the latter were transitional and could not remain for long since they were not GATT legal, as we discuss in section 3.2.1. Therefore although we did observe "medium" tariffs during the mid 80’s, the Portuguese exporters likely placed a probability close to zero ( ≈ 0) that these would remain since either an agreement would be signed and tariffs would transition to the low state
27
or negotiations would fail and no preferences would remain. In the appendix we show that if the tariff was initially high or medium then we can use (19) to derive
( ) − 1 = − [1 − ( ) ]
(21)
The term in square brackets is the percentage profit reduction conditional on a shock that moves tariffs from to the worst case scenario, , which happens with probability . The same term applies to cases when the initial tariff is low and is negligible.47 Alternatively, if we consider only a two state world, = , the expression above applies to tariffs with either history. Note that the tariffs are different across markets and industries. Moreover, the applied tariff may change over time but the worst case tariff, , is constant in the data over the short period of time we analyze. With information on these tariffs and an elasticity assumption (which we describe below) we can construct industry and time varying measures of this profit reduction measure. We cannot observe the probabilities that exporters place on a worst case scenario, . However, we can estimate this as part of the entry equation, provided we assume it is roughly common across industries and countries, i.e. we can estimate . The similarity across countries in our application is more reasonable if we restrict our attention to =Spain, EC-10, which are the markets that Portugal secured access to. Note that we do allow for the worst case scenario probability, , to vary over time. In fact one of the key predictions that we test is whether the agreement lowered or even eliminated this probability.
5.1.2
Unobserved cutoffs and firm export entry
While we do not directly observe whether firms have costs above or below the cutoff we do observe the number of firms and their export status at the country-product level. Our model focuses on variation in policies over time and across products and the cutoffs we derived are common across some sets of firms. In particular, producers of a variety exporting to will all face a tariff that does not discriminate by firms, but rather by product or industry classification, denoted , and so those producers also face the same critical cutoff . Therefore we examine the fraction of exporters in an “industry” to each country pair. This approach has another advantage: it does not require us to be able to follow specific firms over time, which 4 7 In the appendix we show that if were large then there would be an additional term where the high probability and tariff are replaced by the medium ones. We ignore this extra term since, (a) there is no obvious empirical counterpart for the medium probability term, (b) it would be highly correlated with the high value, and (c) we have good reasons to believe ≈ 0 given these were transitional tariffs that could not be sustained under GATT rules.
28
is important since we are unable to do this between 1985 and 1986. The number of firms (or varieties if the firm exports more than one product) exporting in to market is at least equal to the mass of domestic producers in , , times the fraction of those firms with costs below the cutoff, ( ). Therefore the relationship between the observed number of firms, , and these theoretical measures is ln = ln ( ) + ln +
(22)
where is a random disturbance term due to measurement error. The term can also capture the potential for “legacy” firms: those that survive until period even though they have costs above . This cannot occur if current conditions are better than in the past, so a sufficient condition to rule out legacy firms is that ≥ max{ ∀ }. In this case, ( ) exactly captures the fraction of exporters to this
market. In the case of Portugal in the mid-80’s exporting conditions were improving, as is clear from the observed high entry rates into EC countries. Therefore, we do not think legacy firms pose a significant issue in this particular setting. Nonetheless, in the appendix we argue that our approach and results are robust to certain instances where legacy firms are present. ¢ ¡ . If the productivity follows a Pareto distribution with minimum productivity 1 then () =
So entry has a constant elasticity with respect to the cutoff, the shape parameter , which we assume is similar across industries.
5.1.3
Baseline model
Our basic estimation equation can then be obtained by substituting ( ) in (21) into the cutoff expression (20); and then substitute this into the share equation in (22) and use the Pareto distribution to obtain for each ¸ ∙ 1 − ( ) − ln ln = − 1− −1 −1 ∙ ¸ 1 + ln + − ln + ln + − 1 (1 − )
(23)
We recall the the three assumptions in the baseline estimation to identify the effect of uncertainty: (i) the probability of reversal to a high tariff is common across industries, and countries, (but firms have market and industry specific information about the impact of that worst case scenario on profits); (ii) the
29
shape parameter is constant over time and common across (but the other parameter may vary); (iii) the elasticities of substitution are constant over time and similar across sectors. In the robustness section we will discuss the impact of relaxing some of these assumptions. Given these assumptions we can write the estimation equation in terms of parameters and observable variables as follows
˜ + ln + + + + ˜ ln =
where ˜ ≡
1−( ) −1
for each
(24)
captures the uncertainty measure and its impact on entry is estimated by
= − (1 − ). The coefficient on the applied tariff is = − ( − 1). The terms represent country-year, country-industry and industry-time effects that absorb among other things, the demand and cost conditions in , the investment cost (and any time invariant costs of exporting, e.g. transport or other non-tariff barriers, that we abstracted from in the theory), the productivity distribution heterogeneity across industries as well as other terms that vary at the “” level and were previously included in the remainder term, , and in . The remaining part of the disturbance that varies at the level are included in ˜ . We estimate (24) in differences taking a period after the agreement was implemented, = 1, and one before it, = 0.
˜ 1 − 0 ˜ 0 + ∆ ln + + + ˜ for each ∆ ln = 1
(25)
We are interested in testing if there was more entry in industries with higher initial uncertainty, −0 0, and whether the agreement reduced the probability of a worst case scenario (−0 −1 ), or even eliminated it (1 = 0). If uncertainty played a significant role we will then quantify it. To identify these effects it is important that, even in the change equation, we control for importer effects, which absorb any shocks specific to those markets. We also control for industry effects to capture any productivity, regulation or other industry shocks that had a common effect on firm entry to both EC-10 and Spain, the most obvious being Portugal’s own trade liberalization. Therefore the identification will rely on differential tariffs and uncertainty that Portuguese exporters within each industry faced in the EC vs. the Spanish market.
30
5.2
Data and Implementation
To estimate (25) we collect detailed data on trade policy for Spain and the original EC-10 countries before and after the agreement, as described in more detail in the data Appendix. So the uncertainty measure varies not only across industries but also across members of the agreement. For some industries the policy data are recorded at a fine level of disaggregation, so they could potentially be matched to 6-digit NIMEXE classifications for the trade data, which includes over 5000 products (NIMEXE is the predecessor of the Harmonized System). We do not test the model at this disaggregated level for a few reasons. First, the model suggests that we define industries according to a set of characteristics (such as productivity distribution) that is common across a set of firms and clearly broader than the 6-digit level. Second, most of the variation in the policy occurs across industries, rather than within them at the product level. About 80% of the variation in applied tariffs and 75% of variation in the uncertainty measure in exporting to the EC-10 before the agreement are accounted for by differences across 2-digit industries (of which there are 99). Those fractions are lower for Spain but still more than half of the variation is accounted for by cross-industry differences. Third, even in 2-digit industries where there is some variation in tariffs, an exporter’s perception of the worst case scenario is likely to be broader than what is implied by the worst case for a single 6-digit good since he may either export multiple goods and/or fear tariff changes simply because they are reclassified.48 To construct the uncertainty measure we first take for a product to be the ad valorem conventional GATT tariff that country (EC-10 or Spain) had before the agreement.49 We take 0 to be the tariff that actually applied to Portuguese exports in that product before the agreement, where we employ data on the set of preferences that these countries provided to Portugal, as described in section 3.2.1. We then construct the uncertainty measure in (21) using elasticity values that are consistent with the data for these countries ( = 3). In the robustness section we provide supporting evidence for this choice of elasticity and show the results are robust to alternative values. We then aggregate this measure and the applied tariff to the 2-digit industry level using a simple average. The tariffs that Portuguese firms exporting to Spain faced in the years 1985 and 1987 appear in Table 2. The average industry in Portugal enjoyed preferential tariffs that were nearly 50% below the tariff levied on the rest of the world. Moreover, we find that this difference is not driven by any one set of goods or industries. Using the measure of profits lost previously derived we calculate that if Portugal were to lose 4 8 If we were to run the model at the 6-digit level there would be a large number of zeroes. Since our estimation equation is in logs we would eventually have to drop those categories, which could be where uncertainty was most important. 4 9 If that tariff was not bound in the GATT then we use the autonomous ad valorem tariff that applied.
31
these preferences, the typical exporter would see his profits reduced by over 16% per annum. Note also that despite the preferences, Portugal did not enjoy duty-free access to Spain prior to the agreement, it faced tariffs of almost 8% on average. Therefore there is scope for gains from applied tariff reduction, uncertainty reduction and the complementarity effect between the two, which we described in the theory. With respect to the EC-10, the table shows Portugal enjoyed lower preferential tariffs by 1985 but the proportional loss in profits was nearly as high as in Spain at 15%. The magnitude of EC tariff reductions in 1987 is small since tariffs in industrial products were already zero prior to accession.
5.3
Baseline Estimates
Table 3 provides estimates of the parameters in (25). We find that entry is negatively affected by applied tariffs, as predicted by the theory. Moreover, the coefficient on initial uncertainty, −0 , is positive, implying that entry was strongest in the industries that initially faced higher uncertainty.50 One potential concern with the results in column 1 would arise if ad valorem tariffs were only one part of the protection faced by Portuguese exporters that changed. If protection that used other instruments fell by more in industries with higher uncertainty this would bias our estimates. Therefore we control for changes in “non-tariff barriers” and specific tariffs in columns 3 and 4 respectively.51 Both have the predicted negative sign but they are insignificant. Neither affects the baseline results for uncertainty and applied ad valorem tariffs. The results are also robust to including other policy measures (in columns 5 and 6), which we discuss in detail in the robustness section, either individually, or in combination. The results discussed thus far exclude any uncertainty measure for the period after the agreement. This reflects an implicit assumption that the coefficient on that variable is insignificant, i.e. that the agreement was credible and eliminated the preference reversal, 1 = 0. We test this hypothesis directly in column 2 by including the potential profit loss term evaluated at the post agreement tariffs, ˜ 1 . We find that this variable has no significant effect, i.e. we can’t reject that 1 1 = 0, nor can we reject that the probability of a reversal has fallen, i.e. 1 1 0 0 . This insignificance of uncertainty after the agreement and the 5 0 Note that the policy measures vary across industry and for Spain vs. the EC-10 but not within industry across the EC-10. Therefore we compute clustered standard errors that allow for arbitrary correlation across EC-10 countries within each industry, and similarly for Spain. 5 1 To construct these measures we use information in the tariff schedules on whether a product line was subject to specific tariffs, special import authorization or other conditions that were not translated into an advalorem tariff. As is standard in this type of literature we construct a coverage ratio measure: fraction of products in industry that are subject to a particular measure (e.g. specific tariff, or other NTB) and took the difference before and after the agreement. The adjustments to NTBs immediately after accession were primarily removals of barriers by Spain and Portugal to harmonize with the EC-10 in order to comply with GATT provisions not to discriminate against non-member goods. Thus we only coded those changes for Spain. There were some NTBs left within the EC-10 but these were generally removed only in later years at an EC wide level.
32
fact that the restricted version in column 1 is preferred by standard information criteria (shown in the last two rows of Table 3), leads us to focus on the restricted as the baseline.52 The theory implicitly assumes single product firms. However, it can be easily re-interpreted as applying to a firm’s decision to invest in order to introduce a new product into a country and that is why we focus on the growth of firm-product pairs, i.e. varieties. New varieties include both those firms entering new market-industry pairs and firms expanding the number of products within a given market-industry pair. Three pieces of evidence indicate that our data and estimates mainly reflect firm entry into a new marketindustry. First, the typical Portuguese exporter sells only two varieties (at 6-digit Nimexe) both in 1985 and 1987 (the average is also approximately unchanged at 6). Second, the average variety entry in our sample is 36% and most of this is accounted for by firm-industry growth, 33% (Table 2). Moreover, the latter also accounts for about 0.84 of the variation in variety growth. Finally, when we use market-industry growth as a dependent variable we find results similar to those using varieties in table 3. In fact, the implications for the estimated probability of reversal are the same, as we subsequently show in Table 7.53 Our baseline results appear to be robust to several potential concerns, so we defer that discussion to section 5.5 and focus first on examining the relative impact of the policies. One simple measure of this impact is how much variation in entry each of the variables explains. For the full sample we find that a one standard deviation reduction in applied tariffs leads to a 0.14 standard deviation increase in entry whereas for the uncertainty variable that effect is 0.4, which is almost 3 times larger. Using the model structure we can go considerably beyond this in quantifying the impact of each policy and their complementarity.
5.4
Quantification and Counterfactuals
We now employ the baseline results in Table 3 to estimate the probability of reversal and quantify the importance of uncertainty on entry and value of exporting. 5 2 The results that we discuss subsequently will be qualitatively unchanged if we included the post uncertainty variable. Moreover, while the magnitude of the tariff and initial uncertainty are somewhat different, their ratio is fairly similar with or without post uncertainty, and as we will see it is that ratio that is key to the quantification. 5 3 The regressions equivalent to Table 3 using growth of number of exporting firms to a market are available on request and in a previous version of the working paper.
33
5.4.1
Policy Reversal Estimates
Recall from our discussion of the estimating equation (24) that the coefficients for initial uncertainty and tariffs in column 1 of Table 3 map to the parameters of the model as follows: −0 = 0 0 (1 − ) and = − ( − 1). Therefore we can estimate the probability of reversal before the agreement as \ 0 0 =
b0 1 − b − 1
(26)
The first row of Table 4 shows that the baseline estimate is 0.39 ( = 3).54 Given that we placed no constraint on the estimation it is remarkable that the estimate falls in the theoretically feasible range between zero and one. Moreover, we compute its standard error to be 0.17, which allows us to reject that it is zero. This indicates that exporters in 1985 believed that the policy was neither fixed, i.e. 0 6= 0, nor certain to improve, i.e. 0 6= 0, so the reform was not fully anticipated. We also re-estimate the baseline in column 1 of Table 3 at alternative values of = 2 4 and find that the reversal point estimates are all in the feasible range; they increase slightly in , but the differences are insignificant. Thus we focus on the intermediate estimate generated by = 3, which is also the more relevant elasticity for this data, as we argue in the robustness section. Given that captures an ex-ante average exporter belief, it is hard to definitively argue that a particular estimate is too high or low. In order to provide additional quantification it is useful to ask what reform scenarios the estimates are compatible with and whether any seem unreasonable. The baseline reversal estimate of 0 0 = 039 is consistent with two extreme beliefs before the agreement. Either the policy shock is fully anticipated, 0 = 1, and preferences are lost with probability 0 = 039, or preferences will surely be lost, 0 = 1, but the timing of the policy change is uncertain with an arrival rate of 0 = 039. While we can bracket our subsequent quantification estimates using these extremes we choose to focus instead on an intermediate case that seems more reasonable and where ˆ0 = 062(= \ 0 0
05
) so the policy shock
was likely but not certain, i.e. ∈(.5,1).55 5 4 We
assume = 085, which is consistent with the Portuguese data. Recall that = (1 − )(1 + ) so our assumption is equivalent to alternative reasonable combinations of these parameters. Our choice was determined by using the average real interest rate for Portugal in 1983-1995, = 003, and an annual death shock probability = 0125. The latter is similar to what other authors assume (cf. Constantini and Melitz, 2008, p.24) and is also consistent with the Portuguese data where we find that annual firm exit rates from production is about 0.17 (calculated from Quadros de Pessoal) which is an upper bound for the exogenous death shock probability since it includes endogenous exit decisions. 5 5 The intermediate magnitudes seem more reasonable than any of the extremes given the historical context provided in Section 9. These intermediate estimates are consistent with the following exporter beliefs in late 1984: talks would collapse and preferences removed with probability 0 0 = 039; or talks would continue, but no policy shocks would arrive, and the current regime would continue with probability 1 − 0 = 038 or talks would succeed and the accession would go forward with
34
5.4.2
Policy Impacts on Entry
Since our estimates of imply it is at least 0.39 and entry is concave in this parameter we will not quantify the impact of entry using the first order approximation in the regression estimate since this will overestimate its impact. We will instead employ the estimated coefficients to compute the impact implied by the theory holding all else equal:
ln |1 − ln |0 = ln ( |1 ) − ln ( |0 )
(27)
= [ln 1 − ln 0 ] ∙ ¸ 1 − + 0 (0 ) ln =− −1 1 − + 0 where we focus on the baseline estimates where uncertainty is removed, i.e. 1 = 1. Note that the expression ˜ 0 and a given in brackets can be rewritten in terms of the estimated parameters, −0 and , the data assumption on the arrival rate such as ˆ0 = 062, which we can then average over the observations.56 In table 4 we show that this removal of uncertainty alone generates a growth in entry of about 8 log points, which is similar across alternative . Given there were about 40428 country×(firm-product) pairs in total in the sample this predicts an additional 3167 pairs by 1987. The impact of uncertainty removal can generate as much as 24 log point growth for those industries where the fraction of profits lost is highest. We now turn to the elasticity of entry with respect to tariffs. In the absence of uncertainty that is simply given by . So, to the extent that uncertainty was eliminated, the reduction of applied tariffs, generated about 4% growth in entry overall, distributed as follows: 2% into EC-10 (their mean reduction was only 0.7 p.p.) and 20% for Spain (mean reduction of about 7 p.p). Therefore the total predicted entry due to removal of applied tariffs and uncertainty is about 12 log points (.04+.08), slightly lower for EC-10 (10) and higher for Spain (28). We are also interested in decomposing the relative importance of applied tariff reductions if uncertainty had remained unchanged. To compute this counterfactual recall that the applied tariff also affects the probability (1 − 0 ) = 023. The no change probability seems reasonable given the already long path since the start of the discussions. While the belief of success would seem low given the ex-post realization of the event, we think it may reasonably reflect the information embodied in the 1985 export decisions. To see why note that about half of all shipments in 1985 had already occurred by March and likely reflect decisions to invest that were made 3-6 months earlier, i.e. in 1984, so well before the accession agreement was signed in June of 1985. Moreover, the typical shipment date in 1986 is May, which is two months later than usual (and two months after the agreement came into force). This suggests exporters waited for reasons other than avoiding tariffs, since in most industries the average applied tariff was at or near zero for EC-10 countries. 5 6 Conditional on this, the result does not require any assumption for , since its value is subsumed in the parameter estimate.
35
uncertainty term, , so we must determine the total effect of the tariff and how attenuated that entry elasticity is under uncertainty, i.e. of the cutoff elasticities,
ln ln
ln |0 ln |=0 . ln ln
ln ln ,
From (22) we see that this ratio is equal to the ratio
which we derive in the appendix, eq. (36). Therefore we estimate
this attenuation factor using 0 1 ln |0 ln | = 0 =1− ln ln 1 − + 0 ln Using the definition of expected profits lost in eq. (21) we obtain
1 ln
=
(28) ³
´
. We employ
this and rewrite the expression above in terms of the estimated parameters and data. In Table 4 we show that this factor is 0.56, so under the initial uncertainty the same tariff reductions would have generated only about half as much entry than if uncertainty was absent. Another way to put this is that the impact of the tariff reduction when the uncertainty was also removed is substantially magnified. The result is not sensitive to the choice of .57 In table 5 we employ the estimates above to decompose the total predicted entry into three components: reduction in uncertainty at initial tariffs, reduction in applied tariffs at initial uncertainty and the remainder, which captures the complementarity effect. The first column shows the result for EC-10 and Spain combined. Out of the total predicted growth, which was 12 log points, a share 0.65 (=8/12) is due to the uncertainty removal at initial tariffs, another .15 is due to the complementarity effect. The model predicts that on average accession would have only generated .19 of this entry if tariffs had been reduced at the initial uncertainty. For the EC, if uncertainty had been unchanged then tariff reductions (mostly in agricultural products) would have generated almost no entry. Even for Spain tariff reductions alone would have generated only about 0.4 of the predicted entry. One final point regarding quantification is what fraction of the entry observed in the data can the policy changes implied by the theory predict. As we see, in Table 2 varieties increased by 0.36 so the model accounts for about 1/3 of this. There was a substantial increase in the mass of Portuguese producers in this period, 0.16 between 1985-1987 (authors calculations from Quadros de Pessoal). Recall that this is exogenous in our model. Thus we can also ask what is the share of predicted entry probability explained by policy, ∆ ln ( ), we show in Table 5 that trade policy changes explain almost all this increase in the 5 7 The
magnitude of the attenuation does depend on how much of the reversal, , is due to the arrival shock. The effect is bounded by the extremes: if the arrival shock is very likely ( = 1) the attenuation is .71, if it is unlikely ( = 39) then the attenuation is .35.
36
data for the EC, and 0.6 overall.58
5.4.3
Policy Impacts on the Value of Exporting
We can also estimate the relative importance of applied tariffs and uncertainty on the value of exporting rather than entry decisions. To do so we consider a similar counterfactual to the one before: what is the predicted total change in the value of exporting, Π , and what fraction is accounted for by the uncertainty removal at initial tariffs, the tariff reduction at initial uncertainty and the complementarity effect. Using (13) the growth due to the policy changes in the expected export value function for a given firm is 1 − (1 − ) Π (1 1 = 0) 1− −1= ¢ −1 ¡ Π (0 0 ) 1− 0− + 1− E 0−
(29)
We can see that this growth rate is similar across all firms that export to the same market-industry pair. ¢ ¡ Therefore we can calculate this for each pair. To do so we use E 0− ≈ (1 − 0 ) + 0 − , where the approximation is exact in a two-state world. The results in table 6 employ the baseline estimates for
= 062 and = 3, previously discussed. When we average this over all industries and find that those firms export value grew by 9.6% (overall), more so for Spain (22%) than EC-10 ( 7.9%). We then ask what effect would have been observed if only uncertainty had been removed at the original tariffs. We can again employ (13) to obtain 1 − (1 − ) Π (0 = 0) 0− −1= ¢ −1 ¡ Π (0 0) 1− 0− + 1− E 0−
(30)
which yields an average growth of exporter value of 5.5% overall. However, the effect is very uneven: for the EC this effect accounts for almost 0.8 of the total effect. But for Spain it accounts for none of the effect. The reason is that Spain still had relatively high tariffs on Portugal and if uncertainty about them were removed then they would not increase but they would also not decrease. Given the last result for Spain it would be tempting to conclude that the applied tariff reductions alone were responsible for the large gain. However, we recall that applied tariff reductions under uncertainty have a limited effect on exporter value, as shown in (15). We can verify this directly by calculating the impact of 5 8 The model only explains 1/3 in Spain indicating that other factors were important. Real income in that country for example increased by 0.1 log points in the period and was expected to continue growing, as it did, by 0.2 between 1985-1989.
37
tariff reductions at the initial uncertainty by again employing (13) − − − Π (1 0 ) − 1 = − 1 0¡ − ¢ Π (0 0 ) 0 + 1− E 0
(31)
For Spain this implies an average growth of 4.8% so it accounts for only 0.22 of the total predicted effect with the remaining, 0.78, being driven by the complementarity from applied tariff reductions made permanent by eliminating the probability of reversal. An alternative way of measuring the cost of incredible reforms is the uncertainty entry cost premium, which we defined previously as the minimum entry cost subsidy rate required for the marginal firm under −1 deterministic policy to enter under uncertainty = 1 − . To induce the no uncertainty level of entry
the government would have to subsidize the 3167 firms predicted to enter above. For the industries with highest uncertainty we find a subsidy rate of .22; on average we find it is .08. Without information on we can’t estimate the exact subsidy costs but the model allows us to compute an order of magnitude. The (1 − ), where is the equilibrium subsidy cost for a particular industry-country pair is =
operating profit of the marginal entrant under certainty. Thus the subsidy per entrant for the highest when = 085.59 uncertainty industries ( = 022) would cost 15
5.5
Robustness: entry estimates
We now discuss some robustness tests of the baseline results. Column 5 of Table 3 adds the change in the standard deviation of the tariff faced by Portugal in each industry, i.e. ∆ ( ln ) where ∈ . There are two possible motivations for this control. First, one may argue that our model is misspecified and for some reason the exporters care not only about the mean of the applied tariff in an industry but also its dispersion, particularly since we are aggregating firms up to the industry level. To the extent that our uncertainty variable includes not just the threat tariff but also a nonlinear transformation of the applied tariff may be capturing some of that potential effect. The second argument would be that our measure of uncertainty is incorrect and that perhaps the standard deviation is the correct one. However, this variable is insignificant and does not change the value or significance of the theoretically based uncertainty measure. 5 9 The government could offer lower subsidies to more productive firms and still obtain the same entry outcome. However, productivity-specific subsidies would require information that the government does not possess.
38
We now provide some supporting evidence for our use of common elasticities and investigate if the results are sensitive to it. There are two assumptions: first, the typical elasticity within industry is similar to the typical elasticity in another industry. Below we provide some direct evidence based on estimated elasticities that supports this assumption. Second, the elasticity of substitution across industries is similar to the typical elasticity within them. We do not have estimates for cross industry elasticities to fully justify this second assumption and thus we examine directly whether the results are robust to it. The elasticity of substitution across industries is possibly lower than within industries. Our model can be extended to accommodate this. In particular, if we assume that the subutility index in (1) is a CobbDouglas aggregator with shares then the elasticity of substitution across industries is unity (so smaller than ) and the key difference for our model would simply be that the price index is now , which is defined only over the varieties in each industry . Therefore, we should rewrite the term as follows
ln = ln(1 − )
µ
¶1−
Our baseline estimation is in differences and we can show that a number of components that this alternative specification of demand introduces are differenced out. Moreover, the use of industry and country effects implies that we are left with the residual variation in the price index that varies at both the country and industry level, ∆ ln .60 This residual price index variation is only an issue to the extent that it may be correlated with the policy measures. Recall that these price indices reflect the prices of all varieties sold in those industries in country . Therefore it will be dominated by the domestic varieties and imports from countries other than Portugal, since the latter is a small exporter. Therefore we do not think that Portugal’s expansion into their markets had a substantial direct effect on ∆ ln . However, there may be omitted variable bias if a third factor affected these indices and was correlated with the changes in policy faced by Portugal. The most obvious candidate would be if the EC-10 or Spain were simultaneously reducing their tariffs on the rest of the world and those reductions were correlated with the policy changes they were implementing for Portugal. This 6 0 To see this clearly suppose we can rewrite the price index as a product of four terms, = , which reflect variation that is only country-time ( ), country-industry ( ) or industry-year specific ( ) and the last term, , which can vary along all three dimensions. If we consider changes in ln we then have ∆ ln = ( − 1) ∆ ln + ( − 1) ∆ (ln ) + ∆ ln ( )1−
The key thing to note is that in terms of our differenced estimation equation (25) the industry and country effects continue to capture all the variation in the costs and demand ( ( )1− ) and also a substantial part of the variation in the price index, namely ∆ (ln ).
39
was not the case for the EC-10 external tariff in the period we consider. However, Spain was reducing its external tariffs on the rest of the world (to converge to the European Common tariff) and these reductions were correlated to the ones faced by Portugal. Therefore we use changes in Spain’s tariffs to the rest of the world to proxy for ∆ ln . The results that control for industry and country specific price index changes are presented in column 6 of Table 3. We find a positive relationship between the price index and entry. This is as predicted by the theory: an increase in the price index in an export market makes Portuguese exporters more competitive and thus raises entry. This effect is insignificant and including it does not change the baseline results regarding uncertainty or the applied tariff effects. The same is true if we also include all the other applied policy controls in columns 2,3 and 4. Since these controls are insignificant and do not affect the key coefficients we focus on the baseline result without them, which is also preferred by standard information criteria. We now examine our assumption that the typical elasticity within industries is similar across 2-digit categories. Thus far our discussion has mostly focused on the case when the elasticity of substitution of = 3. This is based on our calculations using the sub-sample of estimates from Broda, Limão and Weinstein (2008) for Spain and the other EC-10 countries (except for Greece, Belgium and Ireland, which were not in their sample). The median for these countries over all industries is 3.4 and the mean is 4.5. Since they estimate the elasticity at a more disaggregated level (hs-4) than what we use here (roughly hs-2), it is possible their estimates are upper bounds on the 2-digit elasticities. To test if our results are sensitive to this we re-estimated the baseline regression for different elasticites. As we show in Table 4 for example, our central results are not sensitive to using = 2 4. We can also provide evidence for one of our simplifying assumptions in the model and baseline estimation: similar across countries and industries. While this elasticity is not constant within several 2-digit categories, it turns out not to vary that much across those broad industries. For example, if we take the estimates of at the hs-4 level for Spain we find that only 10% of its variation occurs across 2-digit industries. There is also not considerable dispersion across countries: the median elasticity across all hs-4 categories ranges only from 2.8 in Spain to 3.9 in Austria. Moreover, they are highly positively correlated across countries.61 There is also not a lot of dispersion in the typical elasticity across 2-digit industries in these countries. As we noted the overall median is 3.4 and, in 90 out of the 93 industries for which we have data, the median 6 1 For
example, if we take the parameter on applied tariffs that we assume to be constant, ( − 1), for each industry in Spain and regress it on the median value for that industry across the EC-10 countries we obtain a coefficient of 1.2 with a s.e. of about 0.2.
40
(over European countries) of is between 2.2 and 4.8, only 3 industries have higher values: 5.5-6.3. Given these estimates are subject to measurement error it is unlikely that there would be significant statistical differences between most of them. Nonetheless we also re-estimated the baseline specification in column 1 of Table 3 dropping the three industries with higher elasticities (Nimexe codes 18, 47 and 87) and verified the results are unchanged. Finally, we note that the variation that does exist in elasticities across industries is not in any obvious group. For example, industries 1-14 (basic agricultural products) have a median elasticity of 4–only somewhat higher than the overall sample. One potential concern with the agricultural products is that they are subject to non-tariff barriers and account for about 22% of the sample. If these NTBs are not changing then they are controlled for by the country industry effects, . If they are changing, as we know they are for Spain, and are doing so in a way that is correlated with our uncertainty measure this would bias our estimates. One way to address this is to control for NTB changes directly. We did so in column 3 of Table 3 and verified the results did not change. One may also object to applying a monopolistic competition framework to agricultural goods and argue that they should be dropped altogether. We are agnostic about this but nevertheless when we do drop basic agricultural goods we still find that the uncertainty measure still has an effect that is qualitatively and quantitatively similar to the baseline case. However, the applied tariff coefficient is now less than half in magnitude and statistically insignificant. This is not surprising since the tariff reductions by the EC-10 mostly occurred in those agricultural products so the remaining ones in the sample were those already receiving significant tariff concessions. This again stresses that uncertainty reduction was a key motive for entry. Table 7 provides two other robustness tests. First, we re-estimate the baseline using entry of firms per industry into a market. This alternative dependent variable leads to the same probability of reversal, as we can see comparing column 2 with the baseline in column 1. Thus the entry effect we capture is mostly one of firm entry in an industry, as previously argued. Second, in column 3 we re-estimate the baseline using growth in varieties between 1987 and the average in three years prior to the agreement (1983-1985). The probability of reversal is still positive and significantly different from zero. Its value is slightly lower than when we focus on 1985 as the pre agreement period, which suggests that in 1983-4 the exporters believed policy was less likely to change. A similar result holds for firms (column 4). In sum, the baseline estimates are fairly robust to alternative potential concerns.
41
5.6
Policy Impacts on Total Exports
While our main interest is on the impact of policy on entry and export firm value, we can also employ our framework to analyze the value of exports. In this section we present the basic estimation equation, which we relate to the structural parameters and then use to quantify the relative impacts, in an exercise analogous to the one for entry in Table 5. Total exports in any given industry to a particular market are the product of the number of varieties ¯ . exported to that market (first bracket) and the average sales, denoted by ¢¤ £ ¡ ¯ × =
(32)
¯ by averaging (4) over all exporting firms so it is affected by applied tariffs and reflects We obtain ¯ the Pareto distribution and the derived cutoff, , we obtain the entry cutoff. Using the expression for , the export equation as a function of uncertainty and applied policy measures, as detailed in the appendix. The estimating equation in differences can be written in a format similar to the one for entry
˜ 1 − 0 ˜ 0 + ∆ ln + + + ˜ for each ∆ ln = 1
(33)
( −( − 1)) and for the tariff it is = − −1 . where the coefficient for uncertainty is now = − 1−
We estimate this equation based on the difference between 1987 and 1985, as done for the entry, and find that both of these variables have the expected sign and are statistically significant. We also find that the post agreement uncertainty effect is insignificant.
The exact parameter estimates for and
themselves are not as interesting as the quantification exercises that they allow us to perform so we focus on the latter. For example, using the baseline assumption of = 3, we derive the implied probability of reversal; the point estimate is 0.45 and we can’t reject that it is equal to the estimate obtained with the entry equation (0.39). We then use this reversal estimate, assuming = 04505 , and the structure of the model to predict the impact of policy on exports. Similarly to the entry exercise, the total predicted export growth due to policy is given by the sum of the uncertainty removal at initial tariffs, ln |1 |0 (derived in the appendix), and the tariff reduction in the absence of uncertainty ( ∆ ln ). We find this is 34 log points for the EC-10 and Spain combined. The average growth in the data is 55 log points (as seen in Table 2) so the policy change predicts a large
42
fraction of this. The predicted change accounts for an even larger fraction of the observed value if we net out the increase in the mass of firms, the term , which is exogenous in the model and grew about 16 log points. When we take this into account the model explains 0.87 of the remaining growth, as shown in the last column of the first row of Table 8.62 In Table 8 we also decompose that predicted growth in a way that is analogous to the entry results in Table 5. The fraction of the 34 log points accounted for by the uncertainty removal at initial tariffs is 0.59. To calculate the counterfactual impact of tariff reductions at the initial uncertainty we first derive the attenuation effect,
ln |0 0 ln |=0 ln , ln
in the appendix and estimate it is 0.69. This is less than
unity and thus confirms the complementarity of tariff and uncertainty reductions for export values.63 We can see that complementarity effect accounts for almost a quarter of the predicted growth for Spain, which is about the same fraction as the uncertainty effect at initial tariffs. For the EC most of the growth was due to the direct uncertainty removal effect (0.75), which is reasonable since most tariffs were already at zero. This contrast in the sources of growth of exports provides another interesting motive to consider both the EC-10 and Spanish case since some recent PTAs may look more like the EC-10 case (e.g. Colombia securing pre-existing preferences received in the US market) and others like Spain’s (e.g. Korea obtaining tariff reductions and securing them).
6
Conclusion
We provide a framework to study the effect of TPU on firm investment and export decisions. Despite its dynamic nature, the model is highly tractable and delivers clear predictions for how to empirically compute TPU and estimate its impact. Applying this to a specific setting that is particularly appropriate, we find that, (i) before accession to the EC, Portuguese exporters stood to lose about 16% of exporting profits if they lost their preferences in the EC-10 or Spanish markets and (ii) they believed such an event had a real probability of occurring before the PTA (39%). The agreement eliminated this TPU and the overall trade policy changes can account for a considerable share of firm entry and export value in the data (more for the EC-10 then for Spain). If, counterfactually, the applied tariff reductions had been implemented at the 6 2 Note that the predicted export growth is higher than the growth due to entry, suggesting that the policy changes also affected average exports. Such an effect would arise naturally if firms could make technology upgrading or capacity building investments after entry. Such upgrading is likely given the large increase in export values for existing firms, that we derived previously. In related work we show that our model can be extended to incorporate such upgrading decisions. 6 3 It is not as pronnounced as the 0.56 factor for entry since now tariffs have a direct effect on exporters that are already in the market regardless of uncertainty.
43
original TPU level then only 20% of the total predicted firm entry growth would have been realized. These results have policy implications for the many countries still receiving unilateral preferential tariffs, which are subject to the discretion and uncertainty of policy making, as Portugal was before 1986. Thus our results provide one reason why these programs are not always successful in promoting trade and investment and how this may change if those preferences are secured through formal PTAs. Our framework can be used and extended to address various other interesting questions. First, the basic structure of the model can be applied to other settings. One example is tariff bindings in the WTO (as in Handley,2011). Another is the U.S. threat of non-renewal of China’s MFN status and whether its elimination in 2001 (upon China’s WTO entry) can explain the subsequent export boom to the U.S. Second, the model is tractable enough that it can be extended to include effects of uncertainty on intensive margin decisions (e.g. via technology upgrading decisions as in Bustos, 2011) and endogenous exit. Third, the model can also be extended to analyze the role of own TPU on imported intermediates, which may play an important role in increasing firm productivity (cf. Goldberg et al, 2010). Another interesting extension is to examine the interaction of uncertainty between trade policy and demand conditions, to analyze for example the role of TPU during the great trade collapse.64 Our estimates also have broader implications. For example, the finding that the elasticity of entry and exports with respect to applied tariff changes is considerably attenuated in the presence of uncertainty has implications for explaining trade flows and the resulting welfare gains. To see this, note that if those elasticities are estimated under uncertainty (but neglect to account for it) then ex-ante predictions based on them will tend to underestimate the entry and export impact of subsequent credible reforms. Second, ex-post analysis of PTAs often find large trade effects even if applied policies are low. From this it is often inferred that either those applied policies are correlated with other unmeasured but applied trade costs that were also reduced, or that their trade elasticity is very high. Our results provide an alternative explanation: the large trade impact is partly due to the elimination of TPU. This uncertainty can also help explain the border puzzle: why trade across an international border is considerably smaller than within a country even when trade costs appear similar. Appropriate trade elasticities are central in the evaluation of “static” welfare gains from trade in CGE and new trade theory models (cf. Arkolakis et al, Forthcoming). The attenuation effects suggest we must be careful about which elasticities we should use for such evaluations; 6 4 A related application is the interaction of trade elasticities with other sources of uncertainty, such as exchange rates. We did not find much evidence for adverse effects of exchange rate volatility in the 1981-1990 period, but these effects may have grown more important during the lead up to adoption of the Euro.
44
more fundamentally our results suggest that these evaluations should focus on models that are inherently dynamic. In conclusion, our results highlight why and how much trade policy uncertainty affects investment and entry into new markets. While credibility is often mentioned as an important component of a policy reform, it is generally difficult to measure its impact. To the extent that our approach and results do just that they may be of broader interest to economists and policy makers interested in evaluating the impact of other policy reforms on firm-level decisions.
45
A
Theory Appendix
A.1
Value Functions
The set of equations in (9),(10),(11), and (12) is linear in the four unknowns and can be solved algebraically. The solution to the current values of exporting, Π ( ), and waiting, Π ( ), are respectively given by (13) and (14) in the text, as is the unconditional expected value of exporting, E Π ( 0 ) = E[( 0 )]1 − , whereas the conditional value is EΠ ( 0 | 0 ≤ ¯) =
A.2
E[( 0 )] − E[( 0 ) | 0 ¯](1 − ) (1 − + )(1 − )
Cutoff and profit loss expressions
We combine the expression in (17) with the operating profit function in (5) to solve directly for as a function of the current tariff =
½
1 ∙ ¸¾ −1 − E( − ) ( )[− − E( − | ≤ )] + + 1 − (1 − ) (1 − )[1 − (1 − )] (1 − )[1 − (1 − )]
(34)
Using this and the definition below for ( ) we obtain (18) in the text. 1. ( ) ≤ 1
We denote the maximum tariff by . £ ¤ ( ) ≡ E( − ) + ( )[− − E( − | ≤ )] − ∙Z ¸ Z = − ( ) + ( )− − − ( ) − ¸ 1 ∙Z1 − − − = ( ) + ( ) ¤ £ = (1 − ( ))( − | ≥ ) + ( )− − ≤ 1
where the last inequality follows from
(1 − ( ))E( − | ≥ ) + ( )− ≤ − and the fact that the LHS is a weighted average of two terms, one equal to − and the other equal to E( − | ), which is less than − . When the current tariff is at the maximum of the support of ( ) such that = , then the difference in brackets and the term (1 − ( )) are both zero. 2. ( ) is increasing in the current tariff As increases, the profit lost from being hit with a shock to a higher tariff is reduced so
0
( ) = [−− ( ) + ( )− − ( )−−1 ]− + [(1 − ( ))E( − | ≥ ) + ( )− ]( −1 ) = [−( )−1 ] + −1 [(1 − ( ))E( − | ≥ ) + ( )− ] = −1 [−( )− + (1 − ( ))E( − | ≥ ) + ( )− ] = [(1 − ( ))E( − | ≥ )] 1− ≥ 0
46
In semi-elasticity terms, this becomes [(1 − ( ))E( − | ≥ )] ( ) = ∈ [0 ] ln −
(35)
This implies that as the current tariff increases, the proportional gap between the deterministic and ln uncertain cutoff narrows. We can see that that if = the derivative goes to zero. Then ln = − −1 and the elasticity of the cutoff under uncertainty evaluated at the tariff maximum equals the elasticity at the deterministic cutoff.
A.3
Cost cutoff results
1. Tariff attenuated impact on entry under uncertainty:
ln ln
ln
ln ∈ [0 1]
Using the expression for from the text, we log differentiate and derive ln ln ln ln ln ln ln ln ln ln
ln ln + ln ln 1 + =− − 1 − 1 (1 − + ) ln ∙ ¸ 1 1− =− −1 (1 − + ) ln 1 =1− 1 − + ln =
(36)
1 As we show in (35) ln ∈ [0 1], so entry is less responsive to tariff changes under uncertainty. The two exceptions (limiting cases) are when = 0 (i.e. tariffs are deterministic) or when is already at the maximum of the tariff distribution.
2. The cutoff is decreasing in the arrival rate of shocks :
ln
0
In the empirical work we focus on the semi-elasticity and we derive this comparative static here ln ln = µ ¶ 1 ln(1 − (1 − )) − ln (1 − (1 − )) = − 1 1− ( − 1) = − 1 (1 − (1 − )) (1 − (1 − ∆)) We thus have
µ
ln
=
µ
−1 1 − (1 − )
0
which is negative since we showed above that − 1 0 when 0.
Using the derivative, we can write the first order effect around = 0 used in the estimation ¯ ¯ ( − 1) ln ¯ = ¯=0 1 − − 1
47
(37)
3. First-order Cutoff Approximation We take a first-order Taylor approximation of ln around = 0 and = 0. ¢ ¡ ln ( ) = ln × = ln (ln 0 = 0) + ln (ln 0 = 0) +
ln ln |(0 =0) |(0 =0) + (ln − ln 0 ) ln ln | | ln ln ( =0) ( =0) 0 0 + ( − 0) + + ( − 0)
+ (ln − ln 0 )
Using the definition for , equation (37), noting that ln ln |=0 = 0 and simplifying we obtain the expression in equation 20 in the text. ln | =0 =0 =
1 (0 ) − 1 − ln + ln + 1− −1 −1 − 1 (1 − )
(38)
4. Real Option vs. NPV Cutoffs In section 4 of the text we note that (i) the cutoff under the option approach is always lower than under the NPV approach To see this note that in the absence of the option to wait the last term in (34) drops out and we obtain the standard NPV cutoff, denoted . Since the last term in (34) is non-positive the option cutoff is lower, i.e. ≤ , which implies less entry than under the standard NPV case. (ii) the cutoff under the NPV approach can be higher or lower than the deterministic and thus reductions in uncertainty can lead to less incentive for entry under the NPV approach. If the deterministic tariff were such that − = E( − ) then these two cutoffs coincide (as can be seen h i 1 ( − ) −1 if we combine the first two terms of (34) to obtain = = ). But if instead we hold (1−) 0 the current tariff at its long-run mean, i.e. = E( ), then the convexity of profits in tariffs implies that the Marshallian cutoff is higher than the deterministic cutoff. To see this note that if = E ( 0 ) then − ( )− = (E ( 0 )) ≤ E( − ) (Jensen’s inequality for 1) so ≤ at the long run mean of the tariff distribution. This implies that if we actually eliminate uncertainty while holding the current tariffs equal at the mean in the deterministic case then there would be less incentive for entry, which is the opposite effect of uncertainty from what we find using the real option approach.
48
B
Data and Estimation Appendix
B.1
Policy Data
Pre-accession policy data The earliest trade data for Portugal is from 1981 and the closest full EC trade policy schedule before then is for 1980 (OJ L 342, 31.12.1979, p. 1—382 ). This, and the fact that EC applied tariffs to Portugal in industrial goods were the ones set in the 1977 agreement, and thus remained in place until 1985, lead us to initially digitize and use the 1980 schedule.65 The 1980 schedule already reflects some of the EC multilateral tariff bindings negotiated in the Tokyo Round. However, some of these bindings, which we use to construct our uncertainty measure, continued to be reduced over a period of time.66 Therefore, if the worst case scenario for Portuguese exporters between 1981-1985 was the EC binding then it may have entailed a lower tariff than that implied by the 1980 binding. Even for those goods where the binding was falling the 1980 binding may still be the appropriate one to capture the exporter expectations we model if for example the exporters did not immediately update their beliefs about the tariff distribution. We obtained the 1984 trade policy schedule for Spain. This schedule was published by the International Customs Tariff Bureau in the International Customs Journal. We believe this was the only full schedule published in the 1980s for Spain and it contains Spain’s preferences relative to Portugal and the EEC as well as its policy relative to the rest of the world. The documentation we found implies that Spain’s preferential tariffs for Portugal remained unchanged between 1984 and 1985 because the EFTA-Spain agreement that regulated these had reached a phase requiring additional negotiations of indeterminate length. Post-accession policy data To construct the tariff profile faced by Portugal immediately after the agreement we applied the concessions schedule in the Articles of Accession, Protocol 3 for Spain (Official Journal L 302 , 15/11/1985 P. 0410) and Article 243 for the EC (Official Journal L 302 , 15/11/1985 P. 0094). These imply staged reductions of 12.5% per year for Spain and 14.2% for EC-10 with some exceptions for certain goods and industries. Applied Protection and Uncertainty Measures The schedules for the EC and Spain were manually keyed into digital format at the tariff line level by a firm specialized in data entry. We performed a number of checks to ensure that the quality of the entry and kept track of the few tariff lines with various combinations of minimum and maximum tariffs, specific tariffs and seasonal tariffs.67 We then applied preference margins for the EFTA-Spain and EC-Portugal agreements to compute the applied tariff faced by Portuguese exporters in 1985. We applied the staged reductions of the Articles of Accession to these schedules for the EC and Spain to compute the 1987 tariff profile. These digitized schedules yield our tariff line measures of applied tariffs in 1985 and 1987. There are about 9500 tariff lines for Spain and 6500 lines for the EC in any particular year. Finally, we digitized a set of pre- and post-accession NTMs applied by Spain at the 4-digit industry level based on accession documentation submitted to the GATT.68 Concordance and Aggregation We constructed our tariff panels using the Brussels Tariff Nomenclature to maintain consistency between published schedules and the preference margins stipulated in pre- and post-accession agreements. However, our firm level data are classified by Nimexe so we map each BTN code to a 6-digit Nimexe code using a 6 5 While our baseline results only use data for 1985 and 1987 to isolate the effect of the agreement in 1986, we also planned and ran robustness tests that include earlier years. 6 6 "Implementation of MTN concessions: Note by the secretariat, revision" TAR/W/8/Rev.3, October 15, 1981 6 7 For example, Spain levies an ad valorem tariff of 14% on product 66.01-A-I "Umbrellas and sunshades: Covered with fabrics of silk or man-made fibres" subject to a minimum specific tariff of 75 pesetas each. We use the ad valorem tariff as our tariff line applied measure and track the presence of the minimum tariff in an indicator variable. 6 8 See "List of Non-Tariff Restrictive Measures Applied by Portugal and Spain before and after their Accession" L/5936/Add.5, 5 March 1987.
49
time-consistent 6-digit Nimexe. We constructed the concordance by digitizing the EC’s official concordance between the BTN and Nimexe.69 To further maintain time-consistency, our concordance allows for changes the Nimexe system over the sample period. We tracked these yearly changes according to schedules found in the Eurostat publication External Trade Nomenclature of Goods, Volume 5 (1990). When there are multiple BTN codes mapped to single Nimexe code, we average within the Nimexe code. The same schedules give us the pre- and post- accession worst case tariff used to compute the uncertainty measure as described in the main text. We aggregate by industry up to the 2-digit Nimexe level by taking the arithmetic mean of tariffs and our uncertainty measures. Within each industry, we keep track of detailed tariff line information by computing the shares of tariff lines with complex and specific tariffs and use these as additional controls in the robustness checks.70
B.2
Firm and Aggregate Data
Our firm level data is from the Portuguese census (INE). We use the transaction level trade data available for the period 1981-1990 from customs declaration forms processed by INE. Since the 1981-1987 trade data had not previously been used we did several basic exercises to check their accuracy. We found no law establishing minimum value thresholds for filling out the customs forms in this period. There are no discontinuities at low values in the shipment value distribution. We confirmed that the aggregate yearly values of both imports an exports matched those reported by the official INE printed publication "Estatisticas do Comercio Externo" for several years. INE converts data for all years into euros at a rate of 200.482 esc/euro even before the euro was implemented. Firm identifiers Some of the additional evidence in appendix section B.4 makes use of the shipper’s identifier variable (labelled NPC) to determine if it is a new or existing exporter to a market. INE reports that this is a unique firm identifier after 1986 and it is in fact used to match trade data to employment and other firm-level data collected by INE in recent years in other work. There is also a unique identifier in 1981-1985 but so far neither INE nor Portuguese customs have been able to provide a correspondence that would allow linking specific firms between 1985 and 1986. Given that the pre-1986 data had not previously been used we requested INE to confirm with Portuguese customs that pre-1986 identifiers were unique and allowed us to track firms in that period, which they did. We further investigated this by calculating statistics by NPC in each year (e.g. industry of modal product exported, # products, # destinations, total shipment value and weight, etc) and verifying they were highly correlated in adjacent years, e.g. the elasticity of total export values by NPC between 1985 and 1984 is one, similarly for other variables. Moreover, these relationships were identical to those found when comparing adjacent years in the post-1986 data where the NPC identifier was known to be unique. Destination country To ensure that country codes are consistent over time we used the official list of changes in trade partners published yearly in the "Estatisticas do Comercio Externo". When a country splits, the code for the “larger” unit (e.g. Russia) is the same as the existing (e.g. USSR) and a new code is created for others (e.g. Ukraine). When a country merges (e.g. Germany) we assign the same code as the largest of the existing (West Germany) and drop the other (East Germany). 6 9 See "Commission Regulation(EEC) No 3840/86 amending the nomenclature of goods for the external trade statiscts of the Community and statistcs of trade between Member States (NIMEXE)" (Official Journal L368, 29/12/1986). 7 0 Our estimation method requires an industry level net entry dependent variable, but this is not the only reason to aggregate tariff line policy data over the sample period. From 1980 to 1987 the Brussels Tariff Nomenclature (BTN) and Nimexe classifications are updated annually, but our tariff schedules reflect the classification in place at the time of implementation. Spain, Portugal and the EC further differentiate tariffs within BTN categories. BTN and Nimexe are time-consistent and equivalent at the 2-digit level.
50
B.3
Data sources and definitions
Aggregate Regressions (Table 1 and B1; 1981-1990): • Exports (ln): Nominal value of exports in euro of all goods to country i in year t. Source: Author’s calculations based on INE data. • Number of Firms Exporting (ln): Number of uniquely identified shippers with positive exports to i in year t. Source: Author’s calculations based on INE data. • Exports per Firm (ln): ln(Exports Number of firms ). Source: Author’s calculations based on INE data. • Real Importer GDP (ln) country i, year t in billions of importer currency. Source: IMF International Financial Statistics (IFS) • Importer Price Index (ln): ln nominal GDP-ln real GDP in local currency. Source: IMF IFS • Annual Exchange Rate (ln): Simple average of ln monthly rate, where latter is defined as ln((escudo/importer currency)/200.482). The fixed conversion factor from esc to euro is 200.482 and plays no role in the regressions. Source: Authors calculations from IMF IFS (monthly). • Exchange Rate Volatility (ln): standard deviation of log monthly changes in the year. Source: Authors’ calculations. Firm and policy data in estimates of Tables 2-8 • Change in Number of Firms: ln(# firms exporting to in , 1987) - ln(# firms exporting to in , 1985) where is an EC-11 country and corresponds to a NIMEXE 2-digit industry. Source: Authors’ calculations. • Change in Number of Firm-Varieties (ln): ln(# varieties exported to in , 1987) - ln(# varieties exported to in , 1985) where “varieties” are defined as distinct 8-digit NIMEXE products exported by each firm. Source: Authors’ calculations. • Change in exports: ln(export value to in , 1987) - ln(export value to in , 1985). Source: Authors’ calculations. • Pre Tariff (GATT): ln where is 1+advalorem rate at product level that GATT members faced in Spain or EC-10, which is then averaged to Nimexe 2-digit industry. Source: International Customs Journal: Spain, No. 24, 16th Edition, 1984. EC :Official Journal, L342, 31.12.1979, p. 1-382. • Pre Tariff (Portugal): ln where is 1+advalorem rate at product level Portugal faced in Spain or EC-10, which is then averaged to Nimexe 2-digit industry. Source: International Customs Journal: Spain, No. 24, 16th Edition, 1984. EC :Official Journal, L342, 31.12.1979, p. 1-382. • Post Tariff (Portugal). ln for immediate post agreement period that Portugal faced in Spain or EC10, constructed as described in previous section. Source: Articles of Accession, Official Journal L 302 , 15/11/1985. • Applied Tariff Standard Deviation Change: ∆std(ln ) where the standard deviation is over tariffs Portugal faced in each Nimexe-2 industry; the change is between the pre and post tariff. • Uncertainty: Proportional reduction in per period profits if the tariff faced by an exporter reverts from the preferential tariff received prior to accession (Pre Tariff above) to the tariff received by all non-preferential partners (i.e. the conventional GATT member tariff). Source: Authors’ calculations using equation (21) with = 3 in the baseline regressions. 51
• NTM Share Change: Difference in share of lines in 2-digit industry with min, max or other tariff measures between post and pre-agreement period. Source: Authors’ calculations. • Specific Tariff Share Change: Difference in the share of lines in 2-digit industry with specific tariffs between post and pre-agreement period. Source: Authors’ calculations. • Price Index Proxy Change (ln): Difference in Spain’s external tariff between post and pre-agreement period. Source: Authors’ calculations. Other data (Figures and text) • Import & Export to GDP ratios (Text). Source: Pinheiro et al (1997). • Trade Shares (Figs. 1 and 2): Source: IMF Direction of Trade Statistics • Export Firm Entry Growth (Fig. 3) ln(# firms exporting to country i at t)-ln(# firms exporting to i in 1985). Source: Authors’ calculations. • Export price index (ln): 1985 base chain price index for exports. Source: Authors’ calculations from yearly price deflators of export goods to all destinations in Pinheiro et al (1997). • Employment: Source: Authors calculations using trade data matched to firm employment data (Quadros Pessoal) by INE. • Firm identifier (NPC ): unique code that can be used to match firms between 1981-1985. Portuguese customs changed this code in 1986 and it is consistent for 1986 onwards but not between 1985 and 1986. • New exporter in year t: Firm exporting somewhere at t but nowhere in t-1. Source: Authors’ calculations. • Gross Entry rate in year t: (Total # new exporters in t)/(# exporters t-1). Source: Authors’ calculations. • Gross Exit rate in year t: (# exporters with positive exports in t-1 and none in t)/(# exporters with positive exports in t). Source: Authors’ calculations.
52
B.4
Additional aggregate evidence and estimation details
In this appendix we provide additional details on the aggregate evidence in section 3.2 that supports both some of the modeling assumptions and predictions of the theoretical approach. We also discuss theoretical and empirical motives for focusing on net or gross entry. B.4.1
Model implications for net entry
The model in section 4 has implications for both net and gross entry so we could potentially consider them separately. However, the nature of the data and entry/exit processes may not always allow us to distinguish between them separately. The central prediction of interest is that certain reductions in uncertainty lower the cost threshold that firms must satisfy to enter a market and thus, all else equal, imply larger numbers of firms exporting. This larger number can be due to two effects 1. Entry of “new” firms: Firms that previously did not export and would not have entered the market in the absence of this uncertainty reduction but now do so. 2. Re-entry or non-exit of “existing” firms: if a firm is hit by a shock that leads it to exit then if it is still below the threshold it will re-enter but if it is above the threshold it will not. When the threshold falls with uncertainty this firm is now more likely to re-enter or not exit in the first place. To test the central prediction (lower uncertainty leading to higher number of exporters) we must first address the basic issue of constructing an appropriate counterfactual. In Table 1 we considered the number of firms exporting to a preferential market relative to those exporting to the rest of the world before vs. after the PTA while controlling for aggregate potential determinants of entry. To decompose the effect of uncertainty into new vs. existing firms using the exact same approach and time period we would require data on a consistent set of firm identifiers over the full period. These identifiers are not available for 1985-1986 so this is the first difficulty in decomposing the effect. We do have consistent identifiers for a few months prior to accession (early 1986) and after accession, which we explore below. However, even if we had consistent firm identifiers over the full period there is a deeper issue that can prevent us from clearly decomposing the effect. Namely, the fact that we cannot observe the “death” shock and may therefore not observe the exit at all (e.g. if a firm suffers a cost increase that would make it exit if the cutoff were unchanged but not if the cutoff cost increased). So, if we focused only on gross entry (e.g. those by firms never before in that market) we could miss an important effect of uncertainty. Given this, our focus in the paper is on the effect of uncertainty on the overall number of exporters rather than decomposing it into its separate effects. However, to provide some additional motivation for the model we also want to ask whether we can rule out some alternative explanations for the aggregate data. In particular, one concern is whether the agreement increased re-entry (or lowered exit) and thus could have lead to a higher number of firms even if the threshold had not changed. We first describe our definitions and accounting methodology for the raw data analysis mentioned in section 4. We then provide some additional robustness checks in light of the predictions of the model. B.4.2
New vs. continuing firms: definitions and stylized facts
To fix ideas we decompose the number of firms exporting to a particular market into continuers ( ), defined as those that exported at and − 1, and entrants ( ), those that export at but not − 1. The total number of exporters, , is therefore = +
53
Since = (1 − ) × −1 (where is the exit rate between and − 1, i.e. write the net entry rate as − 1 = − −1
numb er of exits ), −1
we can
0
1000
2000
3000
4000
When we examine the raw data we find that average yearly exit rates in the period after agreement (8790) are similar to pre-agreement for Spain (about 0.35) and actually increase for the EC-10.71 Therefore, the growth in the number of firms in these markets appears to be driven by gross entry. Some direct evidence for this is provided in the graph below that compares the yearly number of entering firms into different markets and shows a differentially larger effect for Spain and EC-10. The EC and ROW levels and trend prior to the agreement are very similar but after the agreement the EC had on average almost 800 additional new exporters per year. Spain started from a lower level than the ROW but ended up at a similar level and the differential increase in new exporters is over 750. The effect is even more pronounced if compared to a single large market such as the US.
1982
1984
1986 year Spain US
1988
1990
EC-10 ROW
Figure B1: Number of New Firms Exporting to Preferential and Other Markets
The figure above indicates that the increase in the number of exporting firms can’t be explained solely by continuing firms choosing to stay in EC markets following accession. Our approach is to identify a counterfactual with the cohort of firms we observed exporting to the market just before the agreement was implemented , or shortly thereafter (since some of the potential new entrants may have waited until implementation to decide to make the fixed cost investment). Given that the consistent identifier starts in January 1986 we first simply use the cohort of firms that were exporting in 1986. If the agreement lead to no immediate entry then change in the stock of firms relative to the 1986 cohort provides a reasonable measure of the stock of “new” entrants. But if some entry already occurred, as the large increase in net entry in 1986 suggests, then this will be an underestimate. The graph below shows the total number of firms and those in the post-86 cohort. The latter are zero in 1986 by definition and increase extremely fast, clearly driving the growth in the total number of firms. The rapidly narrowing difference between the lines indicates the decline in the number of the 86 cohort, so any re-entry for that initial cohort is insufficient to offset exit. This suggests that the agreement effect is 7 1 This treats the EC-10 as a single market to facilitate comparison in some of the graphs with the rest of the world. The econometric evidence will treat each country as a separate martket. The exit rates for the larger EC-10 countries such as Germany increase from .39 in 1985 to .45 in 87, in France it goes from .43 to .48. I have not yet done it for others.
54
0
2000
4000
6000
8000
not simply on re-entry or non-exit of pre-agreement firms but on entry of new firms.
1982
1984
1986 year # Firms
1988
1990
# Post-86 Cohort
Figure B2: # of Total vs Post-Accession Exporters to Spain
B.4.3
Contribution of new firms to exports: 1986-1990
Table B1 uses the raw data to further quantify the aggregate importance of new Portuguese exporters to EC-10 and Spain after accession. Since we are interested in capturing the more immediate effects of the agreement and do not control for other factors we focus on a period close to the accession date: 1986-1990. Between these years alone, real exports to the world grew by 50%. Real exports to Spain in this period increased about 785 million euro and accounted for 23% of this growth and the EC accounted for 59%. Note that these figures start in 1986 so they miss the considerable growth that already took place relative to 1985 (about 7%) that was fully driven by the EC-10 and Spain (real exports to the ROW actually fell in 1986). The reason we do so is that starting in 1986 we can track specific firms. Thus we can decompose the export growth into different firm cohorts. We find that 46% of the increase in exports between 1986 and 1990 to Spain and 62% to EC-10 is from “new” firms, i.e. those that did not export to those markets in 1986.
We view these numbers as a lower bound for the contribution of firms that entered after the agreement since they exclude the many firms that entered in 1986. While this is a limitation of the data we can still provide some additional criteria to identify firms that are “likely” new exporters in 1986. The agreement only started to be implemented in March 1986. So some firms may have waited until that date or later in the year before starting to export. This can be either because the actual tariff reductions did not start 55
until March (in case of Spain and some EC agricultural products) or because they wanted to be certain that the agreement would in fact be implemented before incurring any fixed costs. In fact, we observe that the typical first month of shipment across all firms to Spain in 1986 is May, which is two months later than the median in previous years. For EC-10 countries the median increased about 1 month in 1986. This suggests that we can use a firm’s first shipment to these markets in 1986 as a way to help identify when it enters. Using this information we augment the “new exporters” category to include those that export in 1987 or later and also those firms that exported in the second half of 86 but not the first. We use this definition of “new” exporters in the results mentioned in the text.72 The criterion identifies about 532 firms in the case of Spain but it is important to note that they only account for about 2% of exports to Spain in 1986. For the EC the criterion typically identifies about 200 firms. Using this criterion the share of new firms in export growth between 1986 and 1990 goes up to 54% for Spain and 73% for the EC. When making year to year comparisons one potential issue is that if one of the groups fares particularly badly in the final year then the decomposition may be misleading. We account for this by averaging exports for each cohort over the years 1987-1990 and calculating the difference relative to 1986. Doing so generates results similar to the table above: the growth accounted by post-mid 86 firms is now 50% for Spain and 76% for EC-10. In sum, we find new exporting firms accounted for a significant fraction of export growth to Spain and EC between 1986 and 1990. B.4.4
Decomposing the effect of accession between new and existing firms
As we noted, the raw data shows a substantial number of “new” firms exporting to Spain and EC-10 between 86-90 and their importance in export growth. However, this is consistent with different explanations for new entry: (a) it is common to all export markets; (b) entry relative to Spain and EC is already present before the agreement, or; (c) it is generated by other determinants, e.g. income and price changes. In Table B2, we report the full results of our counterfactual experiment for new entry and average annual exports due to accession. The first column replicates the results in the baseline for ease of comparison. There are two basic changes relative to that sample. First, the new sample excludes countries with zero exports of existing firms in 1981 or 1986 or zero exports of new firms, so the control group is in some ways more similar to the “treatment”. Second, we exclude the initial years, 1981 and 1986.73 Neither of these changes to the sample has much effect on the aggregate export specification (not shown), which looks similar to the one for the full sample in column 1. As we can see in column 3 there is a positive significant effect of the agreement on total exports of new firms for both Spain and EC-10. Decomposing this effect into the number of new firms (column 4) and their average sales (5), we see that it is the former that increases exports. In fact, we see that the average sales of new firms post agreement are lower, which provides evidence that the agreement changed the entry threshold making it easier for smaller firms to export. 7 2 This definition raises the question of seasonality (some firms’ products may only be demanded in the second half of a year) so we restrict these new exporters identified in the second half of 86 to the subset that also export in the first half of 1987. 7 3 We must necessarily do when we use the post-initial year definition. We do the same for comparability purposes when employing alternative definitions of new entrants that may include some exports in the initial year.
56
To decompose the impact of the agreement we also ran a similar specification for the existing firms (column 2). There is a positive effect of the agreement for both Spain and the EC. We then use the estimates to predict the average change in export value to a market implied by the agreement for new firms (from column 3) and existing ones (column 2). We do so for each year 87-90, deflate it and average them. The sum of these two predictions is in table B3 below over 500 million euro for Spain and over 600 for EC-10 of additional exports on average per year after 1986. New firms account for about 30% of this predicted change to either of them. The last two columns of Table B3 show a similar decomposition for the number of firms using the estimates in Table B2 (column 4) and an analogous specification for existing firms (not shown). The predicted average increase in the number of firms due to the agreement is about 3500 for Spain and over 7200 for all the EC-10 countries combined. A large part of this change is from new firms (0.68 for Spain and 0.78 for the EC), as we report in section 3.2.
57
B.5
Firm-level estimation details
1. Empirical Implementation of Tariff Uncertainty in Discrete Case To construct the empirical measure of ( ) we consider a discrete probability distribution for tariffs. We then ask, given that a policy shock above the current trigger arrives, what is expected value of the proportional loss in profits? This quantity is summarized by ( ) − 1, which we now compute for a twoand three-state tariff process relevant to our empirical implementation.
Two State Tariff Distribution: High, Low Initial State ( = )
Probability ( ) 1 −
( = ) − 1 0 ¡ ¢ − − − − −
In the two state case, any firm with an entry trigger ≥ would enter when the tariff is in the high state. The likelihood of a shock to trade policy leading to a worse outcome is zero. As was the case with a general continuous distribution, the cutoffs in the deterministic and uncertain model will coincide at the maximum. In the low state, ( ) − 1 is nonzero and less than unity. In the estimation, we construct the observable counterpart to the ( ) − 1 from tariff data and assumptions on . Three State Tariff Distribution: High, Medium and Low Initial State ( = )
Probability ( )
1 − −
( = ) − 1 0 ¡ − ¢ − − − − £ ¡ ¢¤ − ( + ) − − ( − | ) − P = − = [ (− − − )]−
The three state distribution is slightly more involved, but makes it clear how to generalize to many discrete states. We argue in the empirical section that Portugal had “medium" preferential tariffs with respect to Spain by 1983 of an indefinite nature due to the EFTA-Spain agreement. If −→ 0, then we see that the measures in the second and third row coincide with our empirical implementation for the EC and Spain. 58
2. Legacy firms ∗
The true fraction of firms in a market at time is and may reflect legacy firms, i.e. those above the ∗ current cutoff that entered when conditions were more favorable in the past but have not yet died. In this appendix we argue that if legacy firms are present then depending on what caused them they will either have no impact on our estimates or bias them towards zero. The true fraction is related to the model’s distribution of firms willing to enter at by = ( ) where
(
= 1 if ≥ max − all
= 1 + (1 − − )
( − )−( ) ( )
(39)
if max −
and (1 − − ) is the survival probability until time of firms that were present at the maximum cutoff period, say it is − . Then, our estimation equation in levels is ln
= ln ( ) + ln = + ln
where are the structural model variables that determine ln ( ). Writing this in changes and then adding an orthogonal error term, , we obtain ∆ ln = ∆ + ∆ ln + ∆ ln + = + + + + where and represent a set of industry and importer dummies; ≡ ∆ ln and is the log change in the subset of policy variables in that have time, industry and importer variation. Given the definition of the orthogonal term, , the only potential source for bias arises from the possible correlation between and conditional on and . Thus we can immediately see that if has either only industry or importer variation (or some linear combination of the two) there is no legacy bias. We now discuss what we think is the most relevant case and argue why this conditional correlation is zero. Suppose that afterµaccession the cutoff an historic high, so that post accession +1 = 1 and µ³ is at ¶¶ ´ − = − ln = − ln 1 + (1 − − ) − 1 . We now consider the following special cases for
variation in the cutoff before accession:
(a) only importer specific effects, such as favorable exchange rate or demand shocks. Then = since all industry specific terms in the cutoffs cancel out therefore the conditional correlation with is zero (b) only industry specific effects, such as fixed costs of entry to export in an industry. Then = and the same argument as above holds We also argue that if the source of the legacy was a policy variable then the legacy would bias estimates down, i.e. against finding any result. To see this note that in order for legacy to be caused by policy the model requires lower applied tariffs at some point − prior to the pre-accession year in 1985. This is very unlikely given that the EC-10 and Spain were implementing Tokyo Round reductions during this period.
59
Nonetheless suppose this occurs (and aggregate conditions and uncertainty are fixed) then à õ !! ¶− −1 − −1 = − ln = − ln 1 + (1 − − ) Assuming that post 1985 tariffs are below or equal to 1985 levels (+1 ≤ ) the legacy effect would generate a larger number of firms in that industry prior to accession. So when the tariffs fall with accession we see a relatively lower increase in number of firms in those industries with more legacy firms. Moreover, those are the industries with relatively higher initial tariffs (since they had to increase before 1985 to generate legacy) and thus larger tariff reductions (since all tariffs eventually went to zero). A similar argument holds for the uncertainty variable.
B.6
Aggregation to Total Exports
In this appendix we derive the estimating equation for total exports presented in the text and the expressions used to decompose the policy effects in Table 8. In the text we note that the total export value to a given country in an industry is ¢¤ £ ¡ ¯ × =
(40)
¯ ≡ − ˜ are obtained by averaging (4) over all exporting firms and with a where average sales ¡ ¢1− ¢ ¡ ¢ ¡ = Pareto, ˜ = −(−1) . Using , the cutoff expression and simplifying we obtain ln = ( − + 1) ln − ln + ln + ln − ln + ln + ln − ( − 1) ∙ ¸ 1 − + ( ) −+1 ln − ln + = −1 1 − + −1 where =
−+1 −1
(41)
ln (1−) + ln − ln + ln −(−1) + ln + ln .
The impact of removing uncertainty at initial tariffs on exports used in Table 8 is therefore ∙ ¸ 1 − + 0 (0 ) −+1 ln ln |1 − ln |0 = − −1 1 − + 0 The total impact of applied tariff changes under uncertainty is ∙ ¸ −+1 ln 1 =− 1− ln −1 1 − + ln
(42)
(43)
The leading term is the full elasticity of total exports to tariff changes and the term in brackets is the ln attenuation, which is equal to ln ln |0 0 ln |1 =0 , and is reported in Table 8. It is straightforward to show that the attenuation term is always between zero and one. To obtain the estimation equation (33) in the text, we take a first order approximation of the uncertainty term around = 0 and substitute that and the constructed measure ˜ in (41) to obtain ˜ + ln + + + + ˜ ln =
for each
(44)
where = − 1− ( − ( − 1)), = − −1 and the terms capture all the terms in defined above. If we then difference this equation we obtain (33).
60
References Aizenman, J. and Marion, N. P. (1993). Policy Uncertainty, Persistence and Growth. Review of International Economics, 1(2):145—63. Arkolakis, C. (2011). A Unified Theory of Firm Selection and Growth. Working Paper 17553, National Bureau of Economic Research. Arkolakis, C., Costinot, A., and Rodrìguez-Clare, A. New Trade Models, Same Old Gains? Economic Review. Forthcoming.
American
Baier, S. L. and Bergstrand, J. H. (2007). Do free trade agreements actually increase members’ international trade? Journal of International Economics, 71(1):72—95. Baier, S. L., Bergstrand, J. H., and Vidal, E. (2007). Free Trade Agreements In the Americas: Are the Trade Effects Larger than Anticipated? The World Economy, 30(9):1347—1377. Baldwin, R. (1988). 78(4):773—85.
Hyteresis in import prices: The beachhead effect.
American Economic Review,
Baldwin, R. and Krugman, P. (1989). Persistent trade effects of large exchange rate shocks. The Quarterly Journal of Economics, 104(4):635—54. Barro, R. J. (2006). Rare Disasters and Asset Markets in the Twentieth Century. Quarterly Journal of Economics, 121(3):823—866. Bernanke, B. S. (1983). Irreversibility, Uncertainty, and Cyclical Investment. The Quarterly Journal of Economics, 98(1):85—106. Bernard, A. B., Eaton, J., Jensen, J. B., and Kortum, S. (2003). Plants and Productivity in International Trade. American Economic Review, 93(4):1268—1290. Bernard, A. B. and Jensen, J. B. (1995). Exporters, Jobs, and Wages in US Manufacturing: 1976-87. Brookings Papers on Economic Activity: Microeconomics, pages 61—112. Bernard, A. B., Jensen, J. B., Redding, S. J., and Schott, P. K. (2007). Firms in international trade. Journal of Economic Perspectives, 21(3):105—130. Bloom, N. (2009). The Impact of Uncertainty Shocks. Econometrica, 77(3):623—685. Bloom, N., Bond, S., and Reenen, J. V. (2007). Uncertainty and investment dynamics. Review of Economic Studies, 74(2):391—415. Broda, C., Limão, N., and Weinstein, D. E. (2008). Optimal tariffs and market power: The evidence. American Economic Review, 98(5):2032—65. Burstein, A. and Melitz, M. J. (2011). Trade Liberalization and Firm Dynamics. Working paper, Harvard University. Bustos, P. (2011). Trade Liberalization, Exports, and Technology Upgrading: Evidence on the Impact of MERCOSUR on Argentinian Firms. American Economic Review, 101(1):304—40. Campa, J. M. (2004). Exchange rates and trade: How important is hysteresis in trade? European Economic Review, 48(3):527—548. Chaney, T. (2005). Productivity overshooting: The dynamic impact of trade opening with heterogeneous firms. mimeo, University of Chicago.
61
Chaney, T. (2008). Distorted Gravity: The Intensive and Extensive Margins of International Trade. American Economic Review, 98(4):1707—21. Constantini, J. and Melitz, M. (2008). The dynamics of firm-level adjustment to trade liberalization. In Helpman, E., Marin, D., and Verdier, T., editors, The Organization of Firms in a Global Economy, chapter 4, pages 107—141. Harvard University Press. Das, S., Roberts, M. J., and Tybout, J. R. (2007). Market entry costs, producer heterogeneity, and export dynamics. Econometrica, 75(3):837—873. Dixit, A. K. (1989). Entry and exit decisions under uncertainty. Journal of Political Economy, 97(3):620—38. Estevadeordal, A., Freund, C., and Ornelas, E. (2008). Does Regionalism Affect Trade Liberalization toward NonMembers? The Quarterly Journal of Economics, 123(4):1531—1575. Evenett, S., Gage, J., and Kennett, M. (2004). WTO Membership and Market Access: Evidence from the Accessions of Bulgaria and Ecuador. Staff report, Universitat St. Gallen. Frankel, J. A. (1997). Regional Trading Blocs. Institute for International Economics, Washington, DC. Goldberg, P. K., Khandelwal, A. K., Pavcnik, N., and Topalova, P. (2010). Imported Intermediate Inputs and Domestic Product Growth: Evidence from India. The Quarterly Journal of Economics, 125(4):1727—1767. Grinols, E. L. and Perrelli, R. (2006). The WTO Impact on International Trade Disputes: An Event History Analysis. The Review of Economics and Statistics, 88(4):613—624. Handley, K. (2011). Exporting Under Trade Policy Uncertainty: Theory and Evidence. Working Paper Series ERSD-2011-20, World Trade Organization. Hassett, K. A. and Metcalf, G. E. (1999). Investment with Uncertain Tax Policy: Does Random Tax Policy Discourage Investment? Economic Journal, 109(457):372—93. Helpman, E., Melitz, M., and Rubinstein, Y. (2008). Estimating trade flows: Trading partners and trading volumes. The Quarterly Journal of Economics, 123(2):441—487. IMF (2004). Exchange Rate Volatility and Trade Flows - Some New Evidence. Technical report, International Monetary Fund. Impullitti, G., Irarrazabal, A. A., and Opromolla, L. D. (2011). A Theory of Entry Into and Exit From Export Markets. Working paper, New York University. Irwin, D. A. (1994). The GATT’s Contribution to Economic Recovery in Post-War Western Europe. NBER Working Papers 4944, National Bureau of Economic Research, Inc. Jones, V. C. (2008). Generalized System of Preferences: Background and Renewal Debate. CRS Report for Congress RL33663, Congressional Research Service. Karacaovali, B. and Limão, N. (2008). The clash of liberalizations: Preferential vs. multilateral trade liberalization in the european union. Journal of International Economics, 74(2):299—327. Kee, H. L., Nicita, A., and Olarreaga, M. (2009). Estimating Trade Restrictiveness Indices. Economic Journal, 119(534):172—199. Kehoe, T. J. (2005). An evaluation of the performance of applied general equilibrium models of the impact of NAFTA. In Kehoe, T. J., Srinivasan, T. N., and Whalley, J., editors, Frontiers in Applied General Equilibrium Modeling, chapter 13, pages 341—377. Cambridge University Press, Cambridge, UK. Limão, N. (2007). Are preferential trade agreements with non-trade objectives a stumbling block for multilateral liberalization? Review of Economic Studies, 74(3):821—855. 62
Limão, N. and Tovar, P. (2011). Policy choice: Theory and evidence from commitment via international trade agreements. 85(2). Mansfield, E. D. and Reinhardt, E. (2008). International institutions and the volatility of international trade. International Organization, 62(04):621—652. Melitz, M. J. (2003). The impact of trade on intra-industry reallocations and aggregate industry productivity. Econometrica, 71(6):1695—1725. Pereira, A. M. and Andraz, J. M. (2005). Public Investment in Transportation Infrastructure and Economic Performance in Portugal. Review of Development Economics, 9(2):177—196. Perroni, C. and Whalley, J. (2000). The new regionalism: trade liberalization or insurance? Journal of Economics, 33(1):1—24.
Canadian
Pinheiro, M. et al. (1997). Sèries Longas para a Economia Portuguesa pòs II Guerra Mundial, Volume I Sèries Estatìsticas. Banco de Portugal, Lisboa. Roberts, M. J. and Tybout, J. R. (1997). The decision to export in colombia: An empirical model of entry with sunk costs. American Economic Review, 87(4):545—64. Rodrik, D. (1991). Policy uncertainty and private investment in developing countries. Journal of Development Economics, 36(2):229—242. Ruhl, K. J. (2008). The International Elasticity Puzzle. Working paper, NYU Stern. Sala, D., Schröder, P. J. H., and Yalcin, E. (2010). Market Access Through Bound Tariffs. Scottish Journal of Political Economy, 57:272—289. Trefler, D. (2004). The Long and Short of the Canada-U. S. Free Trade Agreement. American Economic Review, 94(4):870—895. U.S. International Trade Commission (2008). Andean Trade Preference Act:Impact on U.S. Industries and Consumers and on Drug Crop Eradication and Crop Substitution, 2007. Technical Report Publication 4037, United States International Trade Commission.
63
Table 1: Portuguese Export Growth Margins 1981-1990 (1)
(2)
(3)
Dependent variable (ln):
Exports
Number of Firms
Exports/firm
EC10×Post 86
0.232*** [0.0829]
0.451*** [0.0411]
-0.219*** [0.0710]
Spain×Post 86
1.146*** [0.199]
1.159*** [0.132]
-0.0129 [0.113]
Real Imp. GDP (ln)
1.045*** [0.306]
0.598*** [0.137]
0.447* [0.258]
Imp. Price Index (ln)
0.167** [0.0776]
0.0185 [0.0374]
0.148** [0.0655]
Exchange rate (ln)
0.211*** [0.0763]
-0.00118 [0.0365]
0.212*** [0.0653]
1305 0.92
1305 0.97
1305 0.75
Observations Adj R2
Notes: Includes dummies for country and year. Robust standard errors in brackets. *** p < 0.01, ** p < 0.05, * p < 0.1 Sample: Aggregate values to each country of destination where data is available. For variable definitions, sources and summary statistics see Appendix B.
Table 2: Summary statistics for firm-level baseline regressions Total
Spain
EC-10
Change in Number of Firms*
33.0 (55.1)
91.1 (62.6)
24.7 (48.7)
Change in Number of Varieties*
35.7 (60.7)
101 (69.1)
26.4 (53.3)
Change in Exports*
55.3 (157)
135 (150)
43.9 (155)
Pre Tariff** (Portugal)
3.13 (5.66)
7.89 (5.10)
2.45 (5.40)
Pre Tariff** (GATT)
8.67 (5.14)
14.1 (7.75)
7.95 (4.20)
Post Tariff** (Portugal)
1.74 (3.91)
1.33 (3.51)
1.79 (3.96)
Tariff Change** (Portugal)
-1.39 (2.90)
-6.56 (4.78)
-0.66 (1.44)
Applied Tariff Stand. Dev. Change***
-0.64 (1.25)
-2.86 (1.86)
0.33 (0.69)
Price Index Proxy Change***
-0.19 (0.88)
-1.52 (2.06)
0.00 (0.00)
NTM Share Change***
-2.32 (10.9)
-18.66 (25.4)
0.00 (0.00)
Specific Tariff Share Change***
-0.37 (2.80)
-3.01 (7.45)
0.00 (0.00)
Initial Uncertainty
15.5 (10.9)
16.0 (9.52)
15.4 (11.1)
Post Uncertainty
18.8 (10.8)
29.4 (15.0)
17.3 (9.08)
731
91
640
Proportion of Profits Lost if Preference Reversed
Observations
Notes: Sample means and standard deviations (in parentheses), all multiplied by 100. * 100 × ∆ ln(x) where x = {firms, varieties, exports}. **100 × ln(1 + t) where t is the advalorem rate; ”Pre tariff” is evaluated in 1985 (pre-accession); one measures Portugal’s preferential rate and the other tariffs faced by GATT members; ”Post Tariff” is the 1987 (post-accession) tariff faced by Portugal; ”Tariff Change” is a simple difference. *** See Appendix B for sources and additional details. Profit loss:1 − (τ0V /τhV )σ (assuming σ = 3). We normalize the loss measures in regressions by dividing it by σ − 1.
Table 3: Firm-product entry growth into EC-10 and Spain (by industry) (1) Dependent variable :
(2)
(3)
(4)
(5)
(6)
Change in (ln) Number of Firms
Initial Uncertainty (βγ0 > 0)
4.399** [1.772]
5.626** [2.756]
4.301** [1.810]
4.431** [1.788]
4.351** [1.839]
4.752** [1.854]
Applied Tariff Change (βτ < 0)
-3.006** [1.260]
-4.273* [2.271]
-3.072** [1.266]
-2.919** [1.247]
-3.113** [1.291]
-3.520*** [1.260]
Post Uncertainty (βγ1 ≤ 0)
-1.51 [3.277]
NTM Share Change
-0.166 [0.256]
Specific Tariff Share Change
-0.579 [1.034]
Applied Tariff SD Change
0.468 [4.144]
Price Index Proxy Change Observations R-squared No. of parameters AIC BIC
1.946 [2.066] 731 0.471 101 1083 1551
731 0.471 102 1085 1558
731 0.472 102 1084 1557
731 0.472 102 1084 1557
731 0.471 102 1085 1558
731 0.471 102 1084 1558
Notes: Structural parameters and expected sign in parentheses below regressor names. All specifications include country and industry effects. Clustered standard errors in brackets (industry×EC-10). *** p < 0.01, ** p < 0.05, * p < 0.1. Sample: Spain and EC 10 countries, 1987-1985. Assumes σ = 3. AIC and BIC denote Akaike and Bayes Information Criterion. See Supplementary Appendix Table 1 for summary statistics.
Table 4: Reversal, attenuation and entry estimates Value of σ =
2
3
4
0.36 (0.16)
0.39 (0.17)
0.42 (0.18)
Tariff elasticity attenuation factor
0.56
0.56
0.55
Entry growth, uncertainty removal (mean ω)
0.08
0.08
0.08
Entry growth, uncertainty removal (min ω)
0.24
0.24
0.24
Probability of Reversal (standard error)
Notes: We use the initial uncertainty estimate from Table 3 in calculations. Probability of reversal=
ˆ bγ0 σ 1−β , ˆ bτ σ−1 β
see Section 5.4, with s.e. obtained using delta method
(β = 0.85). Conditional on ph , the attenuation and theoretical uncertainty term U can be derived using regression estimates independently of β assumptions. We take ph = (Pr. reversal)0.5 and compute attenuation and entry growth at mean ω. The attenuation factor is the ratio of the entry elasticity to tariff changes at initial uncertainty relative to no uncertainty, see equation (28). We compute entry due to uncertainty removal as the log difference in the number of entrants at post vs. initial uncertainty using k × [ln(U1 ) − ln(U0 )] and assume post-uncertainty is removed, U1 = 1.
Table 5: Entry counterfactuals and quantification Total
Spain
EC
Uncertainty removal (at initial tariffs)
0.65
0.28
0.80
Tariff reduction (at initial uncertainty)
0.19
0.40
0.11
Complementarity
0.15
0.32
0.09
0.61
0.33
1.03
Share of predicted entry probability due to:
Share of predicted entry probability explained by policy
Notes: We use the initial uncertainty estimate from Table 3 in calculations (but results are similar if σ = 2, 4). Predicted average entry probability is the sum tariffs reductions, bτ ∆ ln τ , and removal of uncertainty at initial tariffs. Entry growth from uncertainty removal is the log difference in the number of entrants at post vs. initial uncertainty using k × [ln(U1 ) − ln(U0 )] (we assume post-uncertainty is removed, U1 = 1). Counterfactual shares of predicted entry hold initial tariffs and uncertainty fixed, respectively. The complementarity share captures the remaining entry growth from simultaneously reducing tariffs and uncertainty. The share of predicted entry probability explained by policy is the ratio of policy predictions relative to the one observed in the data.
Table 6: Value of exporting counterfactuals and quantification Total
Spain
EC
Uncertainty removal (at initial tariffs)
0.57
0.00
0.79
Tariff reduction (at initial uncertainty)
0.10
0.22
0.05
Complementarity
0.34
0.78
0.16
9.6
22
7.9
Share of predicted exporter value due to:
Predicted growth in average value of exporter (p.p.)
Notes: We use the initial uncertainty estimate from Table 3 to calculate the average growth in the value Πe (τ1 ,γ1 =0) of exporter as Π − 1, see equation (13) and section 5.4. Using the same formula, the e (τ0 ,γ0 ) share of uncertainty removal is computed with initial tariffs held fixed at τ0 followed by the share of tariff reductions with uncertainty held fixed at γ0 > 0. The complementarity share captures the remaining exporter value growth from simultaneously reducing tariffs and uncertainty.
Table 7: Probability of reversal robustness Sample
1987-1985
Dependent variable (ln), no. of:
1987-pre mean
varieties
firms
varieties
firms
Value of σ = 2
0.36
0.36
0.27
0.26
3
0.39
0.39
0.29
0.28
4
0.42
0.41
0.31
0.30
Notes: Assumes β = 0.85, for any other value of β, simply divide by 0.15/0.85 and multiply by the new (1 − β)/β. The 1987-1985 sample uses the growth between 1987 and 1985, which is the baseline. The 1987-pre mean sample uses the growth between 1987 and the average of the three years before the agreement: 83, 84, 85.
Table 8: Total exports counterfactuals and quantification Total
Spain
EC
Uncertainty removal (at initial tariffs)
0.59
0.23
0.75
Tariff reduction (at initial uncertainty)
0.28
0.53
0.17
Complementarity
0.13
0.24
0.08
0.87
0.72
0.96
Share of predicted total exports due to:
Share of predicted total exports explained by policy
Notes: Calculations use an initial uncertainty estimate from the total export regression where σ = 3 and the probability of reversal is estimated at 0.45, see section 5.6 and appendix (results are similar if σ = 2, 4). Average predicted total exports are the sum of the tariff reduction, Bτ ∆ ln τ , and the effect of uncertainty removal at initial tariffs. Total export growth from uncertainty removal is the log difference in exports at post vs. initial uncertainty using (k−σ+1)×[ln(U1 )−ln(U0 )] (we assume post-uncertainty is removed, U1 = 1). Counterfactual shares of predicted exports hold initial tariffs and uncertainty fixed, respectively. The complementarity share captures captures the remaining export value growth from simultaneously reducing tariffs and uncertainty. The share of total export growth explained by policy is the ratio of policy predictions relative to exports observed in the data net of the aggregate growth in number of Portuguese firms.