Near-infrared optical tomography: endoscopic imaging approach. Daqing Piao, Hao Xie, Cameron Musgrove, Charles F. Bunting, Weili Zhang,. Guolong Zhang ...
Invited Paper
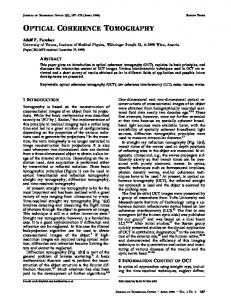
Near-infrared optical tomography: endoscopic imaging approach Daqing Piao, Hao Xie, Cameron Musgrove, Charles F. Bunting, Weili Zhang, Guolong Zhang, Ellen B. Domnick-Davidsion, Kenneth E. Bartels, G. Reed Holyoak, Oklahoma State University (USA) Sreenivas N. Vemulapalli University of Oklahoma Health Sciences Center (USA) Hamid Dehghani University of Exeter (United Kingdom) Brian W. Pogue Dartmouth College (USA) Abstract: Near-infrared optical tomography is an interesting technique of imaging with high blood-based contrast. Unfortunately non-invasive NIR tomographic imaging has been restricted to specific organs like breast that can be transilluminated externally. In this paper, we demonstrate that near-infrared (NIR) optical tomography can be employed at the endoscopescale, and implemented at a rapid sampling speed that allows translation to in vivo use. A spread-spectral-encoding technique based on a broadband light source is combined with light delivery by linear-to-circular fiber bundle, to provide endoscopic probing of multiple source/detector fibers for tomographic imaging as well as parallel sampling of all sourcedetector pairs for rapid data acquisition. Endoscopic NIR tomography is demonstrated by use of a 12mm diameter probe housing 8 sources and 8 detectors at 8 Hz frame rate. Transrectal NIR optical tomography by use of tissue specimen is also presented. This novel approach provides the key feasibility studies to allow this blood-based contrast imaging technology to be tried in cancer detection of internal organs via endoscopic interrogation. Keywords: Near-infrared optical tomography, endoscopic, trans-rectal, reconstruction
1. Introduction Near-infrared (NIR) optical tomography is a non-invasive diagnostic imaging technique. The advances in the applications of NIR tomography during the past two decades have demonstrated the potential of acquiring unique tissuespecific contrast with NIR interrogation and tomographic interpretation. The high contrast of NIR optical tomography originates primarily from the stronger light attenuation by hemoglobin relative to water in parenchymal tissue, as well as the distinct spectral differences of hemoglobin between the oxygenated and deoxygenated states. Contrast as high as ~300% has been demonstrated in NIR tomography for vascular densities of 2%, due to increased vascularity in malignant tissues [1]. The advantage of NIR tomography in terms of imaging the hemodynamic functions that are otherwise inconvenient to acquire has also been rigorously conveyed in the assessment of physiological conditions in brain as well as small joints [2, 3]. Although there is high NIR contrast, unfortunately non-invasive imaging by NIR has been restricted to specific organs that can be trans-illuminated externally. Breast is an excellent subject for NIR tomography because the tissue can be easily interrogated by direct contact with NIR sources/detectors. Breast imaging validation studies have shown high sensitivity and specificity based upon vasculature differences and multiple clinical trials are still ongoing [4-7]. The hypervasculature in present in tumors of other internal organs such as prostate, colon and rectum likely have similar high
Multimodal Biomedical Imaging II, edited by Fred S. Azar Proc. of SPIE Vol. 6431, 643103, (2007) · 1605-7422/07/$18 · doi: 10.1117/12.695217
Proc. of SPIE Vol. 6431 643103-1
tumor-tissue contrast in NIR imaging but the key factor in attempting these studies is the development of an appropriate applicator array. For the prostate, studies have focused on NIR measurement of optical properties in experimental prostate tumors in vivo [8] and human prostate [9], as well as surface measurements of implanted prostate tumors to quantify the hemodynamic changes [10]. All these studies have demonstrated that physical principles of NIR measurements can be used on internal organ tissues subject to new advantages and perhaps new challenges; however, these measurements are either non-localized or limited to the superficial area. If NIR measurements of internal organs can be performed in tomographic mode, it means 2-dimensional mapping of endogenous (and exogenous as well) at depths up to a few centimeters below the surface may be obtained non-invasively, which will provide new important contrast information on a distance scale similar to ultrasound. Consider the application of NIR tomography for prostate imaging as a specific and appealing direction, and obviously feasible approach is by trans-rectal approach, a new NIR tomgrpahy geometry that have not been previously investigated, to the best of our knowledge. The size of this trans-rectal NIR probe must be on in the one to two centimeter scale, similar to what has been developed for tomography of finger joints [3]. For the finger joint imaging, there is no difficulty of placing the fiber applicator exterior to the finger. For the endoscopic (transrectal) NIR tomography, however, many fibers have to be housed in the internal space of the seemly very-small probe. This presents a major instrumentation challenge for applying the NIR tomography transrectaly. The second challenge is the rapid imaging requirement for this technique to be clinically applicable. It is well known in NIR tomography that rapid imaging is difficult for there exist only a few systems of sampling faster than 1Hz [11, 12]. Rapid imaging, however, is first an issue of data acquisition, then an issue of image reconstruction. A third challenge for the NIR tomography in endoscopy (transrectal) geometry will be the forward modeling problem. In this paper, we introduce our efforts on demonstrating the NIR tomography in endoscopic imaging mode, with the emphasis on the instrumentation part.
2. Methods and System Development 2.1 Principle of spread-spectral-encoding based on single low coherence (broad-band) source for NIR tomography in endoscopy geometry The endoscopic NIR tomography has been implemented by modifying a rapid-imaging NIR technique. Optical signal contrast is extremely high, which means that in principle the measurements can be rapid and fast temporal changes in contrast can be imaged. Apart from the conventional fast source-switching technique and frequency multiplexing approaches, a spectral-encoding technique for video-rate imaging has been recently introduced. In this technique, the NIR source illumination is generated by multiple individual laser diodes, where the wavelength of each source is offset from the neighboring one a small number (around 1nm, as color-indicated in Fig. 1(a)). These sources are all allowed to be always on during the imaging, and in each detection channel the light is spread out spatially based upon the source wavelength separation, by passing the mixed detection signal through a spectrometer. The separated source-detector signals are then collected at the frame rate of the CCD camera, and the signal intensities are extracted for tomographic processing. This robust approach allows rapid parallel sampling of all sources at all detection locations. A direct Broadband light source
Individual light sources
2 3 4 5 6 7 8
22
22 24 25
/ —4• 2
26 22
Spectrograph
Spectrograph
A2 (a) (b) Figure 1. Schematic of spread-spectral-encoding technique. (a) Spectral-encoding of sources by individual laser diodes; (b) Spread-spectral-encoding by a single broad-band light source;
Proc. of SPIE Vol. 6431 643103-2
Implementation to endoscope-based imaging, however, is not so practical. In this approach, the spectrally separated laser sources are collimated and focused onto individual SMA-terminated fibers. Due to the fact that many separate fiber patch-cords from individual sources can hardly be packaged together in a small endoscope, it is virtually impractical to directly apply this design to endoscopic light delivery. Another shortcoming associated with the use of these individual light sources may be the requirement of setting and stabilizing the emission wavelengths of many laser diodes to achieve reliable spectral-encoding for accurate image reconstruction. Nevertheless, the design principle of this spectral-encoding technique indicates a feasible way of implementing endoscopic NIR tomography and also rapid imaging in this endoscopic geometry. Instead of using individual laser sources with slightly separated wavelengths, a single broadband light source, such as mode-locked Ti:sapphire laser or a superluminescent diode (SLD), can be used to develop a more convenient spread-spectral-encoding approach. As illustrated in Fig. 1(b), the emission of this broadband source can be dispersed (by a diffraction grating as seen in Fig. 2(a)) and collimated to a linear fiber bundle. The light coupled to each fiber within the fiber bundle serves as one source with wavelength slightly offset from the neighboring ones. The linear source fiber bundle then deliver the spread-spectral-encoded light to the endoscope probe, where the fiber bundle can be rearranged into circular geometry (see the inset of Fig. 3(c)). The light from circularly distributed fiber array will be reflected by a cone-prism 90° deflector (see Fig. 2(b)). A circularly deployed detector fiber array (not shown in Fig. 2(b)) is co-centric to the source fiber array, and the same 90° deflector can be used to collect the transmitted light from the tissue. The detected light can be delivered to the spectrometer where the fiber bundle becomes linear again to match the vertical entrance slit of the spectrometer, and the spread-spectral-encoded signals will be separated for parallel detection of all source-detector pairs. The combination of linear-to-circular fiber array with spread-spectral-encoding of the source renders parallel source delivery for endoscopic NIR tomography with fast sampling. A single broadband source is used in this method, which may also avoid the requirement of stabilizing the wavelengths and intensities of multiple source emissions as in previous method. This implies a less perturbation and fluctuation in the detected CW signal, which could potentially improve the reconstruction accuracy. Broadband source
Linear fiber bundle at proximal end
Circular fiber array
grating
bundle at distal end
(a)
(b)
Figure 2. Schematic of spread-spectral-encoding technique and the NIR light delivery to the endoscope probe. (a) A linear-to-circular fiber bundle can be used to deliver the spread-spectralencoded light from a broad-band source to an endoscope probe; (b) A cone-shape 90° deflector can be used to reflect the NIR source light circumferentially to achieve cross-sectional imaging. 2.2 Spread-spectral-encoding by single broad-band light source The use of a broad-band light source for spread-spectral-encoding is quite similar to the previous spread-encoding based on multiple LDs, however, it has to be validated first. We have used two types of broadband light source to test the concept of spread-spectral-encoding, including a mode-locked femtosecond Ti:sapphire laser (KML Inc.) at 800nm, and a superluminescent diode (Superlumdiodes Inc.) at 840nm, both with 40nm spectral bandwidth. For this testing purpose, we have used a circular imaging array that is identical to the previous work as is shown Fig. 3(a). The use of this array that having 8 source fibers and 8 detectro channels over a diameter of 27mm is to use the same data calibration and reconstruction routines as previously used.
Proc. of SPIE Vol. 6431 643103-3
The Ti:sapphire source with power more than 200mW provides video-rate data acquisition, and the SLD source at 21mW power offered much slower frame rate, however, with proper pixel binning and increasing the CCD gain, 5Hz was achieved. Approximately 10nm wide spectrum from each source was dispersed and coupled to the linear fiber bundle. We have used SLD source thereafter, for the sake of mobility to the animal facilities. Ti-sapphire lacer
Linear fiber array
Ae4 Source spectrum
Spectrum
coupled to the fibers
(a)
(b)
2800 2600
Intensity (A.U.)
2400 2200 2000 1800 1600 1400 1200 795
800
805 Wavelength (nm)
810
815
-IS
-10
0026
-6
003
IS
10
U
0036
004
0046
(c) (d) Figure 3. NIR tomography by spread-spectral-encoding. (a) Schematic of the system. (b) Indication of how the broad-band light is coupled to different fibers when dispersed. (c) Actual wavelength profile coupled to the linear fiber bundle by spread-spectral-encoding. (d) The image of an absorbing occlusion reconstructed from the signals acquired by spread-spectral-encoding. 2.3 Endoscopic (trans-rectal) mode NIR tomography by spread-spectral-encoding With the spectrum of the broad-band source dispersed and coupled to a linear fiber bundle validated for rapid NIR tomography, it is then the next step to validate the arrangement of fibers in our-ward imaging circular geometry with the use of a cone-lens for endoscopic imaging geometry, as shown in Fig. 4(a). Initially we have constructed a probe of 12mm in diameter by use of a 10mm cone-lens, which however, is expected to have limited imaging depth. Nevertheless, this probe is able to demonstrate the principle of endoscopic NIR tomography. As the depth of NIR interrogation is a related to the separation of the source and detector, a bigger size of NIR endoscopic imaging probe is necessary for sufficient imaging depth. However, due to the deployment of the probe in trans-rectal region, the size can not be too big. A 20mm probe will be a good comprise, as it is similar to the size of a standard trans-rectal Ultrasound probe that is familiar to both the physician and the patients. The 20mm TR-NIR probe we developed is detailed in Figure 4 (b) to (e). Sixteen fibers of 1.0mm core diameter are evenly spaced with source and detector channel intersperse with each other. Each fiber is parallel to the probe axis, and is
Proc. of SPIE Vol. 6431 643103-4
aligned to a 45° rod lens of 2mm diameter, to deflect the beam transversely for side-firing. A 2mm drum lens is then used to provide a sealed optical aperture for illumination as well as beam focusing, as shown in Fig. 2(b). The length of the probe is 7″. The size and length of this TR-NIR probe is very close to a standard trans-rectal ultrasound (TRUS) probe. Ti-sapphire laser
Crosssection
Cone prism
I
to.
Linear fiber array
2
AA
U.
I
A2 A0 +—
l200gr/mm grating
To Spectrometer
11.1
Spectrometer
12mm OD (a)
/
Drum lens
Source fiber
1Detector fiber
Drum lens
45° Rod lens 45° Rod lens
(b)
(c)
(d)
(e)
Figure 4. The endoscopic (transrectal) imaging system and the probe development. (a) a 12 mm probe). (a) Illustration of the fiber arrangement inside a 20 mm probe. (c) Each source/detector channel consists of a fiber, a 45° rod lens, and a drum lens. Light beam is delivered and focused transversely. (d) (e), photographs of the probe, where the probe dimension is shown with 20mm in diameter and 7” in length.
Proc. of SPIE Vol. 6431 643103-5
3.
Image reconstruction
For the NIR tomography in endoscopy (trans-rectal) imaging geometry with a particular application of prostate imaging in mind, the forward problem is apparently different then all the approaches investigated before. The difference originates from three aspects: (1) the array geometry is a hollow annular shape that the source/detectors are in the inner region of the targeted medium. For closer source-detector pairs, it is closer to a semi-infinite boundary, however, for source-detector that sis on the opposite side of the array, the photon path might not deep enough to sense the tissue medium. (2) the source-detector distances are comparable or smaller than 10 times of the mean scattering pathlength. (3) Shallow targets might need to be reconstructed. Therefore a diffusion approximation to the radiative transfer equation that is conventionally employed in NIR tomography may not valid anymore. Nevertheless, the diffusion approximation will be a good starting point to understand the qualitative aspects of this new imaging geometry. We thus incorporated a modeling package NIRFAST developed in Dartmouth College. As the program was developed for conventional NIR tomography systems where the fiber arrays have a ring geometry of imaging the internal volume, whereas in endoscopic NIR tomography the imaging geometry is flipped inside-out, a hollow-centered circular mesh becomes the first modification we need to implement to NIRFAST. Relevant modifications have been made to adjust the program in accordance with the endoscopic imaging geometry, however the diffusion approximation has been remained unaltered for the initial investigations. The forward problem based on frequency domain diffusion equation was solved by finite element method, and a Levenberg-Marquardt iterative solver is used for the inverse reconstruction of the absorption and scattering properties. Our system acquired DC data only currently, and the DC data is mapped to frequency-domain for the use of NIRFAST package.
Image reconstruction
Regu Geometry Endoscopic Geometry
63
65
Figure 5. The endoscopic (transrectal) imaging geometry and the necessary mesh for the forward/inverse problem.
4.
Numerical Simulation and Phantom Experiments
A series of simulations are performed to assess the achievable detection depth for 16 sources/detectors distributing in a 20mm diameter circular geometry. All the simulations used a homogeneous background of µa=0.002 mm-1 and µs′=0.5 mm-1 to match with the experimental use of 0.5% Intralipid solution. The abnormality or ‘blob’ was a 7.7mm diameter object with contrast of 100 and 3 over the background medium. For each contrast value of the abnormality, simulations were executed at four different depths of 5mm, 10mm, 13mm and 15mm, with 1% additive noise. Depth is measured from the center of the target to the surface of the probe. Figure 6 shows the results of the infinite absorbing target (100×). The simulation indicates that a strongly absorbing target with depth greater than 10mm may be imaged, but the
Proc. of SPIE Vol. 6431 643103-6
location of the target can not be accurately resolved, when NIRFAST is used directly. The other simulations show that for the target of 3× contrast, 5mm depth may be the limit of detection.
(a)
ID
ID
ID
(b)
ID
(c)
(d)
Figure 6. Simulation results by direct use of NIRFAST package for a 7.7mm blob of 100× contrast. (a) Target depth of 5mm. (b) Target depth of 10mm. (c) Target depth of 13mm. (d) Target depth of 15mm.
Phantom experiments have been conducted to validate the findings by numerical simulations. A 0.5% bulk Intralipid solution was set as the background. A black absorbing rod of 8mm diameter was considered the infinite absorbing target, and a 7.8mm diameter solid phantom of µa=0.0056 mm-1 and µs′=1.0 mm-1 was used for the 3× contrast target. A linear translation stage held the rod in parallel to the TR-NIR probe, and moved the rod away from the probe from 5mm depth at an increment of 1mm, up to 20mm. The reconstructed images in Figure 7 show that the strong absorbing target may be imaged at a depth greater than 13mm; however, the overall accuracy of depth localization is low. Similar experiments were repeated for the solid phantom of known µa and µs′. The images are shown in Figure 6, where the blob at depth of 5mm can be reconstructed. However, considerable artifacts appear for blob depth beyond 5mm. The phantom experimental results agree with the prediction by the numerical simulations.
(a)
(b)
(D)
(e)
(c)
Figure 7. Experimental results for a 8mm blob of black absorbing rod in a 0.5% Intralipid solution. (a) Target depth of 5mm. (b) Target depth of 10mm. (c) Target depth of 13mm. (d) Target depth of 15mm. (e) Target depth of 20mm.
Similar experiments were repeated for the solid phantom of known µa and µs′. The images are shown in Figure 6, where the blob at depth of 5mm can be reconstructed. However, considerable artifacts appear for blob depth beyond 5mm. The
Proc. of SPIE Vol. 6431 643103-7
phantom experimental results agree with the prediction by the numerical simulations, and both justify the need of a rigorous investigation of the forward modeling for this endoscopy NIR geometry.
(a)
(b)
(c)
Figure 8. Experimental results for a 7.8mm blob of ~3x contrast in a 0.5% Intralipid solution. (a) Target depth of 5mm. (b) Target depth of 9mm.
5.
Initial In Vivo Imaging
Along with the development of the system, we have also tested the feasibility of in vivo trans-rectal NIR tomography with approved animal model using healthy shelter dogs. 5.1 Animal model Five mixed-breed male dogs, ranging from 5 to 20 kg were employed for this initial study, which was approved by the Institutional Animal Care and Use Committee of Oklahoma State University. Animals were fasted for 12 hours, anesthetized, and maintained with inhalation anesthesia for the duration of this minimally invasive study (see Figure 9). The dogs were placed in right lateral recumbency. Digital examination and manipulation were used to evacuate remaining fecal material in the rectum. During this time, location of the prostate was ascertained through rectal palpation. TRUS imaging was then used to evaluate location and ultrasonic structure of the prostate prior to imaging with the TR-NIR probe. Prior to each imaging procedure, both the ultrasound and TR-NIR probes were liberally lubricated with a water-soluble medical lubrication material. After acquisition of images, dogs recovered uneventfully from anesthesia.
(a)
(b)
Figure 9. (a) Photograph shows the anesthetized dog and the TR-NIR probe before insertion. (b) Dog prostate identified by a planar transrectal ultrasound probe
Proc. of SPIE Vol. 6431 643103-8
5.2 Preliminary In vivo imaging results All in vivo imaging were performed at 0.25 seconds of acquisition for each frame. Figure 10 gives a set of 4 frames. The TR-NIR probe was translated axially after each frame acquisition, with the first frame taken at the prostate location. The location separations between the 4 images were approximately 1cm, 0.5cm, and 0.5cm. It is interesting to notice that the first three images show similar pattern, while the last image shows a different pattern of the higher absorption region. The ~1.5cm range that the first 3 images
(a)
(b)
(c)
(d) Figure 10. In vivo TR-NIR tomography of normal male dog. The probe was inserted with the prostate located at the upper half of the imaging field-of-view. The location separation between (a) and (b) is ~0.5cm, (b) and (c) is ~1cm, (b) and (d) is ~0.5mm.
covered may have interrogated partial of the 2 ~ 3cm length of the dog prostate and the last image may indicate that the TR-NIR probing has passed the prostate. The simulation and phantom experiments demonstrated that the reconstructed higher absorption target is more confined to the probe surface region, which may explain that the size of the higher absorbing region in the first 3 images is quite smaller than the dog prostate, if those areas were the prostatic tissue.
6.
Future Directions
The NIR tomography in endoscopy geometry has been demonstrated by use of a 12mm and a 20mm probe consisting of 8 source and 8 detection channels. However, the reconstruction is based on a not-co-accurate diffusion model for this trans-rectal geometry and relatively probe sizes. A thorough investigation on the forward problem by use of analytic and numerical methods would have to be embarked to achieve reliable image reconstruction. For the in vivo imaging, although there was TRUS employed, a coregistered or concurrent imaging guidance by TRUS was unavailable due to fact that TRUS and TR-NIR were conducted separately with one after the other. Therefore the imaging of prostatic tissue here by TR-NIR may not be fully justified. A next-step development may be integrating the TR-NIR probing with TRUS imaging, such that the TR-NIR imaging can be accurately correlated with the structural details provided by TRUS, but with specific tissue contrast. ACKNOWLEDGEMENT This work has been partially supported by a grant HR 06-171 from Oklahoma Center for the Advancement of Science and Technology (OCAST), and a startup fund from the Oklahoma State University College of Engineering, Architecture and Technology.
Proc. of SPIE Vol. 6431 643103-9
REFERENCES: [1]. B.W. Pogue, S.P. Poplack, T.O. McBride, W. A. Wells, K.S. Osterman, U.L. Osterberg, and K.D. Paulsen, “Quantitative hemoglobin tomography with diffuse near-infrared spectroscopy: pilot results in the breast,” Radiology, 218: 261-266 (2001). [2]. S.G. Diamond, T.J. Huppert, V. Kolehmainen, M.A. Franceschini, J.P. Kaipio, S.R. Arridge, D.A. Boas, “Dynamic physiological modeling for functional diffuse optical tomography,” Neuroimage. 30(1):88-101 (2006). [3]. A.K. Scheel, M. Backhaus, A.D. Klose, B. Moa-Anderson, U. Netz, K. G. Hermann, J. Beuthan, G.A. Müller, G.R. Burmester, A.H. Hielscher, "First clinical evaluation of sagittal laser optical tomography for detection of synovitis in arthritic finger joints," Ann. Rheumatic Diseas. 64: 239-245 (2005). [4]. M.A. Franceschini, K.T. Moesta, S. Fantini, G. Gaida, E. Gratton, H. Jess, W.W. Mantulin, M. Seeber, P.M. Schlag, and M. Kaschke, “Frequency-domain techniques enhance optical mammography: initial clinical results,” Proc. Natl. Acad. Sci. USA, 94(12):6468-6473 (1997). [5]. B.J. Tromberg, O. Coquoz, J.B. Fishkin, T. Pham, E.R. Anderson, J. Butler, M. Cahn, J.D. Gross, V. Venugopalan, D. Pham, “Non-invasive measurements of breast tissue optical properties using frequency-domain photon migration,” Philos. Trans. R. Soc. Lond. B 352:661-668 (1997). [6]. B.W. Pogue, S.P. Poplack, T.O. McBride, W. A. Wells, K.S. Osterman, U.L. Osterberg, and K.D. Paulsen, “Quantitative Hemoglobin Tomography with Diffuse Near-Infrared Spectroscopy: Pilot Results in the Breast,” Radiology 218: 261-266 (2001). [7]. Ntziachristos V, Yodh AG, Schnall MD, Chance B. “MRI-guided diffuse optical spectroscopy of malignant and benign breast lesions.” Neoplasia. 4(4):347-54 (2002). [8]. Arnfield MR, Chapman JD, Tulip J, Fenning MC, McPhee MS.(1993) “Optical properties of experimental prostate tumors in vivo.” Photochem Photobiol.; 57(2):306-11. [9]. Zhu TC, Dimofte A, Finlay JC, Stripp D, Busch T, Miles J, Whittington R, Malkowicz SB, Tochner Z, Glatstein E, Hahn SM. (2005) “Optical properties of human prostate at 732 nm measured in mediated photodynamic therapy.” Photochem Photobiol.; 81(1):96-105. [10]. Goel, M., H. Radhakrishnan, Liu H., et al. (2006). "Application of near infrared multi-spectral CCD imager system to determine the hemodynamic changes in prostate tumor." OSA Biomedical Topical Meetings: SH10, Fort Lauderdale, FL, 2006. [11]. C.H. Schmitz, M. Löcker, J.M. Lasker, A.H. Hielscher, and R.L. Barbour, “Instrumentation for fast functional optical tomography,” Rev. Sci. Instr. 73(2): 429-439 (2002). [12]. Piao D, Jiang S, Srinivasan S, Dehghani H, and Pogue BW, “Video-rate near-infrared optical tomography using spectrally-encoded parallel light delivery,” Optics Letters, 30: 2593-2595 (2005).
Proc. of SPIE Vol. 6431 643103-10