This article has been accepted for publication in a future issue of this journal, but has not been fully edited. Content may change prior to final publication. Citation information: DOI 10.1109/TSC.2014.2312912, IEEE Transactions on Services Computing
1
Network Aware Scheduling for Virtual Machine Workloads with Interference Models Sam Verboven, Kurt Vanmechelen and Jan Broeckhove Abstract—Modern data centers use virtualization as a means to increase utilization of increasingly powerful multi-core servers. Applications often require only a fraction of the resources provided by modern hardware. Multiple concurrent workloads are therefore required to achieve adequate utilization levels. Current virtualization solutions allow hardware to be partitioned into Virtual Machines with appropriate isolation on most levels. However, unmanaged consolidation of resource intensive workloads can still lead to unexpected performance variance. Measures are required to avoid or reduce performance interference and provide predictable service levels for all applications. In this paper, we identify and reduce network-related interference effects using performance models based on the runtime characteristics of virtualized workloads. We increase the applicability of existing training data by adding network-related performance metrics and benchmarks. Using the extended set of training data, we predict performance degradation with existing modeling techniques as well as combinations thereof. Application clustering is used to identify several new network-related application types with clearly defined performance profiles. Finally, we validate the added value of the improved models by introducing new scheduling techniques and comparing them to previous efforts. We demonstrate how the inclusion of network-related parameters in performance models can significantly increase the performance of consolidated workloads. Index Terms—Virtualization, Xen, Profiling, Performance Modeling, Support Vector Machines, Scheduling
F
1
I NTRODUCTION
V
IRTUALIZATION has become a widespread technology used to abstract, combine or divide computing resources in order to allow resource requests to be described and fulfilled with minimal dependence on the underlying physical hardware. Using virtualization, an application and its execution environment can be managed as a single entity, a virtual machine (VM) [1], of which the configuration can be captured in a single file, a virtual machine image. These virtual machine images can be deployed in a hardware-agnostic manner on any hardware that hosts a compatible hypervisor or Virtual Machine Monitor. The hypervisor is a software component that hosts virtual machines, also referred to as guests. This software layer abstracts the physical resources from the virtual machines by providing a virtual processor and other virtualized versions of system devices such as I/O devices, storage, memory, etc. [2], [3]. Hypervisors thereby offer flexibility in partitioning the underlying hardware and ensure some degree of isolation between the different virtual machines sharing these resources. Although the hypervisor provides adequate isolation on many levels (e.g. security, faults, ...) performance interference can still be an issue, particularly with resource intensive workloads [4]. Each virtual machine is allocated a subset of the available resources and requires • S. Verboven, K. Vanmechelen and J. Broeckhove are associated with the Department of Mathematics and Computer Science, University of Antwerp, 2020 Antwerp, Middelheimlaan 1 E-mail:
[email protected]
the hypervisor’s cooperation to complete certain tasks (e.g. disk or network I/O). When multiple VMs share the same hardware, bottlenecks can occur both on the hardware as well as the hypervisor level. Resource contention problems will likely become even more important in the future as more VMs share the same hardware in an effort to increase utilization. The evolution towards an ever increasing amount of CPU cores per server and relatively slower gain in I/O performance further highlight the need to proactively address performance interference. Improvements in VM scheduling and the reduction of virtualization overhead can partially mitigate these issues. In the context of data centers, where VMs can be easily migrated between hosts, the problem can be addressed at a higher level through intelligent scheduling. This approach requires more insight in the resource consumption of individual workloads and their impact on other workloads. By identifying potential sources of performance interference, more informed scheduling decisions can be made that reduce the impact of resource contention. Thereby allowing more VMs to be collocated on the same hardware while providing more predictable performance. In previous work [5], we improved application performance using interference aware scheduling techniques based on slowdown prediction models and application classification. We demonstrated that these models can be used to greatly reduce interference effects and improve overall performance. However, the profiled system-level characteristics were limited to CPU, cache and disk metrics. In this paper, we extend the proposed approach to identify and reduce performance interference using network-oriented applications.
1939-1374 (c) 2013 IEEE. Personal use is permitted, but republication/redistribution requires IEEE permission. See http://www.ieee.org/publications_standards/publications/rights/index.html for more information.
This article has been accepted for publication in a future issue of this journal, but has not been fully edited. Content may change prior to final publication. Citation information: DOI 10.1109/TSC.2014.2312912, IEEE Transactions on Services Computing
2
We validate the general applicability of our prediction and classification approach by analyzing the performance interference effects of network-based resource consumption. We significantly increase the previously used set of training data by adding multiple benchmark profiles with variable network resource usage. Adding these benchmarks allows us to create a comprehensive training set that can be used to validate the modeling and classification approach. Adding a new potential source of performance interference also requires the monitoring of new performance metrics. These additional metrics create new dimensions in the performance profiles used for both modeling and classification of workloads. The main research question in this paper can be split into two parts. First, does the increase in the performance model dimensions significantly affect model accuracy? Second, are these new metrics sufficient to automatically classify useful network-related application types? To answer these questions, we use the extended application profiles and training data to evaluate both modeling and classification accuracy. Our contributions can be summarized as follows: •
•
•
We evaluate performance prediction using existing modeling techniques and a new hybrid approach combining both Weighted Means and the previously introduced Class SVM technique [5]. By exploiting the complementary nature of the prediction errors produced by each technique, we are able to further increase model accuracy. We adopt K-means clustering to automatically define and analyze network-based application types which have distinct behavior under contention. In particular, we are able to automatically detect and quantify the disproportionate impact caused by streaming network applications. We validate the performance analysis results using scheduling experiments. Two novel scheduling techniques are introduced to determine the potential benefits of combining accurate application classification with prediction models. Our approach significantly and consistently lowers the average application slowdown for all tested configurations.
The remainder of this paper is organized as follows: Section 2 discusses existing work and recent developments with a focus on virtualized network I/O. An overview of the performance modeling approach is described in Section 3. Section 4 details the extended set of metrics gathered when profiling benchmarks. In Section 5 we describe the new benchmark configurations, the methods used to create performance profiles, and our experimental setup. Existing and new modeling techniques are evaluated in Section 6, followed by the identification of new application types in Section 7. An evaluation of the performance models using novel scheduling algorithms is discussed in Section 8. Section 9 presents several candidates for future work. Our final conclusions can be found in Section 10.
2
R ELATED W ORK
In this section, we provide an overview of the research concerning virtualized I/O performance. Additionally, a summary of the work related to general performance interference in virtualized environments is also presented. 2.1
Virtualized I/O
In the past, hypervisors have had a strong focus on fair scheduling with regards to computationally intensive workloads. I/O scheduling was often seen as a secondary concern, resulting in sub optimal performance for I/O-intensive workloads. Mixing computeintensive workloads with bandwidth-intensive and latency-sensitive workloads can result in significant performance degradation. Ongaro et al. [4] studied the impact of several hypervisor scheduler configurations on performance interference. Their Xen-based study shows that the current VMM schedulers do not achieve the same level of fairness for I/O-intensive workloads as they do for compute-intensive workloads. Aragiorgis et al. [6] argue that concurrent VM hardware accesses can be optimized with new scheduling concepts. Taking into account the complexity of designing and implementing a universal scheduler, they focus on a system with multiple scheduling policies that coexist and service VMs according to their workload characteristics. However, their validation is limited to multiplexing network I/O and CPU-intensive workloads. Shadi et al. [7] demonstrated that different combinations of disk schedulers in both the hypervisor and the VMs can also greatly influence the performance of I/O-intensive workloads. They propose a novel approach for adaptive tuning of the disk schedulers at both scheduling levels. Our approach takes a higher level view and tries to reduce the opportunities for interference. Although many opportunities exist to improve scheduling fairness, aggregated performance can be further increased by optimally distributing workloads across physical machines. Lloyd et al. [8] used physical and virtual machine resource utilization statistics to build performance models. They evaluated eighteen individual resource utilization statistics by predicting service execution time using several modeling approaches. They concluded that the strength of individual predictors depends greatly on the evaluated application profile. Most notably, they found that CPU idle time and the number of context switches were good predictors for I/O bound applications. Their objective was to predict which application components could be combined in a single VM to provide optimal performance while requiring the fewest number of VMs. In contrast, our approach focuses on providing detailed VM-level performance profiles to optimize data center scheduling. Considerable work is also being performed on indepth analysis of the causes and effects of performance interference in various consolidation scenarios [9], [10], [11]. Pu et al. [9] performed extensive experiments to
1939-1374 (c) 2013 IEEE. Personal use is permitted, but republication/redistribution requires IEEE permission. See http://www.ieee.org/publications_standards/publications/rights/index.html for more information.
This article has been accepted for publication in a future issue of this journal, but has not been fully edited. Content may change prior to final publication. Citation information: DOI 10.1109/TSC.2014.2312912, IEEE Transactions on Services Computing
3
measure performance interference on CPU and network I/O bound VM workloads. They found that networkintensive workloads can incur high overheads due to extensive context switches. They also concluded that multiplexing CPU and network-intensive workloads results in relatively low amounts of performance degradation. Wang et al. [10] measured processor sharing, packet delay, TCP/UDP throughput and packet loss among Amazon EC2 VMs. Their results demonstrated that despite the light network utilization, virtualization still causes significant throughput instability and abnormal delay variations. Mei et al. [11] present a detailed analysis of the different elements responsible for performance interference. They also investigated the impact of different CPU resource scheduling strategies and varying workload rates on the performance of consolidated VM workloads. Their results suggest that significant performance gains can be made by strategically multiplexing correct application types. Performance isolation can also be influenced by hypervisor implementation differences. Hwang et al. [12] performed an extensive performance analysis, comparing four popular virtualization platforms; Hyper-V, KVM, vSphere and Xen. They found that the overheads incurred by each hypervisor can vary significantly depending on the application type and the resources assigned to it. Network interference was measured using the HTTP response time while simultaneously stressing CPU, memory, disk, and network resources with different benchmarks. Xen was observed to be particularly sensitive to memory and network interference. Dramatic differences were also found in the performance isolation provided by different hypervisors. Attempts to reduce network I/O interference have also resulted in hardware solutions [13]. Dong et al. explain the architectural, design and implementation considerations for Single Root I/O Virtualization in Xen. They present a specification that allows a PCIe device to present itself as a separate physical PCIe device for each VM. 2.2 Performance Interference One of the efforts closely related to our current approach can be found in [14]. Koh et al. consider the impact of performance interference on competing applications in a virtualized environment. They collect various system-level workload metrics and perform both application clustering as well as slowdown prediction using two concurrent VMs. Our approach differs in four major aspects. First, their experimentation was limited to two VMs on a dual-processor machine. Second, their regression analysis was limited to basic linear regression, which they show to be less accurate than Weighted Means. We have extended our modeling to non-linear regression efforts by using Support Vector Machines. Third, they do not take into account interference caused by network I/O. Finally, we also investigate how scheduling decisions can be improved through the application of performance interference models.
Considerable work is also being performed on analyzing the performance characteristics of representative server consolidation workloads [15], [16], [17], [18], [19]. In [15] Casazza et al. introduce vConsolidate, a benchmark that uses applications often found in virtualized data centers. It consists of a compute intensive workload, a web server, a mail server and a database application running simultaneously on a single platform. Unfortunately vConsolidate development and maintenance has ended and external publication of results is no longer allowed. Due to the reliance on a small set of predetermined applications, it would not have been suitable to validate the techniques proposed in this paper. A large body of research has focused on managing virtualized application performance using fine-grained allocation of VM resources [20], [21], [22], [23], [24], [25]. Whereas our approach uses virtual environments with fixed resource allocations, these works focus on dynamically reconfiguring the resources allocated to a VM in response to application requirements. Attempts have also been made to increase the performance isolation between virtual machines. Gupta et al. [26] implemented XenMon to monitor per VM resource usage, including the work done in separate device driver domains (DDD). Their approach differs from our solution since it only takes into account interference caused by CPU contention. In summary, related work has identified several factors causing performance interference and provided solutions at the server level. Our approach is unique in that it combines accurate performance prediction and classification to mitigate interference at the data center level. By adding detailed application profiles to the scheduling process, we reduce resource contention and interference without hypervisor modifications.
3
A PPROACH
In this section, an overview is given of the challenges faced when modeling our problem domain and the solutions devised to address these problems. The approach described in this paper is a compromise that creates an accurate and useful model while also having a reasonable and repeatable method for obtaining the required data. Building a performance model requires a representative set of applications, resulting in a large set of benchmarks which must be repeated for each new hardware configuration. Server hardware is also evolving towards systems containing many CPUs that are capable of supporting large amounts of concurrent VMs. Given the large application set and the increasing amount of VMs that can be co-scheduled, it is clear that benchmarking all possible configurations is not feasible. A subset of benchmarks is required that can provide a useful model while only requiring a fraction of all possible setups to be considered. To model the impact VM workloads have on each other, a measure is needed that captures the sensitivity
1939-1374 (c) 2013 IEEE. Personal use is permitted, but republication/redistribution requires IEEE permission. See http://www.ieee.org/publications_standards/publications/rights/index.html for more information.
This article has been accepted for publication in a future issue of this journal, but has not been fully edited. Content may change prior to final publication. Citation information: DOI 10.1109/TSC.2014.2312912, IEEE Transactions on Services Computing
4
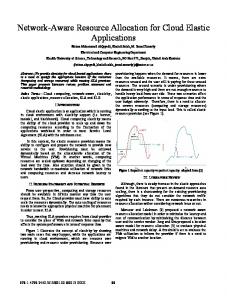
Fig. 1. Schematic overview of the steps involved in the performance modeling approach.
sults from an extensive benchmark suite are analyzed to acquire performance scores and metrics for the desired platform. This data is then transformed into a predictive model and application clusters are defined. It is important to note that acquiring the initial training data needed for the performance analysis can be relatively time consuming. Fortunately, profiling an unknown application can be done in mere minutes. When a workload requires scheduling, the first step is to gather the required performance metrics. Using this data, performance under contention is predicted and the application type determined. For applications with volatile resource requirements, the profiling can be repeated periodically if needed. Finally, the information is added to the scheduler who can use it to determine an efficient placement for all VM workloads.
4 of the workload to increased amounts of resource sharing. Depending on the type of resources being shared, there can be large differences in the performance impact [5]. For example, scheduling a CPU-limited and disklimited application together will likely have a relatively low impact on performance. A method is needed to automatically determine the application type and which workloads are most suited for co-scheduling. To measure the impact of resource sharing, all applications are benchmarked in a linear scaling scenario where slowdown is measured by multiplexing VMs with identical workloads. Interference is likely to be highest when applications use similar resources, providing an upper bound on the performance degradation due to interference. A base measurement is taken when running a single VM workload. The amount of concurrent workloads is then increased to one fewer than the amount of physical CPU cores. Using the measurements from these benchmarks as training data, models can be built to predict the maximum slowdown of unknown application profiles. Each profile consist of several metrics describing the usage of CPU cycles, context switches, L2 cache hit rate, disk usage and network I/O. Performance predictions can be made using the base measurements and the performance scores recorded for high degrees of workload parallelization. To determine the impact of application types on resource contention, application clusters are formed grouping similar application profiles. To analyze these clusters, all applications are benchmarked in a pairwise manner. The clusters can be used to easily identify new applications and to determine the relationship between groups. A ranking can be made using the average slowdown incurred when members of different clusters are executed together, providing an indication of the applications most suitable for co-scheduling. A schematic overview of the separate steps in the proposed approach can be found in Figure 1. The re-
P ROFILING
To ensure accurate descriptions for a diverse set of applications, each profile contains a comprehensive set of system-level characteristics. Network related metrics are obtained using the vnStat package. XenBaked is used to record additional VM scheduling details. Xenoprof and Iostat provide the cache and disk metrics. VnStat is used to retrieve network I/O statistics from the paravirtualized guest kernels. For our experiments, we monitor averages for the following network metrics: received and transmitted throughput (rMB/s and tMB/s) and packages per second (rPackets/s and tPacket/s). A modified version of XenBaked [5] is used to keep records for each VM’s virtual CPU e.g. cycles gotten and blocked. To improve the application profiles, VM switches per second are also monitored using XenBaked. The decision to include this parameter is based on the conclusions by Lloyd et al. [8]. A VM switch occurs whenever a virtual CPU is allocated a physical CPU core. Large amounts of switches can be used to determine the amount of times a VM needs to relinquish control to the hypervisor. When modeling VM performance for network applications, this can be an important parameter during classification [9]. Xenoprof is an extension to OProfile [27] which uses built-in CPU performance counters to obtain data about executing applications and processes. Xenoprof interfaces with the Xen hypervisor to set counters and attribute events to separate VMs. This information is used to calculate the L2 cache hit/miss ratio for each VM. The Iostat tool is used to retrieve disk I/O statistics from the paravirtualized guest kernels. Averages are recorded for the following disk metrics: read and writes per second (r/s and w/s), read and write throughput per second (rMB/s and wMB/s), average time for I/O requests issued to the device to be served (await) and amount of time the disk was busy servicing I/O requests (%util). An overview of the profiled parameters can be found in Table 1.
1939-1374 (c) 2013 IEEE. Personal use is permitted, but republication/redistribution requires IEEE permission. See http://www.ieee.org/publications_standards/publications/rights/index.html for more information.
This article has been accepted for publication in a future issue of this journal, but has not been fully edited. Content may change prior to final publication. Citation information: DOI 10.1109/TSC.2014.2312912, IEEE Transactions on Services Computing
5
TABLE 1 Extended overview of the metrics obtained from profiling. Metric gotten blocked hit/miss dr/s dw/s drMB/s dwMB/s await %util switches rMB/s tMB/s rPackets/s tPackets/s
5
Measurement Percentage of CPU cycles used for processing Percentage of CPU cycles spent idle or waiting on an event Percentage of L2 cache requests that missed Average disk reads per second Average disk writes per second Average disk read throughput in MB per second Average disk write throughput in MB per second Average time needed for disk I/O requests to be served Percentage of time the disk spent servicing I/O requests Average switches to a new physical CPU per second Average network receive throughput in MB per second Average network transmit throughput in MB per second Average packets received per second Average packets transmitted per second
B ENCHMARKING
We extend the previously used application set [5] by adding five applications with a significant network resource requirement. The original benchmarking platform was built using Linpack [28], httperf [29], a modified version of Sysbench [30] and a subset of the benchmarks found in the Phoronix Test Suite [31] v3.0.1. The chosen applications provided an even mix between different non-network based workload types. To add a broad range of network resource usage patterns we use multiple configurations of the following benchmarks. Two web server benchmarks (ApacheBench and Httperf ) and two synthetic bandwidth benchmarks (Nuttcp and Netperf ). The limited amount of applications is extended by taking advantage of the configurability of each benchmark to create multiple data points. To add an application using a mix of network and other recourses, we use a rate limited version of Sysbench to benchmark a VM hosting an SQL database. An overview of the selected applications can be found in Table 2. The web server benchmarks are tested by issuing requests with file sizes of 1kb, 10kb, 100kb and 1Mb. Additionally, a test requesting a PHP page executing phpinfo() is added to generate more CPU usage. The synthetic bandwidth benchmarks are tested by hosting the server component on either the profiled VM or the corresponding test client. This allows us to easily gather profiles for both sending and receiving network data. Nuttcp is only used as a TCP streaming benchmark. Netperf profiles are made for TCP streaming and both TCP and UDP Response/Request (RR) benchmarks. Sysbench is used to remotely benchmark both a read only and a read/write SQL database. As these benchmarks only provide us with data for resource limited applications, we add a variety of rate limited benchmarks. An overview of the rate limited configurations used for the network benchmarks can be found in Table 2. The addition of these benchmarks creates a large and diverse range of applications taxing all important resources. To our knowledge, the presented training set significantly surpasses any previous efforts evaluating performance
models for virtualized workloads. Each benchmark was profiled in isolation and in parallel for a minimum of ten minutes. If benchmarks had different runtimes, the shorter applications were restarted until the longest running application was finished. Each benchmark was repeated a minimum of three times per profiling run. As some long running applications require initial start up procedures e.g. creating test files, some coscheduled workloads can have performance variances depending on the starting time. If needed, restarting the application continued until the relative standard deviation of the results was lower than 3.5%. Results are obtained using Xen 4.0 with a 2.6.32.24 Linux kernel. All VMs are configured with 1GB RAM using disk images mounted via blktap2. To facilitate the interpretation of the results all VMs are issued a single vCPU. The benchmarking platform consists of dual Intel Xeon L5335 quad-core CPUs, 16GB RAM and a WDC WD2500YS hard drive (7200rpm, 16MB cache). All servers are connected to a single dedicated gigabit Ethernet swich, and share the same subnet. The switch was isolated from external network traffic and each port was configured to receive full bandwidth. No specific measures, such as the use of VLANs, were taken to constrain the bandwidth available to a specific (virtual) machine connected to the switch. We therefore focus on evaluating whether the proposed modeling techniques successfully account for network-related interference, irrespective of it being caused by a suboptimally configured sharing mechanism or the lack of such a mechanism.
6
M ODELING
In this section, we evaluate several modeling techniques using two new sets of training data. In particular, we investigate the potential impact of adding network-related metrics and application profiles on model accuracy. After analyzing the prediction results, we present a new approach using a combination of existing models. All data is gathered with the previously introduced benchmarking platform. Each data point in the training data consists of an application profile and a performance
1939-1374 (c) 2013 IEEE. Personal use is permitted, but republication/redistribution requires IEEE permission. See http://www.ieee.org/publications_standards/publications/rights/index.html for more information.
This article has been accepted for publication in a future issue of this journal, but has not been fully edited. Content may change prior to final publication. Citation information: DOI 10.1109/TSC.2014.2312912, IEEE Transactions on Services Computing
6
TABLE 2 Overview of the network applications and the different benchmarked configurations. Name ApacheBench Httperf Nuttcp Stream Netperf Stream
Measurement HTTP web server performance HTTP web server performance TCP bandwidth performance TCP bandwidth performance
Netperf RR
TCP and UDP request/response performance
Sysbench
Remote database server performance
score. Profiles contain a set of measurements corresponding to the metrics in Table 1, collected by monitoring the application in isolation. Performance scores are recorded for a parallelization level of seven, benchmarking seven identical concurrent workloads. Predicting slowdown for high levels of parallelization can provide an estimate for the maximum slowdown on the target platform. Previous research revealed that there are no significant differences between the relevant parallelization level. Therefore, predictions are only presented for a scaling factor of seven concurrent workloads. Scores are normalized to one, the result from a standalone run on the test platform; e.g. a performance score of 2 corresponds to an application that is two times slower. When a training set contains multiple profiles created using a single rate limited application, these configurations are all removed when training a model to predict the performance of this application. Cross-validation is used to separate the training and validation data. The training data and model inputs and output can be described as follows: Training data: Each model is trained using a set of application profiles and the associated slowdown scores. Input: An application profile for which a performance score is to be predicted. Output: A predicted slowdown score. 6.1
Techniques
We compare several prediction techniques: Weighted Means (WM) [14], Linear Models (LM) [24], Generalized Linear Models [32] and Support Vector Machines (SVM) [33]. Details about these techniques can be found in previous work [5]. In this section, we only describe the updated and new techniques. The Class SVM modeling approach is modified to make better use of the extended training data. Additionally, we also present the results from a new hybrid approach that combines Weighted Means and the Class SVM model. 6.1.1 Class SVM Class SVM is a modeling approach that combines classification and prediction. Class SVM uses the classification capabilities of SVM to accurately identify applications which are insensitive to performance interference. Predictions are therefore only required for applications that are likely to exhibit slowdown. Previous experiments indicated that prediction errors are lower when limiting
Rates Unlimited only Unlimited and 1, 5, 50, 150, 300 requests/s Unlimited and 50, 100, 200, 500 Mbps limit Unlimited and 100 ms bursts with 500, 1000 and 2000 ms waits Unlimited and 100 ms bursts with 50, 100, 200, 500, 1000 and 2000 ms waits Unlimited and 10, 30, 50, 70, 100 requests/s
the training data for the prediction model to application profiles with measurable slowdown. This effect is no longer present when we extend the training data by significantly increasing both the amount of applications and profiled metrics per application. As a result, we now use the entire set of training data for both classification and modeling. 6.1.2 Hybrid Model Detailed analysis of the Weighted Means and Class SVM models indicates that a complementary approach can lead to improved results. To test this hypothesis we create a hybrid scheduler, utilizing the predicted slowdown scores of both models. The first step uses an SVM-based binary classification model to identify all applications unlikely to suffer slowdown. The second step generates both a WM- and SVM-based slowdown prediction for the remaining applications. An ensemble model is created by using the average of both values. The complementary results reduce the prediction errors for applications without slowdown as well as improve results for applications with significant slowdown. 6.2
Application Sets
We evaluated all techniques using the following sets of training data. T1 : High Resource Requirement (HRR) Only - this set contains all the benchmarks listed in Table 2 and the benchmarks introduced in [5]. All benchmarks in Table 2 are profiled using the unlimited rates. Combining all benchmarks and configuration options results in a total of 50 applications. We use this set for the initial evaluation because its members tax all resources which can limit workload performance. All benchmarks have high resource requirements and tax a single resource or combination thereof to obtain a performance score. T2 : T1 + Rate Limited - new applications are added using rate limited versions of the Sysbench disk and OLTP benchmarks and the rate limited configurations found in Table 2. Test configurations are selected to ensure an even distribution across the entire resource usage spectrum. The additional training data allows the modeling techniques to determine the tipping point
1939-1374 (c) 2013 IEEE. Personal use is permitted, but republication/redistribution requires IEEE permission. See http://www.ieee.org/publications_standards/publications/rights/index.html for more information.
This article has been accepted for publication in a future issue of this journal, but has not been fully edited. Content may change prior to final publication. Citation information: DOI 10.1109/TSC.2014.2312912, IEEE Transactions on Services Computing
7
where slowdown first starts to occur. Adding these rate limited benchmarks brings the total amount of applications in the set to 142. Details about the configuration of the network-based benchmarks can be found in Section 5.
The linear models result in both over- and underestimates across all application types. Although WM is clearly the superior option in this scenario, improved training data is required for a robust model. WM Measured Value
16
0.24
Slowdown
Train and evaluate using T1 Train using T2 and evaulate using T1 Train and evaluate using T2
8
4
4
2
2
1 0.16
1 0
0.08
0.04
20
40
GLM Measured Value
16
0.12 Slowdown
Average relative error
0.2
8
4
4
2
2
GLM
SVM
Class SVM
WM
Prediction technique
20
40
Class SVM Measured Value
16 Slowdown
Fig. 2. Relative prediction errors for each modeling approach using LOOCV.
4
4
2
2
20
40
Hybrid Measured Value
16 8
1 0 20 40 Applications sorted by slowdown
Results
0
20 40 Applications sorted by slowdown
Fig. 3. Error distribution using applications from T1 for both training and evaluation using LOOCV.
WM Measured Value
Slowdown
16
8
4
4
2
2 1 0
Slowdown
20 40 60 80 100 120 140 GLM Measured Value
16
0
8
4
4
2
2
1
20
40
60
80 100 120 140
SVM Measured Value
16
8
1 0
16
LM Measured Value
16
8
1
Slowdown
We present our results in two parts, according to the training set used to evaluate the predictive capacity of each technique. As previously mentioned, predictions are only presented for a scaling factor of seven concurrent workloads. The models are evaluated using both the leave-one-out cross-validation (LOOCV) method and Kfold cross-validation (CV) [34]. LOOCV is chosen as the main evaluation method due to the limited size and diversity of the training data. We analyze model accuracy by calculating the average error produced when predicting application performance using the remaining profiles as training data. LOOCV allows us to make efficient use of the available data. To confirm our conclusions, we perform K-fold cross-validation by creating 10 folds in 10 separate runs. The first evaluation uses application profiles from the T1 set as the training and evaluation data. T1 contains only applications with high resource requirements. The average prediction error produced by each technique can be found in Figure 2. We find that across the board, all techniques perform poorly with average prediction errors between 14.6% and 25.8%. More training data is needed to reduce the average prediction errors. However, looking at the error distribution graphs in Figure 3 we find that WM performs relatively well. The high average error can be attributed almost entirely to a small number of large prediction errors, caused by overestimating the slowdown for network-based applications. Conversely, the errors produced by the SVM-based techniques are predominantly caused by underestimating the interference sensitivity of network-based applications.
0
8
1
6.3
40
1 0
Hybrid
20 SVM Measured Value
16
1 LM
0
8
0
LM Measured Value
16
8
20 40 60 80 100 120 140 Class SVM Measured Value
0
8
4
4
2
2
1
40
60
80 100 120 140
Hybrid Measured Value
16
8
20
1 0 20 40 60 80 100 120 140 Applications sorted by slowdown
0
20 40 60 80 100 120 140 Applications sorted by slowdown
Fig. 4. Error distribution using applications from T2 for both training and evaluation using LOOCV. Additional training data is needed, adding a range
1939-1374 (c) 2013 IEEE. Personal use is permitted, but republication/redistribution requires IEEE permission. See http://www.ieee.org/publications_standards/publications/rights/index.html for more information.
This article has been accepted for publication in a future issue of this journal, but has not been fully edited. Content may change prior to final publication. Citation information: DOI 10.1109/TSC.2014.2312912, IEEE Transactions on Services Computing
8
constant. 0.2
Mean Squared Error LOOCV 10-fold CV
0.16 Average relative error
of applications with lower resource requirements and limited or no slowdown. We obtain this training data using rate limited benchmarks as described in set T2. In Figure 2, we find the results when using T2 to train the models. Results are presented using either the applications in T1 or T2 as the evaluation set. Using the smaller T1 set for evaluation, we can separate the predictions errors for resource intensive applications with significant slowdown. Both linear approaches still produce large prediction errors and perform much worse than the WM- and SVM-based options. As there are relatively few applications without slowdown, we find little difference between regular SVM and the Class SVM approach in these results. Both produce an average error slightly above 9%. Class SVM does not provide appreciable benefits over SVM for resource intensive applications. WM performs substantially better with an average error of only 7.1%. More importantly, this number can be attributed almost entirely to a small amount of applications with a relatively large prediction error. However, the Hybrid approach proves to be most accurate with an average error of only 6.5%. Despite the lower accuracy of Class SVM, the largest WM prediction errors are found on applications where Class SVM is fairly accurate. This allows the hybrid model to produce better results than the models it is based on. Using T2 as both the training and evaluation set provides a more realistic use case where most applications do not exhibit significant slowdown. Average errors are reduced for all techniques. This can be attributed to the large amount of applications without slowdown which are relatively easy to predict. Looking at the error distribution in Figure 4, we find that only the linear techniques have significant problems with identifying these applications. Looking at the average slowdowns in Figure 2, we find that the linear techniques are still inferior to all other options. Regular SVM performance is now significantly lower than Class SVM with an average error of 6.3% compared to 4.5%. This is to be expected as we now have a large class of applications which can easily be identified as having no slowdown. Class SVM and WM provide comparable performance with both models producing an average error of 4.4%. However, comparing the Class SVM and WM graphs in Figure 4 we can identify different underlying causes for each number. Where WM has larger errors for applications without slowdown, Class SVM has larger errors on high slowdown applications. These distinct differences are directly responsible for the low average error produced by the Hybrid model, with an average error of just 3.3%. We further validate these conclusions using 10-fold cross-validation with T2 for both training and evaluation. Class SVM and WM produce similar error averages of 5.1% and 5.2% respectively. The Hybrid approach performs best with an average prediction error of 3.9%. The results in Figure 5 confirm our conclusions. As expected, all techniques produce moderately increased prediction errors while the relative differences remain
0.12
0.08
0.04
0 LM
GLM
SVM
Class SVM
WM
Hybrid
Prediction technique
Fig. 5. Relative prediction errors for both LOOCV and Kfold using T2 for both training and evaluation.
7
C LUSTERING
In this section, we evaluate clustering as a method to automatically distinguish between well-defined application types. Specifically, we focus on the correct identification of applications with a significant network component. In [5], our techniques identified four clusters of applications with distinct performance profiles. Subsequently, we used these application clusters to quantify the average slowdown when co-scheduling different application types. Adding a network component allow us to detect additional application clusters and evaluate our approach. These additional application types provide opportunities to identify new combinations that are ideally suited for consolidation. 7.1
Clusters
K-means clustering was evaluated for k values from two to seven. Clustering is based on the performance metrics gathered from profiling the resource limited applications in set T1. Applications with similar slowdown profiles are correctly grouped together, irregardless of the k value. By analyzing the combination of slowdown measurements and performance metrics, we are able to distinguish either four large or six detailed clusters as the optimal choices. Lower k values result in clusters with relatively large differences in the included application profiles. Increasing the amount of clusters beyond six splits already accurately defined application types. The resulting application types for four clusters can be described as follows: C1 : Applications limited mainly by CPU usage. Slowdown in this group is relatively low because of the limited resource sharing. C2 : Applications with mixed limiting factors. Slowdown is caused by a combination of factors,
1939-1374 (c) 2013 IEEE. Personal use is permitted, but republication/redistribution requires IEEE permission. See http://www.ieee.org/publications_standards/publications/rights/index.html for more information.
This article has been accepted for publication in a future issue of this journal, but has not been fully edited. Content may change prior to final publication. Citation information: DOI 10.1109/TSC.2014.2312912, IEEE Transactions on Services Computing
9
not limited solely by CPU, disk or network I/O. This cluster contains a diverse set of applications, both in resource usage and incurred slowdown. C3 : Applications characterized by their network usage. The applications in this set are limited by network-related resources in various degrees. All new network-based applications can be found in this cluster. C4 : Applications limited almost entirely by disk usage. The applications in this set will all have significant amounts of slowdown when sharing disk resources. An overview of the cluster composition and average resource usage can be found in Table 3. We can clearly distinguish large differences in the average application profiles. These differences should translate into preferences when co-scheduling applications. However, there is a large single group of applications (C3) that we can further divide in a meaningful manner. Clustering with five groups creates a single new group which should logically be split into two. Therefore, we choose to cluster into six groups to add further detail to our analysis. By increasing the k value from four to six, we can create two new groups containing the TCP streaming applications. These applications generate significantly higher bandwidth usages than the remaining network applications and are likely to have a distinct impact on other application types. The new application types for six clusters can be described as follows: C3 : Applications with a significant network component but not limited by the maximum network bandwidth. C5 : Applications limited by a combination of the available receiving bandwidth and CPU usage. Performance will most likely be limited by the amount of bandwidth required by applications sharing the network connection. However, other factors may contribute to slowdown. C6 : Applications limited almost entirely by the maximum sending bandwidth of the network. Performance is reduced by the amount of outgoing bandwidth required by applications sharing the network connection. An overview of the cluster composition and average resource usage can be found in Table 4. 7.2
Cluster Performance
With the introduction of these application clusters, we can evaluate the performance variance when mixing different application types. To quantify the contention effects of co-scheduled applications, we create application pairs between clusters and measure the slowdown incurred for all possible combinations. Benchmarks are first presented for a single application pair, resulting in two concurrent VMs. To demonstrate that the conclusions are still valid under more strenuous resource
contention, benchmarks were also performed using three pairs for a total of six concurrent VMs. We analyze the results using both four and six application clusters. Our main focus will be on the interactions with the new network-related application types in C3, C5 and C6. The results using four clusters are shown in Table 5. As expected, interactions between the non-network related applications types (C1, C2 and C4) are identical compared to previous experiments. The co-scheduled application type is relatively unimportant for C1. Even co-scheduling with the most disk intensive applications results in a relatively limited performance decrease. Applications from C2 and C4 should be spread out over as many servers as possible. Combinations with C1 applications are preferred, whereas co-scheduling with applications from C4 should be avoided at all cost. The new C3 group has a limited impact on all other application types, making it an ideal co-scheduling partner. Conversely, applications from C3 suffer limited effects from resource sharing with other applications types. Similar to the disk heavy applications, the networkbased applications from C3 incur large average slowdown when co-scheduled with members from the same cluster. These results are very promising and indicate that intelligent scheduling policies can be used to reduce the interference impact. However, using four clusters we have created a large single group concentrating all applications with a network component. To investigate the performance differences within this group we need to separate additional clusters. The results using six clusters can be found in Table 6. Splitting the network applications into three different groups leads to some interesting results. The group of moderate network applications (C3) suffers disproportionate slowdowns when paired with C6. VMs sending a TCP stream, consuming all available bandwidth, can severely starve response/request-based network applications. C5 also has a major impact on C3 but the effect is far less pronounced. Applications from C3 only exhibit moderate slowdown when paired with other C3 members, even for six concurrent VMs. Another important result can be found when co-scheduling C5 and C6 members. While three out of four combinations display the expected amounts of slowdown when coscheduled, pairing C5 and C6 only results in significant slowdown for the C5 group. Applications in C6 do not suffer any slowdown at all when co-scheduled with nonnetwork applications, this can be explained by their low CPU and disk requirements. The applications in C5 are slightly more sensitive to interference, particularly to coscheduling with the disk heavy C4 cluster. Overall, these results indicate a strong need to differentiate between network application types when scheduling.
8
S CHEDULING
In this section we integrate the additional information obtained in Sections 6 and 7 into two novel scheduling
1939-1374 (c) 2013 IEEE. Personal use is permitted, but republication/redistribution requires IEEE permission. See http://www.ieee.org/publications_standards/publications/rights/index.html for more information.
This article has been accepted for publication in a future issue of this journal, but has not been fully edited. Content may change prior to final publication. Citation information: DOI 10.1109/TSC.2014.2312912, IEEE Transactions on Services Computing
10
TABLE 3 Average profiled metrics for K-means clusters with k = 4. Cluster
#
C1 C2 C3 C4
16 7 20 7
Slowdown 2.9% 44.0% 207.7% 745.2%
CPU gotten 96.6% 94.0% 70.4% 43.7%
L2 hit/miss 1.1% 2.4% 1.2% 2.8%
%util (Disk) 0.9% 7.9% 0.5% 55.0%
rMB/s (Net) 0 0 7.7 0
tMB/s (Net) 0 0 21.5 0
TABLE 4 Averages profiled metrics for K-means clusters with k = 6. Cluster
#
C1 C2 C3 C4 C5 C6
16 7 16 7 2 2
Slowdown 2.9% 44.0% 82.6% 745.2% 823.3% 593.0%
CPU gotten 96.6% 94.0% 71.0% 43.7% 91.8% 44.5%
L2 hit/miss 1.1% 2.4% 0.9% 2.8% 2.4% 2.2%
%util (Disk) 0.9% 7.9% 0.6% 55.0% 0.2% 0.4%
rMB/s (Net) 0 0 0.3 0 74.5 0.4
tMB/s (Net) 0 0 12.7 0 0.4 112.9
TABLE 5 Average slowdown when co-scheduling cluster applications in a pair-wise manner using four groups. Slowdown is shown for the 1st cluster when co-scheduled with applications from the 2nd cluster. PP 2nd PP C1 C2 C3 C4 1st P P C1 C2 C3 C4
0.84% 1.25% 0.71% 2.52%
0.95% 2.09% 1.48% 17.78%
0.78% 1.77% 152.91% 3.46%
1.66% 3.80% 7.78% 110.23%
TABLE 6 Average slowdown when co-scheduling cluster applications in a pair-wise manner using six groups. Slowdown is shown for the 1st cluster when co-scheduled with applications from the 2nd cluster. PP 2nd PP C1 C2 C3 C4 C5 C6 1st P P C1 C2 C3 C4 C5 C6
0.84% 1.25% 0.81% 2.52% 0.33% 0.00%
0.95% 2.09% 1.49% 17.78% 2.77% 0.00%
0.76% 1.70% 11.70% 2.51% 1.51% 0.56%
1.66% 3.80% 7.45% 110.23% 19.23% 0.00%
0.85% 2.35% 117.00% 13.56% 64.46% 0.89%
0.99% 2.00% 1999.11% 3.82% 117.97% 96.19%
techniques, and compare their results to the previously introduced Bucket scheduler [5]. We also investigate the importance of correctly identifying all application types. Each scheduling technique is used to allocate a static set of applications to a fixed number of servers. In our evaluation, we focus on lowering the average slowdown experienced by all co-scheduled applications. However, there are many other metrics for which a scheduling technique can be optimized using this data. An alternative could be the isolation of a set of critical applications, or providing negligible interference and predictable performance for a large majority of applications.
in addition to runtime predictions. The second, the Weighted Slowest Sorted Cluster First (WSSCF) scheduler, improves upon this design by making more extensive use of runtime predictions. The previously introduced Bucket scheduler is also evaluated on the new application set. This technique relies solely on runtime predictions and was previously found to outperform other scheduling alternatives in the absence of network-based applications. All three techniques share the same goal of reducing average slowdown by spreading the most sensitive workloads and finding appropriate consolidation candidates.
8.1
Bucket : Each server candidate is given a weight that corresponds to the slowdown predictions of the applications already assigned to the server. Additionally, a maximum amount of workloads per server is enforced to avoid overbooking. Applications are sorted according to their predicted slowdown in descending order. Each
Algorithms
To evaluate the scheduling potential of the updated application clusters in combination with slowdown predictions, we propose two new scheduling techniques. The first is named the Slowest Sorted Cluster First (SSCF) scheduler and primarily uses clustering information
1939-1374 (c) 2013 IEEE. Personal use is permitted, but republication/redistribution requires IEEE permission. See http://www.ieee.org/publications_standards/publications/rights/index.html for more information.
This article has been accepted for publication in a future issue of this journal, but has not been fully edited. Content may change prior to final publication. Citation information: DOI 10.1109/TSC.2014.2312912, IEEE Transactions on Services Computing
11
8.2
Setup
We evaluate three scheduling techniques on the hardware platform described in Section 5. The experimental setup consists of two application sets scheduled on four different hardware configurations ranging from 8 to 14 servers. Each server can accommodate a maximum of seven workloads without overbooking, leaving a single CPU core for the hypervisor. For each experiment, we conduct a minimum of 5 iterations to obtain statistically significant results. The application sets used in the scheduling evaluation can be described as follows: S1 : S2 :
50 applications consisting of an even mix from all application types. This application set corresponds to T1 described in Section 6.2. Identical to S1 with the exclusion of the streaming applications assigned to clusters C5 and C6. This application set was created to analyze average slowdowns without the disproportionate effects caused by streaming applications.
Input: Servers, Applications, Profiling Data Clusters Cluster(P rof ilingData, Applications); P redictions Predict(P rof ilingData, Applications); SortedApplications Sort(Clusters, P redictions, Applications); CurrentServer 1; CurrentServerW eight
0;
foreach U nscheduled 2 SortedApplications do foreach Candidate 2 Servers do CandidateW eight 0; foreach Scheduled 2 Candidate do Couple Slowdown(U nscheduled, Scheduled) CandidateW eight CandidateW eight + Couple ; end
if CurrentServerW eight > CandidateW eight then CurrentServer Candidate; end end Schedule( CurrentServer, Application); end Algorithm 1: Placement strategy used by the SSCF and WSSCF schedulers. The Slowdown() function returns different results depending on the scheduler. 3
Standard Deviation Bucket SSCF - Four SSCF - Six WSSCF - Four WSSCF - Six
2.5 Average Slowdown
new application is scheduled on the server with the lowest weight, provided that the server can still accept an additional workload. The server weight is increased with the predicted slowdown, e.g 1.2 for a 20% slowdown. Slowest Sorted Cluster First: Applications are divided into groups according to the clusters described in Section 7. These groups are sorted in descending order using the average slowdown found in Table 4. Applications within each group are sorted according to their predicted slowdown in descending order. The ordered applications are scheduled by taking the slowest application from the slowest cluster first. Each potential server is given a weight by adding the recorded average slowdowns between the already assigned application types and the new candidate (see Table 6). Additionally, a maximum amount of workloads per server is enforced to avoid overbooking. Each new application is scheduled on the server with the lowest weight, provided that the server can still accept an additional workload. Algorithm 1 depicts the high-level pseudo code for this strategy. Weighted SSCF: The scheduling and sorting process are identical to the SSCF scheduler. The sole difference lies in the manner in which the weight is calculated for each server. Instead of using the data from Table 6 directly, we also incorporate an application’s slowdown prediction to scale this number. This creates a bigger weight for an application with a relatively higher slowdown prediction. The additional scaling helps to differentiate between servers when scheduling large amounts of applications belonging to a single cluster. However, the predicted slowdowns represent a relatively high upper bound. Multiplying by such large numbers has the potential to reduce the effects of the inter-cluster differences. To ensure only a subtle differentiation between application types, we use the much lower cube root of an application’s slowdown prediction.
2
1.5
1 8
10
12
14
Servers
Fig. 6. Average slowdown for each scheduler using S1. 8.3
Results
The purpose of these experiments is to demonstrate the scheduling improvements that can be made by moving from a one-dimensional prediction-based classification to a more fine-grained classification using application types. Our main focus in this section is determining if the presented application clusters can be successfully used to further reduce average slowdown. In previous research,
1939-1374 (c) 2013 IEEE. Personal use is permitted, but republication/redistribution requires IEEE permission. See http://www.ieee.org/publications_standards/publications/rights/index.html for more information.
This article has been accepted for publication in a future issue of this journal, but has not been fully edited. Content may change prior to final publication. Citation information: DOI 10.1109/TSC.2014.2312912, IEEE Transactions on Services Computing
12
1.25
Standard Deviation Bucket SSCF WSSCF
Average Slowdown
1.2
1.15
1.1
1.05
1 8
10
12
14
Servers
Fig. 7. Average slowdown for each scheduler using S2. we found that adding accurate slowdown predictions adds valuable knowledge to the scheduling process. With the results presented in this section, we show that further improvements can be made by using clustering to identify application types and by quantifying their interference effects. Average slowdown per application is presented for S1 and S2 in Figures 6 and 7. To put the performance of the newly proposed SSCF and WSSCF schedulers in the proper perspective, results from the Bucket scheduling policy are also included. We discuss our results in two parts. In the first, we look at the influence of the amount of application clusters. In the second part, we discuss the differences between placement strategies without the streaming applications. By omitting these applications we reduce the amount of identifiable application clusters to four. In Figure 6 we find the average slowdown when scheduling the applications from test set S1. The Bucket scheduler is compared to the SSCF and WSSCF schedulers using both four and six clusters. Both the Bucket scheduler and the schedulers based on four clusters are not able to correctly identify an important subset of the network intensive applications. The cluster performance analysis in Section 7.2 already highlighted the substantial impact when co-scheduling some of the networkbased application types. Without this crucial information, schedulers are unable to reliably avoid the resulting performance degradation, causing high slowdown averages and unpredictable performance. Moving from four to six clusters allows the SSCF and WSSCF schedulers to correctly identify the potential impact and take corrective measures. When sufficient application types are identified, the Weighted SSCF schedulers outperforms the SSCF schedulers by up to 3%. Figure 7 shows the benchmark results for the smaller S2 application set. Due to the removal of the streaming applications, results are only presented using four application clusters. The Bucket scheduler is still unable to provide predictable performance when network-based applications are included. In the test cases with 10 and
12 servers, average slowdown is more than two times higher than the cluster-based approaches. As expected, the SSCF and WSSCF consistently reduce the average slowdown when additional servers are available to distribute workloads. The more intelligent WSSCF scheduling strategy provides significant performance improvements for all server configurations. Compared to SSCF, average slowdown is further reduced from 19.4% to 15.2% when scheduling on eight servers. Average slowdown numbers allow us to easily compare the large number of scheduler, server and application set combinations. However, this representation does not allows us to investigate the underlying slowdown distribution summarized by the average slowdown numbers. In Figure 8 we look at the slowdown per application using S1 on 8 servers and S2 on 8 and 14 servers. Applications are sorted according to increasing slowdown. Although we only present the results for a small number of options, similar trends can be observed for other server amounts. Several observations can be made when analyzing the results. First, the performance differences can be attributed to a relatively small amount of applications with large slowdowns. All techniques contain sufficient intelligence to manage slowdown for the majority of applications. Second, both clustering approaches require six clusters for optimal performance when scheduling with the S2 application set. When using just four clusters, the WSSCF scheduler creates a much more evenly spread error distribution than the average slowdown numbers would suggest. Third, the WSSCF scheduler not only results in lower average slowdowns for all configurations, it also distributes slowdown more evenly across the applications. The SSCF approach results in comparable performance for the majority of applications. The higher average slowdown can be traced to a limited set of applications that are not ideally distributed due to the lack of performance differentiation within clusters.
9
F UTURE
WORK
This paper describes a diverse body of work, as such there are several different aspects which can be viable candidates for future work. • The results from the clustering approach indicate that relying solely on predicted upper bounds for interference can be ineffective for network-based applications. Interference can be reduced further by identifying additional network-based application types, e.g. latency-sensitive workloads. Packet-level analysis can lead to the identification of such types. • Preliminary results indicate that there can be large performance variances depending on the direction of the network transfers of a co-scheduled VM. Schedulers can be extended to consider whether an application is primarily sending or receiving data. • The current approach relies on performance metrics which are measured by running applications in
1939-1374 (c) 2013 IEEE. Personal use is permitted, but republication/redistribution requires IEEE permission. See http://www.ieee.org/publications_standards/publications/rights/index.html for more information.
This article has been accepted for publication in a future issue of this journal, but has not been fully edited. Content may change prior to final publication. Citation information: DOI 10.1109/TSC.2014.2312912, IEEE Transactions on Services Computing
13
32
Bucket SSCF - Four SSCF - Six WSSCF - Four WSSCF - Six
Slowdown
16 8 4 2 1 30
Slowdown
2.5 2
40 Sorted Applications using S1 - 8 servers Bucket SSCF WSSCF
1.75 1.5
1.5
1.25
1
1
30 40 Sorted Applications using S2 - 8 servers
50
Bucket SSCF WSSCF
30 40 Sorted Applications using S2 - 14 servers
Fig. 8. Slowdown distribution when scheduling with S1 and S2 on eight servers. Applications are sorted according to slowdown.
•
•
10
isolation during the profiling stage. Predictions and classification could be made dynamic, based on the metrics measured from concurrently running VMs. For workloads with highly irregular behaviour over time, such an approach can further improve the quality of the (re)scheduling decisions. Generalizing our model to support multi-core VMs, scheduling of applications that consist of multiple interconnected virtual machines and the modeling of interference when overprovisioning CPUs. The scheduling experiments demonstrate the potential of our approach for a specific goal i.e. reducing average slowdown. Other goals such as reducing the maximum slowdown or its variance could be pursued through the use of the prediction and classification data.
C ONCLUSION
This paper addresses the issue of consolidating resource intensive VMs and the resulting variances in workload performance. We provided new and valuable information to data center schedulers by introducing accurate performance models and correct classification of applications. To demonstrate the potential benefits provided by this new information, we developed and evaluated a number of novel scheduling techniques. Correct identification of application types combined with consolidation preferences proves to be a powerful tool when scheduling resource intensive applications. Prediction of individual application slowdown can be used to further optimize scheduling performance. The work in this paper focuses on the performance interference caused by network I/O in consolidated VM workloads, for which we introduced an extensive benchmark suite and profiling framework. The gathered performance scores and metrics were used to evaluate
both application modeling and clustering. Class SVM and WM were shown to have comparable performance on a realistic and extensive training set, both producing an average prediction error of 4.4%. Further analysis of the prediction errors revealed a complementary nature in the errors produced by different techniques. A hybrid approach was introduced, reducing the average prediction error to 3.3%. Through K-means clustering several new network-related application types were identified. With these new classifications, we were able to quantify the slowdown when consolidating different application types. We identified an important difference in the interference effects caused by different network application types. Streaming applications can severely reduce the performance of response/request-based applications. To determine the potential of model based scheduling, we developed and evaluated several novel scheduling techniques. Results from the scheduling experiments further highlight the importance of correctly identifying application types. Through intelligent scheduling using both application types and runtime predictions, we were able to significantly and consistently lower the average application slowdown for all tested configurations. The WSSCF scheduler resulted in both lower average slowdowns as well as a more evenly spread slowdown distribution across all applications. These results conclusively demonstrate the added value of application types and runtime predictions in data center scheduling.
R EFERENCES [1]
G. J. Popek and R. P. Goldberg, “Formal requirements for virtualizable third generation architectures,” Commun. ACM, vol. 17, no. 7, pp. 412–421, 1974. [2] R. Rose, “Survey of system virtualization techniques,” Oregon State University, Tech. Rep., March 2004. [3] J. E. Smith and R. Nair, “The architecture of virtual machines,” Computer, vol. 38, no. 5, pp. 32–38, 2005. [4] D. Ongaro, A. L. Cox, and S. Rixner, “Scheduling I/O in virtual machine monitors,” in Proceedings of the fourth ACM SIGPLAN/SIGOPS international conference on Virtual execution environments, ser. VEE ’08. New York, NY, USA: ACM, 2008, pp. 1–10. [Online]. Available: http://doi.acm.org/10.1145/1346256.1346258 [5] S. Verboven, K. Vanmechelen, and J. Broeckhove, “Black box scheduling for resource intensive virtual machine workloads with interference models,” Future Gener. Comput. Syst., 2013. [6] D. Aragiorgis, A. Nanos, and N. Koziris, “Coexisting scheduling policies boosting I/O virtual machines,” in Proceedings of the 2011 international conference on Parallel Processing - Volume 2, ser. EuroPar’11. Berlin, Heidelberg: Springer-Verlag, 2012, pp. 407–415. [7] S. Ibrahim, H. Jin, L. Lu, B. He, and S. Wu, “Adaptive disk I/O scheduling for MapReduce in virtualized environment,” in Proceedings of the 2011 International Conference on Parallel Processing, ser. ICPP ’11. Washington, DC, USA: IEEE Computer Society, 2011, pp. 335–344. [8] W. Lloyd, S. Pallickara, O. David, J. Lyon, M. Arabi, and K. Rojas, “Performance modeling to support multi-tier application deployment to Infrastructure-as-a-Service clouds,” in Utility and Cloud Computing (UCC), 2012 IEEE Fifth International Conference on, 2012, pp. 73–80. [9] X. Pu, L. Liu, Y. Mei, S. Sivathanu, Y. Koh, and C. Pu, “Understanding performance interference of I/O workload in virtualized cloud environments,” in Cloud Computing (CLOUD), 2010 IEEE 3rd International Conference on, 2010, pp. 51–58. [10] G. Wang and T. Ng, “The impact of virtualization on network performance of Amazon EC2 data center,” in INFOCOM, 2010 Proceedings IEEE, 2010, pp. 1–9.
1939-1374 (c) 2013 IEEE. Personal use is permitted, but republication/redistribution requires IEEE permission. See http://www.ieee.org/publications_standards/publications/rights/index.html for more information.
This article has been accepted for publication in a future issue of this journal, but has not been fully edited. Content may change prior to final publication. Citation information: DOI 10.1109/TSC.2014.2312912, IEEE Transactions on Services Computing
14
[11] Y. Mei, L. Liu, X. Pu, S. Sivathanu, and X. Dong, “Performance analysis of network I/O workloads in virtualized data centers,” IEEE Transactions on Services Computing, vol. 99, 2011. [12] J. Hwang, S. Zeng, F. Wu, and T. Wood, “A component based performance comparison of four hypervisors,” in to appear in IFIP/IEEE Integrated Network Management Symposium (IM 2013), May 2013. [13] Y. Dong, Z. Yu, and G. Rose, “SR-IOV networking in Xen: architecture, design and implementation,” in Proceedings of the First conference on I/O virtualization, ser. WIOV’08. Berkeley, CA, USA: USENIX Association, 2008, pp. 10–10. [Online]. Available: http://dl.acm.org/citation.cfm?id=1855865.1855875 [14] Y. Koh, R. Knauerhase, P. Brett, M. Bowman, Z. Wen, and C. Pu, “An analysis of performance interference effects in virtual environments,” Performance Analysis of Systems & Software, IEEE International Symposium on, pp. 200–209, Apr. 2007. [Online]. Available: http://dx.doi.org/10.1109/ISPASS.2007.363750 [15] J. P. Casazza, M. Greenfield, and K. Shi, “Redefining server performance characterization for virtualization benchmarking,” Intel Technology Journal, vol. 10, no. 03, pp. 243–252, 2006. [Online]. Available: http://www.intel.com/technology/itj/2006/v10i3/3xen/1-abstract.htm [16] P. Apparao, R. Iyer, and D. Newell, “Towards modeling & analysis of consolidated CMP servers,” SIGARCH Comput. Archit. News, vol. 36, pp. 38–45, May 2008. [Online]. Available: http://doi.acm.org/10.1145/1399972.1399980 [17] R. Iyer, R. Illikkal, O. Tickoo, L. Zhao, P. Apparao, and D. Newell, “VM3: Measuring, modeling and managing VM shared resources,” Comput. Netw., vol. 53, pp. 2873–2887, December 2009. [Online]. Available: http://dl.acm.org/citation.cfm?id=1663647.1663711 [18] A. Theurer, K. Rister, and S. Dobbelstein, “A survey of virtualization workloads,” in 2008 Ottawa Linux Symsposium, Jul. 2008, pp. 215–226. [19] H. Lv, X. Zheng, Z. Huang, and J. Duan, “Tackling the challenges of server consolidation on multi-core systems,” in Proceedings of the IEEE International Symposium on Workload Characterization (IISWC’10), ser. IISWC ’10. Washington, DC, USA: IEEE Computer Society, 2010, pp. 1–10. [Online]. Available: http://dx.doi.org/10.1109/IISWC.2010.5654398 [20] P. Padala, K.-Y. Hou, K. G. Shin, X. Zhu, M. Uysal, Z. Wang, S. Singhal, and A. Merchant, “Automated control of multiple virtualized resources,” in Proceedings of the 4th ACM European conference on Computer systems, ser. EuroSys ’09. New York, NY, USA: ACM, 2009, pp. 13–26. [Online]. Available: http://doi.acm.org/10.1145/1519065.1519068 [21] R. Nathuji, A. Kansal, and A. Ghaffarkhah, “Q-clouds: managing performance interference effects for qos-aware clouds,” in Proceedings of the 5th European conference on Computer systems, ser. EuroSys ’10. New York, NY, USA: ACM, 2010, pp. 237–250. [Online]. Available: http://doi.acm.org/10.1145/1755913.1755938 [22] J. Xu, M. Zhao, J. Fortes, R. Carpenter, and M. Yousif, “Autonomic resource management in virtualized data centers using fuzzy logic-based approaches,” Cluster Computing, vol. 11, no. 3, pp. 213–227, Sep. 2008. [Online]. Available: http://dx.doi.org/10.1007/s10586-008-0060-0 [23] J. Rao, X. Bu, C.-Z. Xu, L. Wang, and G. Yin, “VCONF: a reinforcement learning approach to virtual machines auto-configuration,” in Proceedings of the 6th international conference on Autonomic computing, ser. ICAC ’09. New York, NY, USA: ACM, 2009, pp. 137–146. [Online]. Available: http://doi.acm.org/10.1145/1555228.1555263 [24] S. Kundu, R. Rangaswami, K. Dutta, and M. Zhao, “Application performance modeling in a virtualized environment.” in HPCA, M. T. Jacob, C. R. Das, and P. Bose, Eds. IEEE Computer Society, 2010, pp. 1–10. [Online]. Available: http://dblp.unitrier.de/db/conf/hpca/hpca2010.html [25] S. Kundu, R. Rangaswami, A. Gulati, M. Zhao, and K. Dutta, “Modeling virtualized applications using machine learning techniques,” SIGPLAN Not., vol. 47, no. 7, pp. 3–14, Mar. 2012. [Online]. Available: http://doi.acm.org/10.1145/2365864.2151028 [26] D. Gupta, L. Cherkasova, R. Gardner, and A. Vahdat, “Enforcing performance isolation across virtual machines in xen,” in Proceedings of the ACM/IFIP/USENIX 2006 International Conference on Middleware, ser. Middleware ’06. New York, NY, USA: Springer-Verlag New York, Inc., 2006, pp. 342–362. [Online]. Available: http://dl.acm.org/citation.cfm?id=1515984.1516011
[27] OProfile, http://oprofile.sourceforge.net/, 2013, [Accessed 09-0313]. [28] J. J. Dongarra, P. Luszczek, and A. Petitet, “The LINPACK benchmark: past, present and future,” Concurrency and Computation: Practice and Experience, vol. 15, pp. 803–820, 2003. [29] D. Mosberger and T. Jin, “httperf - a tool for measuring web server performance,” SIGMETRICS Perform. Eval. Rev., vol. 26, pp. 31–37, December 1998. [Online]. Available: http://doi.acm.org/10.1145/306225.306235 [30] “Sysbench,” http://sourceforge.net/projects/sysbench/, 2013, [Accessed 11-04-13]. [Online]. Available: http://sourceforge.net/projects/sysbench/ [31] “Phoronix test suite - linux testing & benchmarking platform,” http://www.phoronix-test-suite.com/, 2013, [Accessed 11-042013]. [Online]. Available: http://www.phoronix-test-suite.com/ [32] J. A. Nelder and R. W. M. Wedderburn, “Generalized linear models,” Journal of the Royal Statistical Society. Series A (General), vol. 135, no. 3, pp. pp. 370–384, 1972. [Online]. Available: http://www.jstor.org/stable/2344614 [33] V. N. Vapnik, The nature of statistical learning theory. New York, NY, USA: Springer-Verlag New York, Inc., 1995. [34] R. Kohavi, “A study of cross-validation and bootstrap for accuracy estimation and model selection.” Morgan Kaufmann, 1995, pp. 1137–1143.
Dr. Sam Verboven is a researcher in the Department of Mathematics and Computer Science at the University of Antwerp (UA), Belgium. His research interests include virtualization and model-driven scheduling policies.
Dr. Kurt Vanmechelen is a post-doctoral fellow in the Department of Mathematics and Computer Science at the University of Antwerp (UA), Belgium. His research interests include resource management in (smart) grid and cloud environments in general, and the adoption of market mechanisms in such systems in particular. In 2009 he received his PhD., in Computer Science, at the University of Antwerp (UA), Belgium.
Dr. Jan Broeckhove is a professor in the Department of Mathematics and Computer Science at the University of Antwerp (UA), Belgium. His research interests include computational science and distributed computing. He received his PhD., in Physics, in 1982 at the Free University of Brussels (VUB), Belgium.
1939-1374 (c) 2013 IEEE. Personal use is permitted, but republication/redistribution requires IEEE permission. See http://www.ieee.org/publications_standards/publications/rights/index.html for more information.