Neural codes for perceptual discrimination of acoustic flutter in the primate auditory cortex Luis Lemus, Adria´n Herna´ndez, and Ranulfo Romo1 Instituto de Fisiología Celular—Neurociencias, Universidad Nacional Auto´noma de Mexico, 04510 Mexico D.F., Mexico Contributed by Ranulfo Romo, April 14, 2009 (sent for review March 9, 2009)
decision making 兩 monkeys 兩 working memory 兩 psychophysics 兩 neurophysiology
T
he problem of how sensory experiences arise from activity in the brain has stimulated a large amount of research in neuroscience (1, 2). A major component of this problem involves understanding how the brain represents sensory features—that is, what attributes of the neural responses evoked by a stimulus are meaningful for sensation, perception, memory, and decisionmaking? To confront these issues unambiguously, experimental methods should conform to 2 essential conditions: first, the sensory stimulus must be under precise, quantitative control, and second, the subject’s psychophysical responses should be well controlled and quantitatively measured. Most experimental paradigms meeting these standards have involved vision (1, 3) and somatosensation (2, 4). In comparison, the amount of research about audition using this approach is scant (5). Most of the studies in the auditory cortex and related areas have described the response properties of neurons to auditory scenes in anesthetized and awake animals, and how these are affected by different task conditions (5–21). But how the neural representations of acoustic stimuli are related to perception, memory and decision making is not known. We addressed this problem by recording the activity of single neurons in the primary auditory cortex (A1), while trained monkeys discriminated the difference in rate of 2 acoustic flutter stimuli (range of 4–40 Hz). The sensation of acoustic flutter is produced by slow repetition of an acoustic stimulus (11). The rate of the acoustic flutter is determined by the interval between the acoustic stimuli (pulse trains). In the acoustic flutter discrimination task, monkeys report whether the second stimulus rate (f2) is higher or lower than the first stimulus rate (f1). This cognitive operation requires that subjects compare information of f2 with a stored trace of f1 to form a decision, that is, whether f2 ⬎ f1 or f2 ⬍ f1, and to report their perceptual evaluation after a short, fixed delay. Thus, in this task, monkeys must hold f1 in working memory and must compare the current sensory information about f2 to the memory trace of f1; also, they must postpone the decision report until a sensory cue triggers the beginning of the motor response. We focused on A1 exclusively www.pnas.org兾cgi兾doi兾10.1073兾pnas.0904066106
because it is one of the earliest cortical auditory fields (22) and questions about the neural coding of acoustic flutter and about potential contributions of A1 to working memory and decisionmaking can be addressed in this task. Results Two monkeys (Macaca mulatta) were trained to discriminate the difference between 2 acoustic flutter stimuli (Fig. 1 A and B) until their psychophysical thresholds were stable (Fig. 1D). After training, we recorded from 136 single neurons in A1 (Fig. 1C) while monkeys performed the task. All of these neurons were recorded using the stimulus set illustrated in Fig. 1B. Trials of this set can be divided in 2 groups according to the differences between f1 and f2. In the first, trials had large differences between f1 and f2 (f2 ⫽ f1 ⫹ 12 Hz and f2 ⫽ f1 – 12 Hz). In this case, 3 comparison stimuli (16, 28, and 40 Hz) can be preceded by f1 rates either 12 Hz higher or lower (gray boxes in Fig. 1B). In other words, each of these comparison stimuli can be judged higher or lower, depending on f1. In the second, f2 was kept constant at 22 Hz and f1 varied between 14 and 30 Hz (f2 ⫽ f1 ⫾ 0, ⫾ 2, ⫾ 4, ⫾ 6, and ⫾ 8 Hz). In these trials, the comparison (f2) can be judged higher or lower, depending on f1. By combining the results from both groups, the A1 neuronal responses can be analyzed as functions of f1, f2, and f2 – f1, or as functions of the monkey’s 2 possible motor choices. A1 Responses During the Stimulation Periods. We first determined the responses of A1 neurons as functions of acoustic flutter rate while monkeys performed the discrimination task (Figs. 2A and 3A show 2 examples). This was done by measuring, for each neuron, the periodicity and the mean firing rate during the stimulation periods, both in single trials and in blocks of similar trials. The results of these 2 activity measures indicate that acoustic flutter rate can be represented both in the periodicity and in the firing rate to varying degrees across the A1 neuronal population [supporting information (SI) Fig. S1]. We found that 124 (91%) of the 136 neurons that responded to the acoustic stimuli encoded information about stimulus rate, the rest (n ⫽ 12, 9%) simply responded, but did not vary with stimulus rate. The large majority of the rate-modulated neurons only increased their firing rates as a function of stimulus rate (102 of 124, 82%), and only a minority responded with periodic spike intervals in a way that reliably represented the acoustic stimulus rate (n ⫽ 8 of 124, 7%). Fourteen (11%) of the 124 neurons provided information about stimulus rate both in terms of mean firing rate and periodicity. This statistical analysis establishes the basic relationship between A1 neuronal activity and acoustic flutter stimuli during performance of the discrimination task.
Author contributions: L.L., A.H., and R.R. designed research; L.L. and R.R. performed research; L.L. and R.R. analyzed data; and R.R. wrote the paper. The authors declare no conflict of interest. Freely available online through the PNAS open access option. 1To
whom correspondence should be addressed. E-mail:
[email protected].
This article contains supporting information online at www.pnas.org/cgi/content/full/ 0904066106/DCSupplemental.
PNAS 兩 June 9, 2009 兩 vol. 106 兩 no. 23 兩 9471–9476
NEUROSCIENCE
We recorded from single neurons of the primary auditory cortex (A1), while trained monkeys reported a decision based on the comparison of 2 acoustic flutter stimuli. Crucially, to form the decision, monkeys had to compare the second stimulus rate to the memory trace of the first stimulus rate. We found that the responses of A1 neurons encode stimulus rates both through their periodicity and through their firing rates during the stimulation periods, but not during the working memory and decision components of this task. Neurometric thresholds based on firing rate were very similar to the monkey’s discrimination thresholds, whereas neurometric thresholds based on periodicity were lower than the experimental thresholds. Thus, an observer could solve this task with a precision similar to that of the monkey based only on the firing rates evoked by the stimuli. These results suggest that the A1 is exclusively associated with the sensory and not with the cognitive components of this task.
16 87
D cs ips
A1
40
f2
1
ips Ls
Ls
28 f1 (Hz)
p (f1 higher than f2)
cs
16
28
4
16
40
28
28
16
16 Hz 1
4
0
14
22 f1 (Hz)
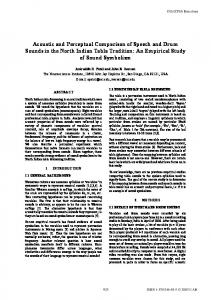
Fig. 1. Discrimination task. (A) Sequence of events during discrimination trials. The mechanical probe is lowered, indenting the glabrous skin of 1 digit of the restrained hand; the monkey places its free hand on an immovable key (KD); after a variable delay of 1–3 s, the first acoustic flutter stimulus (f1) is delivered; after a delay of 3 s, a second acoustic flutter stimulus is delivered at the comparison frequency (f2); after another delay of 3 s between the end of f2 and probe up (PU), the monkey releases the key (KU) and presses either a lateral or a medial push-button (PB) to indicate whether the comparison frequency was higher or lower than the base. (B) Stimulus set used during recordings. Each box indicates a base/comparison repetition rate stimulus pair. The number inside the box indicates overall percentage of correct trials for that (f1, f2) pair. (C) Recordings sites. The black strip on the right marks primary auditory cortex (A1); CS, central sulcus; IPS, intraparietal sulcus; LS, lateral sulcus. (D) Psychometric function calculated from 136 runs that used the (f1, f2) pairs shown in the inset of panel B; PT, psychometric threshold.
Next, we proceeded to determine whether these neural signals carry information in a way that may account for the animal’s psychophysical behavior. For each neuron, we computed neurometric functions based on the unit’s periodicity or on its firing rate values. First we analyzed those neurons that responded with periodic spike intervals that matched the input acoustic stimulus rate. Fig. 2 A shows the responses of 1 such neuron during the 2 stimulus periods while the monkey performed the task. The spikes of this neuron replicated the repetition rates of the acoustic flutter stimuli (Fig. 2B). The question, then, is whether this periodic signal contained in the spike intervals matches the animal’s psychophysical performance. Fig. 2C shows the relationship between the psychometric and the resulting neurometric function; in this case, the psychometric threshold (2.79 Hz) is slightly higher than the neurometric threshold (2.21 Hz), and the psychometric/neurometric threshold ratio is equal to 1.26. Fig. 4A shows the psychometric/neurometric threshold ratios over the population of periodic neurons [2.93 ⫾ 1.45 (mean ⫾ SD)]. It is clear that, based on their spike-train periodicity, an observer can discriminate acoustic stimulus rates much better (neurometric threshold ⫽ 1.69 ⫾ 0.69) than the animals do (psychometric threshold ⫽ 4.3 ⫾ 1.29). The mean ratio across the population was significantly larger than 1 (P ⬍ 0.05, t test). As indicated above, the large majority of A1 neurons modulate their firing rate as a function of the acoustic stimulus rate (S1). Are these signals associated with the animal’s psychophysical performance? For each of these neurons, we computed a neurometric function based on its firing rate values. Fig. 3C shows the relationship between psychometric and neurometric functions for an example neuron. For this cell, the neurometric threshold (2.07 Hz) is almost identical to the psychometric threshold (2.10 Hz); the psychometric/neurometric threshold ratio is equal to 1.01. Fig. 4C shows the relationship between the psychometric (3.7 ⫾ 1.82) and 9472 兩 www.pnas.org兾cgi兾doi兾10.1073兾pnas.0904066106
0
30
-1
22 f1 (Hz)
32
C1
D PT = 3.90
s = 1.46 0 12
PT=2.79 NT=2.21 0 12 22 32 Stimulus fequency (Hz)
500 ms
Fig. 2. Periodic responses of an A1 neuron during the discrimination task. (A) Raster plots. Each row of ticks is a trial, and each tick represents an action potential. Trials were delivered in random order (10 trials per stimulus pair). Only stimulus pairs with large (12 Hz) differences between f1 and f2 are shown. Gray vertical boxes indicate the first (f1) and second (f2) stimulation periods, with rate values on the left. (B) Periodicity (⫾ SD) as a function of stimulus repetition rate. (C) Neurometric and psychometric functions; data and sigmoidal fits (x2 test, P ⬍ 0.001) for 9 stimulus pairs in which f2 was 22 Hz and f1 varied between 14 and 30 Hz (f2 ⫽ f1 ⫾ 0, ⫾2, ⫾4, ⫾6, and ⫾8 Hz). One of the f1 (22 Hz), is equal to f2. The black line and circles correspond to the psychometric values; the gray line and circles correspond to the neurometric values calculated from this neuron based on its periodicity values. NT, neurometric threshold; PT, psychometric threshold. (D) Coefficient values for f1 (a1, green) and f2 (a2, red) for the neuron in panel A, as functions of time. Circles indicate significant values. These coefficients were calculated from the firing rate (this is 1 of the 14 neurons that had both periodicity and firing rate modulations).
neurometric (4.75 ⫾ 2.63) thresholds for the population of neurons with modulated mean firing rates; on average, the psychometric/ neurometric threshold ratio is equal to 1.24 ⫾ 1.37. It is clear from this measure that the neurometric functions based on firing rate are
A
f1
f2
B
40
28
40
16
28
4
16
40
28
28
16
16 Hz 1
4
Periodicity (Hz)
C
4
B
40
16
%
94
4
f2 40
22 f1 (Hz)
32
C1
D
0 -1
s = 1.1 0 12
p(f1 higher than f2)
KU PB
KD
90
f1
28
a1, a2
0.5 s
78
A
a1, a2
3s
behavior
92
=
28
f2 (Hz)
auditory stimuli
88
Periodicity (Hz)
94 82 71 65 51 63 73 81 95 40
p(f1 higher than f2)
B
f1
A mechanical probe
500 ms
PT=2.10 NT=2.07 0 12 22 32 Stimulus fequency (Hz)
Fig. 3. Firing rate modulation of an A1 neuron during the discrimination task. Same format as in Fig. 2. (A) Raster plots. (B) Mean rate (⫾SD) as a function of stimulus repetition rates. (C) Neurometric and psychometric functions. (D) Resulting coefficient values for f1 (a1, green) and f2 (a2, red) as functions of time. Circles indicate significant values. These coefficients were calculated from the firing rate (this is 1 of 102 neurons that had significant firing rate modulation as a function of stimulus frequency).
Lemus et al.
B
Periodicity TR= 3.42 ± 1.27
C
Firing rate TR = 1.24 ± 1.37
Firing rate TR = 2.24 ± 1.28
15 10 5 0 0.1
1
10 0.1
1
10 0.1
1
10
Threshold ratio (behaviour/neuron) Fig. 4. Relationship between neuron and behavior measured as the ratio between the psychometric and neurometric thresholds (psychometric/ neurometric, TR). (A) Frequency histograms for the 8 neurons with periodic responses (open bars). (B) Frequency histograms for the 14 neurons that provided information through their periodic responses (open bars) and their firing rates (gray bars). (C) Frequency histograms for the 102 neurons that provided information through their firing rates only (gray bars).
30
A
fr(t)=a1(t)f1+a2(t)f2+a3(t) n = 116
0 30
B n = 22 n = 116
0 0
very close to the psychometric ones. The mean population ratio was not larger than 1 (P ⬎ 0.05, t test). Fourteen of 124 neurons (Fig. 4B) provided information about the stimulus rate both through their periodic spike intervals (neurometric threshold ⫽ 1.18 ⫾ .0.45; psychometric threshold ⫽ 3.6 ⫾ 1.31; psychometric/neurometric threshold ratio ⫽ 3.42 ⫾ 1.27), and through their mean firing rates (neurometric threshold ⫽ 1.95 ⫾ 0.78; psychometric/neurometric threshold ratio ⫽ 2.24 ⫾ 1.28). Once again, for this subpopulation of neurons, psychometric thresholds were far higher than the neurometric thresholds based on periodicity (P ⬍ 0.05, t test) and were not significantly different from the neurometric thresholds computed from the mean firing rates (P ⬎ 0.05, t test). A1 Responses During Working Memory, Comparison, and Motor-Delay Periods. To solve the acoustic flutter discrimination task, monkeys
must hold information about f1 during the delay period between f1 and f2, compare that memory trace of f1 against the subsequent responses to f2, and postpone the motor report until a sensory cue triggers it. We carried out an analysis across the different periods of the task to investigate whether A1 encodes information about f1, f2 or the interaction between them. We considered responses during f2 that could be described by an arbitrary linear function of both f1 and f2: firing rate(t) ⫽ a1(t)f1 ⫹ a2(t)f2 ⫹ a3(t) (23–27). In this formulation, t represents time, and the coefficients a1 and a2 serve as direct measures of firing-rate dependence on f1 and f2, respectively. These coefficients were calculated in sliding windows of 200 ms moving in steps of 50 ms. To illustrate this analysis, the resulting coefficients a1 and a2 for the neurons of Figs. 2 and 3 are plotted in Figs. 2D and 3D as functions of time. We also plotted the numbers of neurons with significant a1 and a2 values as functions of time, to compare the strength of the signals encoding f1 and f2 at different points during the task (Fig. 5A). These results indicated that all A1 neurons encode f1 and f2 exclusively during the respective stimulus presentation periods. These cells are primarily modulated by stimulus rate and they do not signal this information during the working-memory, comparison, or motor-delay periods in this task. A1 Responses During the Motor-Report Period. Because the monkeys report their perceptual decisions through a motor act, we asked to what extent the activity of A1 neurons predicts the motor response (i.e., their choice). To answer this question, for each neuron we sorted the responses into hits and errors and calculated a choice probability index as a function of time. This quantified, for each (f1, f2) pair, whether responses during errors trials were different from responses during correct trials (Methods) (23–26, 28). With this method, responses that are primarily stimulus-dependent should show little or no difference between Lemus et al.
pu
f2
f1
1
2
3
4 Time (s)
5
6
7
8
Fig. 5. Dynamic of A1 population responses during the acoustic discrimination task and its relation to choice behavior. (A) Numbers of neurons with significant a1 and a2 coefficients as a function of time. Only the 116 units with significant firing rate modulation as a function of the stimulus frequency are included. Green and red traces correspond to a1 (f1) and a2 (f2), respectively. The A1 population represents almost exclusively the sensory events during the stimulus presentation periods. These coefficients were computed using a sliding window of 200 ms duration and moving in steps of 50 ms. The horizontal line marks the significance threshold (Methods). (B) Correlation between neuronal and behavioral responses. Number of neurons with choice probability indices as a function of time. Red trace, choice probability indices calculated on firing rate values; black trace, choice probability calculated on periodicity values. Horizontal black line marks significant levels.
error and correct trials, and thus, choice probability values near 0.5. In contrast, responses that are linked to the monkey’s choices should vary strongly according to which button was pressed in each trial, and consequently should produce choice probability indices near 1. The results of this analysis are shown in Fig. 5B, which plots the number of neurons with choice probability indices that were significantly above 0.5 as a function of time. Our criterion for significance was P ⬍ 0.05, so for the neurons that modulated their firing rates, a value of approximately 5 was expected at each point in time just by chance (Fig. 5B; blue trace). As the graph shows, this value was never exceeded by more than 1 unit. This means that, overall, there were no significant differences in activity between trials that resulted in hits versus errors. An analogous result was obtained based on periodicity (Fig. 5B; black trace). These results suggest that the evoked A1 activity does not directly determine the animals’ choices in this task. Discussion In these experiments, we sought to determine which properties of the evoked neuronal activity in A1 are sufficient for explaining the monkey’s performance during acoustic flutter discrimination. We found that the repetition rate of the acoustic flutter stimuli can be extracted or read out either from the periodicity of the evoked spike trains or from the corresponding mean firing rates, and that the relative importance of these 2 quantities varied across the A1 population. However, most of the A1 units (102/124; 82%) represented stimulus repetition rates through firing rate, whereas few (8/124; 7%) neurons represented it through periodicity only. A small group of A1 cells (14/124; 11%) also encoded stimulus rate in both ways. This result contrasts with a previous study in which most of the recorded A1 neurons encoded sound rate both through firing rate and periodic activity (11). That study also showed that this dual representation progressively changed into a monotonic rate code lacking PNAS 兩 June 9, 2009 兩 vol. 106 兩 no. 23 兩 9473
NEUROSCIENCE
Periodicity TR = 2.93 ± 1.45
Number of neurons
A
20
Number of neurons
Number of neurons
25
stimulus-synchronized responses along the caudal-to-rostral axis of the auditory cortex fields. This discrepancy could be because of different task conditions: we recorded A1 neurons in rhesus monkeys specifically trained to discriminate sound rates, whereas those authors recorded A1 neurons in alert but untrained marmoset monkeys (11), and it has been previously suggested that A1 responses may vary considerably as functions of training, (29). Whatever the source of the discrepancy, our results are consistent with the idea that, in A1, the representation of acoustic flutter rate is gradually transformed from a periodic or synchrony-based code to a firing-rate code. Moreover, an analysis of response latencies was consistent with this interpretation: the mean latency of the neurons with periodic responses (34.98 ⫾ 23.15 ms; mean ⫾ SD) was slightly but significantly shorter than the mean latency of the neurons that modulated their firing rate (48.31 ⫾ 33.51 ms, P ⬍ 0.05, ROC nonparametric test, n ⫽ 1,000). We examined which of the 2 signals could actually be used by the animals for discrimination. We did so by computing neurometric functions based on periodicity and firing rate and comparing them to the observed psychophysical behavior. Our analysis showed that neurometric thresholds based on periodicity are far lower than the psychometric thresholds. What is then the functional meaning of this neural representation? One possibility is that neurons simply happen to follow the temporal structure of the stimuli, and that monkeys do not use the resulting temporal patterns directly for acoustic f lutter discrimination. Consistent with this idea, we found that A1 neurons whose firing rates are modulated by the acoustic f lutter stimulus rates have firing rate-based neurometric thresholds that are very similar to the monkeys’ psychophysical thresholds. We, therefore, are tempted to suggest that firing rate, and not periodicity, represents the neural code that at the level of A1 is relevant for acoustic f lutter discrimination. Interestingly, we have obtained basically identical results in primary somatosensory cortex (S1) using an analogous task in which the rates of 2 mechanical vibrations are discriminated (30 –32). Thus, it appears that, at least in the rate range of 10 – 40 Hz, both S1 and A1 use firing rate codes for rate discrimination. Although a previous study addressed the issue of a possible temporal code for auditory perception (33), the psychophysics was done in humans and the neurometric analysis was based on data from anesthetized ferrets (33). Here, we investigated the possible neural codes for acoustic f lutter in A1 and their relation to perceptual discrimination directly in a combined psychophysical/neurophysiological experiment. These results also have implications regarding the functional organization of the primary sensory cortices. For example, it is possible that those primary areas not only represent modalityspecific sensory information while a stimulus is presented, but also are able to maintain some of that information ‘‘on line’’ during the working memory period of a discrimination task, and perhaps even participate in the subsequent decision-making steps. For instance, there are several reports suggesting that primary sensory cortices are involved to some degree in working memory tasks (34–36). Furthermore, a recent study has shown that, in addition to representing acoustic features, responses in A1 and R auditory fields may serve to encode some cognitive task elements associated with auditory processing (29), which also seems consistent with the idea that auditory cortex becomes selective to other sensory modalities when these are associated with auditory processing during action selection (29). In contrast with these results, in the present choice task, in which the neural code of the perceptually relevant stimulus feature was identified, we found little evidence of cognitive or higher-order processing in A1. Our analysis indicates that A1 does not participate in the working memory or in the decision-making periods of the frequency discrimination task, and this is consistent with previ9474 兩 www.pnas.org兾cgi兾doi兾10.1073兾pnas.0904066106
ous neurophysiological observations in S1 cortex of monkeys trained to discriminate the frequencies of vibrotactile stimuli (30–32). In those studies, we found that S1 neurons did not encode information about stimulus frequency beyond the corresponding stimulation periods (30–32). The working memory and decision-making processes reside outside of S1, and this is likely the case with A1 and sound frequency. In the somatosensory case, f1 is encoded in multiple cortical areas during the working memory period, and such encoding seems to proceed serially from secondary somatosensory cortex (S2) (32), to prefrontal cortex (PFC) (37–39), ventral premotor cortex (VPC) (25), and then medial premotor cortex (MPC) (24). During the comparison period, these same areas show activity related to the comparison between the stored trace of f1 and the ongoing trace of f2. The resulting motor signal that correlates with the final choice is also observed in primary motor cortex (M1), but M1 does not seem to be engaged in any way before the actual motor report (2, 25). This comparative analysis suggests that the fundamental role of the primary sensory cortices might be simply to generate an appropriate neural representation of the sensory input, which can be accessed by more central cortical circuits to perform a variety of cognitive functions. We think that the assigned functions of early sensory cortices need to be further investigated with more elaborate paradigms in which both neuronal activity and psychophysical behavior are monitored and quantified simultaneously. Methods General. Two monkeys (Macaca mulatta) were trained to discriminate the difference between 2 acoustic flutter stimuli. They learned to indicate whether the second stimulus rate was higher or lower than the first stimulus rate (Fig. 1D). Neurophysiological recordings were made in A1 of the left hemisphere while monkeys performed the discrimination task. The activity of responsive A1 neurons (Fig. 1C) was collected while monkeys discriminated frequencies near psychophysical threshold (Fig. 1 B and D). Acoustic Flutter Discrimination Task. The discrimination task used here was adapted from the tactile flutter discrimination paradigm that has been described before (26, 30 –32). Briefly, two 500-ms acoustic pulse trains were delivered by a computer controlled free-field speaker located 30 cm directly in front of the animal. Each pulse lasts 20 ms at 1 KHz, and the interval between the pulse trains is determined by the frequency (Fig. 1). Stimulus amplitudes were adjusted to equal subjective intensities, for example 74 dB at 14 Hz rate and 70.7 dB at 30 Hz rate. The sinusoid signal was generated by a computercontrolled HP 8904 function generator (Agilent Technologies). The right hand, arm, and fingers were held comfortably but firmly fixed through the experiments. Monkeys were trained to use the left hand to indicate, at the end of each trial, which of the 2 stimuli had the higher rate, by pressing 1 of 2 side-by-side pushbuttons placed in front of the monkey’s left side (lateral pushbutton for f2 ⬎ f1, medial for f2 ⬍ f1). Trials began when a computercontrolled mechanical stimulator (2-mm round tip, BME Systems) indented (500 m) the skin of 1 fingertip. The monkey reacted by placing its free hand in an immobile key, and after a variable period (1–3 s), 2 acoustic stimuli, separated by a delay of 3 s were delivered through the free-speaker; after another delay period of 3 s after the end of the f2 stimulus period, the mechanical stimulator was lifted from the skin and triggered the motor report of the choice (Fig. 1 A). Monkeys were handled according to the standards of the National Institutes of Health and the Society for Neuroscience. Recordings Sessions and Sites. Neuronal recordings were obtained with an array of 7 independent, moveable microelectrodes (2–3 M⍀) (23), inserted into A1 of the left hemisphere and ipsilateral to the responding arm. We used well-established criteria to distinguish A1 from the subdivisions of the auditory cortex (5–11). These included physiological and anatomical criteria. The rostral field R was identified by reversals in the cochleotopic gradients. We did not record in the RT field, but several neurons were also recorded in the belt auditory fields around A1 and R. Therefore, our recordings were confined to the core area A1, within 2 mm of the lateral sulcus, where neurons respond to tones. Data Analysis. For each neuron studied during the acoustic flutter discrimination task, off-line analyses and statistical tests were done by using custom and
Lemus et al.
MATLAB software (Mathworks). We considered a neuron’s response as taskrelated if during any of the relevant periods [f1, delay between f1 and f2, f2, delay between f2 and PU, reaction time (RT) or movement time (MT)] its mean firing rate was significantly different from that in a control period of equal duration but preceding the initial probe indentation at the beginning of each trial (Wilcoxon test (40), P ⬍ 0.01). By definition, f1 and f2 correspond to the base and comparison periods, respectively. The first delay was divided into consecutive intervals of 500 ms beginning at the end of f1 and up to the beginning of f2. Similar intervals were used for the second delay between f2 and PU. The RT was the period from the end of PU to the beginning of the key up (KU; Fig. 1 A). The MT was the period from the end of KU to the beginning of the push-button press (PB; Fig. 1 A). The dependence on f1 and f2 was quantified through multivariate regression analysis (27). After finding the best-fit coefficients a1 and a2, differences between fitted and measured responses to the individual (f1, f2) stimulus pairs were calculated, resulting in a full 2-D covariance matrix of errors (41). Coefficients were considered significantly different from (0, 0) if they were more than 2 standard deviations away. Neuronal responses were defined unambiguously as dependent on either f1 or f2 if the coefficients of the planar fit were within 2 standard deviations of either the a2 ⫽ 0 or the a1 ⫽ 0 lines; responses were considered dependent on f2 - f1 if the coefficients were more than 2 standard deviations away from these 2 lines and within 2 standard deviations of the a2 ⫽ - a1 line. Responses not satisfying this criterion were classified as ‘‘mixed’’. The dynamics of these coefficients was analyzed using a sliding window of 200 ms duration moving in steps of 50 ms. The beginning of the f1-tuned response (latency) was estimated for each neuron by identifying the first of 3 consecutive 20 ms bins after f1 onset in which a1 was significantly different from 0 and a2 was not significantly different from 0. The beginning of the f2 tuned-response was similarly estimated for each neuron. The choice probability index was calculated using methods from signal detection theory (23–26, 28). This quantity measures the overlap between 2 response distributions, in this case between correct and error trials for each (f1, f2) pair. We restricted the analysis to those (f1, f2) pairs for which the animals had between 30% and 70% of errors. Notice that a value of 0.5 indicates full overlap and 1 indicates completely separate distributions. Thus, the choice probability index quantifies selectivity for 1 or the other outcome of the discrimination process. To compute it at different times, we used a sliding window of 200-ms duration moving in 50 ms steps, beginning 1,000 ms before f1 and ending 1,000 ms after the animal reported the comparison between f2 and f1. To establish the significance of the choice probability values, the neuronal responses in each time window were shuffled, such that correct and error trials were randomized, and new choice probability indices for the shuffled data were generated. By comparing the indices from the shuffled and unshuffled data and repeating the process 1,000 times, we estimated the probability of obtaining choice probability values as large or larger than those observed initially (with the unshuffled data) just by chance (Fig. 5B). The above analysis showed that A1 neurons were exclusively responsive during stimulus presentation, and that they encoded the acoustic stimulus frequency mostly in their firing rates. However, we also sought to quantify the
periodicity of these neurons, that is, the degree to which their spikes are synchronized with the stimuli. For each trial, the power spectrum of the spike trains evoked during the stimulus period was computed (fast Fourier transform, n ⫽ 216; sampling frequency, 10 kHz; resolution, 0.15 Hz; range, 4 –100 Hz) (41). As an estimate of the periodicity, we calculated the median frequency around the peak in power, weighted according to the power at each frequency. The frequencies used for this measure were limited to those within a factor of 1.8 of the peak (to avoid contamination by harmonics) and to frequencies with a power greater than 15% of the peak power (to avoid noise). The median frequencies calculated in this way could then be used directly determine whether f2 ⬎ f1 or f2 ⬍ f1 in each trial (see below). In each trial, we also calculated the mean firing rate for the stimulus periods. Thus, for each stimulus frequency, we computed the mean ⫾ SD of the periodicity and the firing rate over all trials with that stimulus frequency. For further analysis, we selected those neurons that had the best linear fit (2, Q ⬎ 0.05) of the periodicity or firing rate values as functions of stimulus frequency (27). We also required the slope of this linear fit to be significantly different from 0 (Permutation test, n ⫽ 1,000, P ⬍ 0.05) (40). The discrimination task requires the comparison of f2 to f1. We determined the probability that an observer (e.g., a cortical region central to A1) could distinguish the difference between the 2 stimuli. This could be based on a comparison of the neuronal response distributions obtained for f2 made against the neuronal response distributions obtained for f1. For the firing rate, an ideal observer can use a simple rule: if the number of spikes during f2 is higher than during f1, then f2 is higher than f1. The same rule can be used when considering the periodicity values: if the periodicity values during f2 are higher than during f1, then f2 is higher than f1. This rule can be tested by determining the area under the receiver operating characteristic (ROC) curve generated by the neuronal response distributions for each pair of stimulus frequencies, using periodicity and firing rate values (28, 30, 31). In pairs of stimulus repetition rates in which the neuronal response distributions of f2 are much higher than those of f1, ROC values are close to 1; if the neuronal response distributions of f2 are much lower than those of f1, ROC values are close to 0; for overlapping distributions, intermediate ROC values are found (0.5). The ROC values were then used to compute neurometric functions. Psychometric and neurometric discrimination thresholds were calculated as half of the difference between the stimulus frequency identified as higher than the base in 75% of the trials and the frequency identified as higher in 25% of the trials. These were directly read from logistic function fits (Boltzmann equation) expressed in Hz. We used a t test to show that mean threshold ratios are significantly different of 1 (for example, in the case the neurometric threshold and the psychometric threshold are similar). The threshold ratio logarithmic distributions plots are not normal. These were transformed to normal distributions using logarithms and compared to 0 (the logarithm of 1).
1. Parker AJ, Newsome WT (1998) Sense and the single neuron: Probing the physiology of perception. Annu Rev Neurosci 21:227–277. 2. Romo R, Salinas E (2003) Flutter discrimination: Neural codes, perception, memory, and decision making. Nat Rev Neurosci 4:203–218. 3. Gold JI, Shadlen MN (2007) The neural basis of decision making. Annu Rev Neurosci 30:535–574. 4. Heekeren HR, Marrett S, Ungerleider LG (2008) The neural systems human that mediate human perceptual decision making. Nat Rev Neurosci 9:467– 479. 5. Recanzone GH, Guard DC, Phan ML, Su TK (2000a) Correlation between the activity of single auditory neurons and sound localization behavior in the macaque monkey. J Neurophysiol 83:2315–2331. 6. Merzenich MM, Brugge JF (1973) Representation of the cochlear partition on the superior temporal plane of the macaque monkey. Brain Res 50:275–296. 7. Rauschecker JP, Tian B (2000) Mechanisms and streams for processing of ‘‘what and ‘‘where’’ in auditory cortex. Proc Natl Acad Sci USA 97:11800 –11806. 8. Wang X (2000) On cortical coding of vocal communication sounds in primates. Proc Natl Acad Sci USA 97:1843–1849. 9. Lu T, Liang L, Wang X (2001) Temporal rate representations of time varying signals in the auditory cortex. Nat Neurosci 4:1131–1138. 10. Tian B, et al. (2001) Functional specialization in rhesus monkey auditory cortex. Science 292:290 –293. 11. Bendor D, Wang X (2007) Differential neural coding of acoustic flutter within primate auditory cortex. Nat Neurosci 10:763–771. 12. Wang X, Lu T, Bartlett E (2008) Neural coding of temporal information in auditory thalamus and cortex. Neuroscience 154:294 –3003.
13. Vaadia E, Gottlieb Y, Abeles M (1982) Single-unit activity related to sensoriomotor association in auditory cortex of a monkey. J Neurophysiol 48:1201–1213. 14. Grunewald A, Linden JF, Andersen RA (1999) Responses to auditory stimuli in macaque lateral intraparietal area. I. Effects of training. J Neurophysiol 82:330 –342. 15. Kilgard MP, Merzenich MM (2002) Order-sensitive plasticity in adult primary auditory cortex. Proc Natl Acad Sci USA 99:3205–3209. 16. Ulanovsky N, Las L, Nelken I (2003) Processing of low-probability sounds by cortical neurons. Nat Neurosci 6:391–398. 17. Fritz JB, Shamma SA, Elhilali M, Klein DJ (2003) Rapid task-related plasticity of A1 spectrotemporal receptive fields in primary auditory cortex. Nat Neurosci 6:1216 – 1223. 18. Weinberger NM (2004) Specific long-term memory traces in primary auditory cortex. Nat Rev Neurosci 5:279 –290. 19. Ghazanfar AA, Maeir JX, Hoffman KL, Logothetis NK (2005) Multisensory integration of dynamic faces and voices in rhesus monkey auditory cortex. J Neurosci 25:5004 – 5012. 20. Blake DT, Heiser M, Caywood M, Merzenich MM (2006) Experience-dependent adult cortical plasticity requires cognitive association between sensation and reward. Neuron 52:371–381. 21. Selezneva E, Scheich H, Brosch M (2006) Dual time scales for categorical decision making in auditory cortex. Curr Biol 16:428 – 433. 22. Kaas JH, Hackett T (2000) Subdivisions of auditory cortex and processing streams in primates. Proc Natl Acad Sci USA 97:11793–11799. 23. Romo R, et al. (2002) Neuronal correlates of decision-making in secondary somatosensory cortex. Nat Neurosci 5:1217–1225.
Lemus et al.
PNAS 兩 June 9, 2009 兩 vol. 106 兩 no. 23 兩 9475
NEUROSCIENCE
ACKNOWLEDGMENTS. We thank Emilio Salinas for comments. R.R. was supported by an International Research Scholars Award from the Howard Hughes Medical Institute and grants from Consejo Nacional de Ciencia y Tecnología and Direccio´n del Personal Acade´mico de la Universidad Nacional Auto´noma de Me´xico.
24. Herna´ndez A, Zainos A, Romo R (2002) Temporal evolution of a decision-making process in medial premotor cortex. Neuron 33:959 –972. 25. Romo R, Herna´ndez A, Zainos A (2004) Neuronal correlates of a perceptual decision in ventral premotor cortex. Neuron 41:165–173. 26. Lemus L, et al. (2007) Neural correlates of a postponed decision report. Proc Natl Acad Sci USA 104:17174 –17179. 27. Draper N, Smith H (1996) Applied regression analysis, 2nd Ed. (Wiley, New York). 28. Green DM, Swets JA (1966) Signal detection theory and psychophysics (Wiley, New York). 29. Yin P, Mishkin M, Sutter M, Fritz JB (2008) Early stages of melody processing: stimulussequence and task-dependent neuronal activity in monkey auditory cortical fields A1 and R. J Neurophysiol 100:3008 –3029. 30. Herna´ndez A, Zainos A, Romo R (2000) Neuronal correlates of sensory discrimination in the somatosensory cortex. Proc Natl Acad Sci USA 97:6191– 6196. 31. Luna R, Herna´ndez A, Brody CD, Romo R (2005) Neural codes for perceptual discrimination in primary somatosensory cortex. Nat Neurosci 8:1210 –1219. 32. Salinas E, Herna´ndez A, Zainos A, Romo R (2000) Periodicity and firing rate as candidate neural codes for the frequency of vibrotactile stimuli. J Neurosci 20:5503–5515. 33. Walker KMM, Ahmed B, Schnupp JWH (2008) Linking cortical spike pattern codes to auditory perception. J Cog Neurosci 20:135–152.
9476 兩 www.pnas.org兾cgi兾doi兾10.1073兾pnas.0904066106
34. Zhou YD, Fuster JM (1996) Mnemonic neuronal activity in the somatosensory cortex. Proc Natl Acad Sci USA 93:10533–10537. 35. Super H, Spekreijse H, Lamme VA (2001) A neural correlate of working memory in the monkey primary visual cortex. Science 293:120 –124. 36. Brechmann A, et al. (2007) Working memory-specific activity in auditory cortex: Potential correlates of sequential processing and maintenance. Cereb Cortex 17:2544 – 2552. 37. Romo R, Brody CD, Herna´ndez A, Lemus L (1999) Neuronal correlates of parametric working memory in the prefrontal cortex. Nature 399:470 – 473. 38. Brody CD, Herna´ndez A, Zainos A, Romo R (2003) Timing and neural encoding of somatosensory parametric working memory in macaque prefrontal cortex. Cereb Cortex 13:1196 –1207. 39. Machens CK, Romo R, Brody CD (2005) Flexible control of mutual inhibition: A neural model of two-interval discrimination. Science 307:1121–1124. 40. Siegel S, Castellan NJ (1988) Nonparametric statistics for the behavioral sciences (McGrawHill, New York). 41. Press W, Teukolsky SA, Vettering WT, Fannery, BP (1992) Numerical recipes in C, 2nd Ed. (Cambridge Univ Press, Cambridge, UK).
Lemus et al.