NIH Public Access Author Manuscript J Neurosci. Author manuscript; available in PMC 2012 July 06.
NIH-PA Author Manuscript
Published in final edited form as: J Neurosci. 2010 July 21; 30(29): 9877–9889. doi:10.1523/JNEUROSCI.2056-10.2010.
Cholinergic Modulation of Locomotion and Striatal Dopamine Release is Mediated by α6α4* Nicotinic Acetylcholine Receptors Ryan M. Drenan1, Sharon R. Grady2, Andrew D. Steele1, Sheri McKinney1, Natalie E. Patzlaff2, J. Michael McIntosh3, Michael J. Marks2, Julie M. Miwa1, and Henry A. Lester1,# 1California Institute of Technology, Pasadena, CA 91125, USA 2Institute
for Behavioral Genetics, University of Colorado Boulder, Boulder, CO 80309, USA
3Departments
of Psychiatry and Biology, University of Utah, Salt Lake City, UT 84112, USA
Abstract NIH-PA Author Manuscript
Dopamine (DA) release in striatum is governed by firing rates of midbrain DA neurons, striatal cholinergic tone, and nicotinic ACh receptors (nAChRs) on DA presynaptic terminals. DA neurons selectively express α6* nAChRs, which show high ACh and nicotine sensitivity. To help identify nAChR subtypes that control DA transmission, we studied transgenic mice expressing hypersensitive α6L9′S* receptors. α6L9′S mice are hyperactive, travel greater distance, exhibit increased ambulatory behaviors such as walking, turning, and rearing, and show decreased pausing, hanging, drinking, and grooming. These effects were mediated by α6α4* pentamers, as α6L9′S mice lacking α4 subunits displayed essentially normal behavior. In α6L9′S mice, receptor numbers are normal, but loss of α4 subunits leads to fewer and less sensitive α6* receptors. Gainof-function nicotine-stimulated DA release from striatal synaptosomes requires α4 subunits, implicating α6α4β2* nAChRs in α6L9′S mouse behaviors. In brain slices, we applied electrochemical measurements to study control of DA release by α6L9′S nAChRs. Burst stimulation of DA fibers elicited increased DA release relative to single action potentials selectively in α6L9′S, but not WT or α4KO/α6L9′S, mice. Thus, increased nAChR activity, like decreased activity, leads to enhanced extracellular DA release during phasic firing. Bursts may directly enhance DA release from α6L9′S presynaptic terminals, as there was no difference in striatal DA receptor numbers or DA transporter levels or function in vitro. These results implicate α6α4β2* nAChRs in cholinergic control of DA transmission, and strongly suggest that these receptors are candidate drug targets for disorders involving the DA system.
NIH-PA Author Manuscript
Keywords nicotinic; nicotine; dopamine; striatum; nucleus accumbens; midbrain; substantia nigra; ventral tegmental area; addiction; Parkinson's disease; hyperactivity; acetylcholine; cholinergic; locomotion; motor; reward
Introduction DA transmission, both at cell bodies situated in the midbrain and at presynaptic terminals in the striatum and prefrontal cortex, is tightly regulated by cholinergic systems. Patients with neural disorders involving DA signaling may benefit from therapies that augment or reduce cholinergic control over DA release. For example, stimulating DA release from residual DA
#
To whom correspondence should be addressed: California Institute of Technology, Division of Biology, M/C 156-29 1200 E. California Blvd. Pasadena, CA 91125
[email protected].
Drenan et al.
Page 2
NIH-PA Author Manuscript
terminals with nAChR agonists may be an effective treatment for Parkinson's disease (PD) (Quik and McIntosh, 2006). Conversely, the use of antagonists or weak partial agonists at midbrain nAChRs may be an effective strategy for smoking cessation drugs such as varenicline (Coe et al., 2005). Developing and further refining such agonists, however, requires a better understanding of the cell biology and physiology of particular nAChR subtypes.
NIH-PA Author Manuscript
Midbrain DA neurons and other cells in local and long-range circuits that directly synapse onto DA neurons express distinct nAChR subtypes on their cell surface. GABAergic cells in the substantia nigra pars reticulata (SNr) and the ventral tegmental area (VTA) express α4β2* (* indicates that other nAChR subunits may be present) nAChRs receptors with at least two sensitivities to ACh and nicotine (Nashmi et al., 2007; Xiao et al., 2009). Midbrain DA neurons express as many as seven distinct nAChR subtypes or stoichiometric variants: (α4)3(β2)2, (α4)2(β2)3, α4β2β5, α6β2, α6β2β3, α6α4β2, and α6α4β2β3 (Gotti et al., 2005; Salminen et al., 2007). β2 subunits are strictly required for nAChR function in midbrain DA neurons (Picciotto et al., 1998; Maskos et al., 2005); α4 subunits are expressed in nearly all DA neurons and loss of α4 subunits eliminates 80% of surface nAChRs in these cells (Azam et al., 2002; Marubio et al., 2003; Nashmi et al., 2007; Xiao et al., 2009). Functional α6* nAChRs are highly and selectively expressed in DA neurons (Drenan et al., 2008b), where they assemble with β2, and often, β3 and/or α4 subunits (Champtiaux et al., 2002; Champtiaux et al., 2003; Cui et al., 2003; Drenan et al., 2008a). Previous studies indicate that α6α4β2β3 nAChR pentamers are important regulators of DA release. For instance, studies on nicotine-evoked DA release from striatal synaptosomes indicate that α6α4β2β3 nAChRs have the highest sensitivity to nicotine (EC50 = 230 nM) (Salminen et al., 2007). Because nicotine reaches a concentration of 100-500 nM in brain CSF during cigarette smoking, α6α4β2β3 nAChRs on DA neurons are most likely to respond. We recently constructed mice expressing gain-of-function α6L9′S* receptors in order to amplify and isolate behavioral and physiological responses resultant from α6* nAChR activation (Drenan et al., 2008b). These mice exhibit marked locomotor hyperactivity due to enhanced sensitivity of DA neuron firing and/or release in response to low concentrations of nicotine or ACh. To further study the partially overlapping functions of α6*, α4*, and α6α* nAChRs, we crossed α4 knock-out (KO) mice with α6L9′S mice. This strain of mice discriminates, for the first time in vivo, between α6α4β2* and α6(nonα4)β2* nAChRs. Here we describe experiments showing that α4 subunits are critical for α6*-mediated behavioral phenotypes. Furthermore, using electrochemical measurements we show that DA release kinetics are significantly altered in α6L9′S mice, and that this alteration depends on α6α4β2* nAChRs.
NIH-PA Author Manuscript
Materials and Methods Mice All experiments were conducted in accordance with the guidelines for care and use of animals provided by the Office of Laboratory Animal Welfare at the National Institutes of Health, and protocols were approved by the Institutional Animal Care and Use Committee at the California Institute of Technology or the University of Colorado at Boulder. Mice were kept on a standard 12/12 or 13/11 h light/dark cycle at 22°C and given food and water ad libitum. On postnatal day 21, mice were weaned and housed with same-sex littermates. At 21 to 28 days, tail biopsies were taken for genotype analysis by PCR. Tails were digested in 50 mM NaOH at 95°C for 45 minutes followed by neutralization with 0.5 M Tris-Cl, pH 5.5 and subsequent direct analysis by multiplex PCR. α6L9′S mice were generated as described (Drenan et al., 2008b) and were backcrossed to C57BL/6 six to eight times. All studies described here utilize “line 2” α6L9′S mice (Drenan et al., 2008b). α4KO/α6L9′S mice were J Neurosci. Author manuscript; available in PMC 2012 July 06.
Drenan et al.
Page 3
NIH-PA Author Manuscript
generated by first crossing α4KO (Ross et al., 2000) mice with α6L9′S mice to generate α4+/-/α6L9′S mice, which were crossed again to α4KO mice to produce α4KO/α6L9′S progeny. Mice of this genotype were continually backcrossed to α4KO, and the presence of the α6L9′S transgene and the α4 null mutation was independently confirmed for each mouse using PCR. α4KO mice used in this study were littermates of α4KO/α6L9′S mice, and wild type (WT) control mice were littermates of α6L9′S transgenic mice. All groups of mice in this study contained approximately equal numbers of males and females. Mouse locomotor activity
NIH-PA Author Manuscript
Mice used to study locomotion were eight to 16 wk old at the beginning of an experiment. Back-crossing to C57BL/6 did not affect locomotor activity (data not shown). Horizontal locomotor activity was measured with an infrared photobeam activity cage system (San Diego Instruments; San Diego, CA). Ambulation events were recorded when two contiguous photobeams were broken in succession. Acute locomotor activity in response to nicotine was studied by recording ambulation events during four 15 sec intervals per min for a designated number of min. For most experiments, groups of eight mice were placed in activity cages (18 × 28 cm) and their baseline level of activity was recorded for eight min. Mice were removed from their cage, injected (100 μL per 25 g body mass), and returned to the cage within 15 sec. For generation of locomotor activity dose-response relationships, a group of mice was administered saline and, after five to eight days off, each successive dose of drug. For 48 h home cage monitoring, mice were isolated in their own cage and habituated to the test room and cage for 24 h. Following this, locomotor activity was recorded in 15 min intervals for 48 h. Automated mouse behavior analysis (AMBA) Video-based software analysis of home cage behavior was conducted as described previously (Steele et al., 2007). Mice that were normally group housed were singly caged and habituated to the video recording room and a fresh home cage for 24 h prior to recording. The video recording began the following day (two h prior to the dark phase) and continued for 23.5-24.0 hours, using dim red lights for recording during the dark phase. The videos were analyzed using the definitions and settings described (Steele et al., 2007) using HomeCageScan 3.0 software (Clever Sys., Inc) (Figure 2A). The visualization in Figure 2A was created in Matlab. The sample sizes were as follows: WT, n=8; α6L9'S, n=21; α4KO, n=14; α4KO/α6L9'S, n=13. Fast scan cyclic voltammetry in striatal slices
NIH-PA Author Manuscript
Mice (postnatal day 60-90) were anesthetized with sodium pentobarbital (40 mg/kg, i.p.) followed by cardiac perfusion with oxygenated (95% O2/5% CO2) ice-cold glycerol-based artificial CSF (gACSF) containing 252 mM glycerol, 1.6 mM KCl, 1.2 mM NaH2PO4, 1.2 mM MgCl2, 2.4 mM CaCl2, 18 mM NaHCO3, and 11 mM glucose. Following perfusion, brains were removed and retained in gACSF (0–4°C). Coronal slices (300 μm) were cut with a microslicer (DTK-1000; Ted Pella, Redding, CA) at a frequency setting of 9 and a speed setting of 3.25. Brain slices were allowed to recover for at least 1 h at 32°C in regular, oxygenated artificial CSF (ACSF) containing 126 mM NaCl, 1.6 mM KCl, 1.2 mM NaH2PO4, 1.2 mM MgCl2, 2.4 mM CaCl2, 18 mM NaHCO3, and 11 mM glucose. Coordinates for recordings in the caudate/putamen (CPu) were within the following range: (0.0 to +1.0 mm from bregma, -3.0 to -4.0 mm from the surface, and -1.0 to -3.0 from the midline). Carbon fiber (7 μm, unsized; Goodfellow) electrodes were fabricated at Caltech using anodic electrodeposition of paint (Schulte and Chow, 1996; Akopian et al., 2008). Voltammetry data were acquired with a Multiclamp 700A amplifier (Molecular Devices). J Neurosci. Author manuscript; available in PMC 2012 July 06.
Drenan et al.
Page 4
NIH-PA Author Manuscript NIH-PA Author Manuscript
The command microelectrode potential was -400 mV (against a Ag/AgCl reference electrode), and the potential was scanned from -400 mV to +1000 mV to -400 mV at a rate of 300 mV/ms; ramp frequency was 10 Hz. Dopamine release was elicited by stimulating DA fibers with a bipolar stimulating electrode (Frederick Haer & Co.), placed 200-300 μm from the recording site. The stimulus (0.65 mA, 250 μs) elicited maximal release, and stimulus trains were generated with an Anapulse Stimulator (World Precision Instruments). Eliciting maximal release reduced variability across experiments by maximizing the number of fibers carrying action potentials in the vicinity of the recording site (Cragg, 2003). When tested, all DA release responses were blocked by tetrodotoxin (data not shown). Pulse trains were delivered at 100 Hz, similar to the maximal firing rate of DA neurons observed in mammals (Rice and Cragg, 2004; Zhang and Sulzer, 2004). A fresh carbon fiber surface was exposed each recording day. Voltammetry protocols were initially run for ~30 min to allow the background currents to settle to an optimal waveform, and were run continually throughout the day when stimulation protocols were not run. Background currents were subtracted from signals acquired during striatal stimulation to isolate transient neurotransmitter release events. DA release recovered fully within 2 min after stimulus trains, and trains were typically delivered at 3 min intervals. Each day, electrodes were calibrated against DA standards in solution (2.5 and 5.0 μM DA). Absolute DA concentrations for release responses in slices were determined using these standards. We hold to convention and indicate pulse trains by 1p, 2p, etc.; individual pulses within a train are indicated as p1, p2, etc. For paired pulse experiments, responses to 1p and 2p (100 Hz) stimulation were recorded. Release due to the second of a pair of pulses (p2) was isolated by subtracting the response to a single pulse (p1, i.e. 1p) from the response to a 2p train. Dopamine release from striatal synaptosomes After a mouse was sacrificed by cervical dislocation, its brain was removed and placed immediately on an ice-cold platform and brain regions were dissected. Tissues from each mouse were homogenized in 0.5 ml of ice-cold 0.32 M sucrose buffered with 5 mM HEPES, pH 7.5. A crude synaptosomal pellet was prepared by centrifugation at 12,000 g for 20 min. The pellets were resuspended in “uptake buffer”: 128 mM NaCl, 2.4 mM KCl, 3.2 mM CaCl2, 1.2 mM KH2PO4, 1.2 mM MgSO4, 25 mM HEPES, 10 mM glucose, 1 mM ascorbic acid, and 10 μM pargyline at pH 7.5. Synaptosomes were incubated at 37° C in uptake buffer for 10 min before addition of 100 nM [3H]-dopamine (1 μCi per 0.2 ml of synaptosomes), and the suspension was incubated for an additional 5 min.
NIH-PA Author Manuscript
All experiments were conducted at room temperature using methods described previously (Nashmi et al., 2007; Salminen et al., 2007) with modifications for collection into 96-well plates. In brief, aliquots of synaptosomes (80 μl) were distributed onto filters and perfused with buffer (uptake buffer containing 0.1 % bovine serum albumin and 1 μM atropine with 1 μM nomifensine at 0.7 ml/min for 10 min, or buffer for 5 min followed by buffer with 50 nM αCtxMII. Aliquots of synaptosomes were then exposed to nicotine or high K+ (20 mM) in buffer for 20 sec to stimulate release of [3H]-dopamine followed by buffer. Fractions (~ 0.1 ml) were collected for 4 min into 96-well plates every 10 sec starting from 1 min before stimulation, using a Gilson FC204 fraction collector with a multicolumn adapter (Gilson, Inc.; Middleton, WI). Radioactivity was determined by scintillation counting using a 1450 MicroBeta Trilux scintillation counter (Perkin Elmer Life Sciences) after addition of 0.15 ml Optiphase ‘SuperMix’ scintillation cocktail. Instrument efficiency was 40%. Data were analyzed using SigmaPlot 5.0 for DOS. Perfusion data were plotted as counts per minute versus fraction number. Fractions collected before and after the peak were used to calculate baseline as a single exponential decay. The calculated baseline was subtracted from the experimental data. Fractions that exceeded baseline by 10% or more were summed to give
J Neurosci. Author manuscript; available in PMC 2012 July 06.
Drenan et al.
Page 5
total released cpm and then normalized to baseline to give units of release [(cpm-baseline)/ baseline] (Salminen et al., 2007).
NIH-PA Author Manuscript
Dopamine uptake Synaptosomes were prepared as described for DA release assays. Synaptosomes were suspended in uptake buffer (described above) at a concentration of 8 ml per mouse for dorsal striatum (ST) and 4 ml per mouse for olfactory tubercle (OT). For each well, synaptosomes (25 μl) were incubated in uptake buffer (final volume 100 μl) with either 0.05 μM or 1 μM [3H]-dopamine at 22°C for 5 min. Nomifensine (100 μM) was used for blank determination. The reaction was terminated by filtration onto a two layer filter consisting of one sheet of GFA/E glass fiber filter (Gelman Sciences, Ann Arbor, MI, U.S.A.) one sheet of GF/B glass fiber filter (Micro Filtration Systems, Dublin, CA) both soaked in uptake buffer. Samples were washed with cold uptake buffer four times. Radioactivity was measured using a Wallac 1450 Microbeta scintillation counter (PerkinElmer Life and Analytical Sciences) after addition of 50 μl of Optiphase Supermix scintillation cocktail (PerkinElmer Life Sciences) to each well of a 96-well counting plate. Previously, we have determined KM concentration of DA for uptake into striatal synaptosomes of C57Bl/6 mice to be 0.080 ± 0.003 μM (data not shown). Ligand binding
NIH-PA Author Manuscript
Kd values for each radioligand were determined by saturation binding to membranes prepared from C57Bl/6 mice (data not shown). All protein determinations were done by the method of Lowry et al (1951) with bovine serum albumin (BSA) as standard. Previously published methods (Marks et al., 2006; Brown et al., 2007) were followed to measure high affinity [125I]-epibatidine (2200 Ci/mmol) binding to membrane preparations using a 96-well plate format. Briefly, membranes treated with phenylmethylsulfonyl fluoride (1 mM) were incubated with [125I]-epibatidine (200 pM; Kd ~40 pM) in binding buffer (30 μl volume including: 144 mM NaCl, 1.5 mM KCl, 2 mM CaCl2, 1 mM MgSO4, 20 mM HEPES, pH 7.5 with BSA (0.1 % w/v), 5 mM EDTA, 5 mM EGTA, 10 μg/ml each aprotinin, leupeptin trifluoroacetate and pepstatin A). To some samples, αCtxMII (100nM) was added to measure αCtxMII-sensitive epibatidine binding by subtraction from total binding (the α6β2*-nAChR population, see Salminen et al, 2005). Non-specific binding was determined by including L-nicotine (1 mM). Plates were incubated for 2 hr at 22°C.
NIH-PA Author Manuscript
The D1/D5 dopamine receptors were measured by membrane binding of [3H]-SCH23390 ([N-methyl-3H]; 70-87 Ci/mmol). Membrane preparations were incubated in binding buffer (30 μl volume including: 144 mM NaCl, 1.5 mM KCl, 2 mM CaCl2, 1 mM MgSO4, 20 mM HEPES, pH 7.5) with [3H]-SCH23390 used at 1.7 nM, (Kd ~ 0.1 nM) with 0.5 μM mianserin added to block binding to 5-HT2 receptors, and 10 mM flupenthixol added for blank determination. Samples were incubated for 60 min at 22°C. The D2/D3 dopamine receptors were measured with [3H]-raclopride ([methoxy-3H]; 60-87 Ci/mmole). The procedure was the same as for D1/D5 sites using [3H]-raclopride at 17 nM, (Kd ~2 nM) with 10 μM sulpiride added for blank determination. Incubation was for 60 min at 22°C. The dopamine transporter (DAT) was measured by binding of [3H]-mazindol (15-30 Ci/mmol) at 200 nM (Kd ~25 nM) with addition of 1 μM fluoxetine to block the serotonin transporter and 100 nM desipramine to block norepinephrine transporters. Blanks were determined using 100 μM nomifensine. Samples were incubated for 90 min at 22°C followed by 30 min at 4°C. For all membrane binding assays, reactions were terminated by filtration of samples at 4° C onto a two layer filter consisting of one sheet of GFA/E glass fiber filter (Gelman Sciences,
J Neurosci. Author manuscript; available in PMC 2012 July 06.
Drenan et al.
Page 6
NIH-PA Author Manuscript
Ann Arbor, MI, U.S.A.) and one sheet of GF/B glass fiber filter (Micro Filtration Systems, Dublin, CA) both treated with 0.5% polyethylenimine using an Inotech Cell Harvester (Inotech, Rockville, MD, U.S.A.). Samples were subsequently washed six times with icecold binding buffer. Radioactivity was measured using a Wallac 1450 Microbeta scintillation counter (PerkinElmer Life and Analytical Sciences) after addition of 50 μl of Optiphase Supermix scintillation cocktail (PerkinElmer Life Sciences) to each well of a 96well counting plate. Statistical Analysis Home cage locomotor ambulation data were analyzed for significance with a one-way ANOVA with Tukey post hoc analysis (Drenan et al., 2008b). For AMBA behavioral experiments, data were analyzed for significance with a two-tailed Wilcoxon rank-sum test (non-parametric) (Steele et al., 2007). nAChR ligand binding, DA receptor ligand binding, DAT ligand binding, and DAT uptake data were analyzed for significance with a t-test within a brain region (ST or OT) and within a genetic background (WT or α4KO). Synaptosomal DA release curves were fit to the Michaelis-Menten equation (Hill coefficient = 1), and Rmax and EC50 values were evaluated for statistical significance using a t-test within a brain region (ST or OT) and within a genetic background (WT or α4KO). Voltammetry data were evaluated for significance with a t-test within a genotype, where 1p and 4p data were compared.
NIH-PA Author Manuscript
Materials All radioactive compounds were obtained from Perkin Elmer (Boston, MA). αCtxMII was synthesized as previously described (Cartier et al., 1996). Ultra centrifugation grade sucrose was obtained from Fisher Chemicals (Fairlawn, NJ). Sigma-Aldrich (St. Louis, MO) was the source for the following compounds: ascorbic acid, atropine sulfate, bovine serum albumin (BSA), (-)-nicotine tartrate, nomifensine, cytisine, and pargyline. Optiphase ‘SuperMix’ scintillation fluid was from Perkin Elmer Life Sciences.
Results α6α4* nAChR-mediated locomotion and behavioral analysis
NIH-PA Author Manuscript
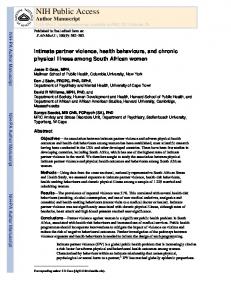
α6L9′S BAC transgenic mice utilize the full α6 promoter to drive the expression of a leucine 9′ to serine mutation in the ion channel pore lining transmembrane (TM2) domain of the α6 nAChR subunit, rendering them hypersensitive to agonist (Drenan et al., 2008b). α6L9′S mice show robust locomotor hyperactivity in the home cage and in response to systemic nicotine injections (Drenan et al., 2008b), thus providing a system with a broad dynamic range to study further genetic manipulations. We crossed Chrna4 homozygous null mutant mice (α4KO mice) with α6L9′S mice, then bred the resultant α4+/-/α6L9′S mice with α4KO mice again to inactivate both copies of the Chrna4 from hypersensitive α6L9′S nicotinic receptors. This manipulation removes several nAChR subtypes: α4β2 (both high sensitivity and low sensitivity components), α4β2α5, α6α4β2, and α6α4β2β3 receptors, leaving only α6β2β3 and α6β2 nAChRs (a minority, lower sensitivity subtype) (Figure 1A). These mice (α4KO/α6L9′S) are viable, fertile, and exhibit qualitatively normal social interactions compared to both α6L9′S mice and α4KO mice (data not shown). We measured home cage activity over 48 hr for WT, α6L9′S, α4KO, and α4KO/α6L9′S mice. As previously reported, α6L9′S mice exhibit substantial locomotor hyperactivity relative to WT mice during the dark phase (their active period) (Figure 1B), and this difference was highly significant when total ambulations were quantified (lights off #1: WT, 5860 ± 765 ambulations/15 min; α6L9′S, 34887 ± 6800 ambulations/15 min; p < 0.01) (lights on: WT, 2005 ± 301 ambulations/ 15min; α6L9′S, 4238 ± 723 ambulations/15 min; p > 0.05) (lights off #2: WT, 5030 ± 616; α6L9′S, 35491 ± 6869; p < 0.01) (Figure 1C). WT and α4KO mice had normal home cage J Neurosci. Author manuscript; available in PMC 2012 July 06.
Drenan et al.
Page 7
NIH-PA Author Manuscript
locomotor activity (Figure 1B and C). Surprisingly, the home cage hyperactivity in α6L9′S mice was completely abolished in α4KO/α6L9′S animals (lights off #1: α4KO, 6057 ± 1392 ambulations/15 min; α4KO/α6L9′S, 7821 ± 2225 ambulations/15 min; p > 0.05) (lights on: α4KO, 2174 ± 354 ambulations/15min; α4KO/α6L9′S, 2056 ± 504 ambulations/15 min; p > 0.05) (lights off #2: α4KO, 6328 ± 2014; α4KO/α6L9′S, 7021 ± 2187; p > 0.05 (Figure 1B and C), revealing that α4 subunits are required for the pronounced phenotype seen in α6L9′S mice.
NIH-PA Author Manuscript
α6L9′S mice are hypersensitive to nicotine, demonstrating locomotor activation (rather than locomotor suppression seen in WT mice) in response to low doses of nicotine and other nAChR ligands (Drenan et al., 2008b). In response to 0.2 mg/Kg nicotine, α4KO/α6L9′S mice showed only partial locomotor activation over a 30 min time course when compared to the response seen in α6L9′S mice (peak locomotor response: α6L9′S, 93 ± 14 ambulations/ min; α4KO/α6L9′S, 53 ± 4 ambulations/min) (Figure 1D). To further study this effect, we constructed nicotine dose response relations for WT, α6L9′S, α4KO, and α4KO/α6L9′S mice. As seen previously, α6L9′S mice demonstrated locomotor activation across a range of nicotine concentrations that do not significantly affect WT mice (Figure 1E). WT mice responded only to the highest tested dose (1.5 mg/kg) with suppression of locomotor activity, and locomotor activity of α4KO animals was not altered in response to the concentrations tested (Figure 1E), consistent with previous results (Tapper et al., 2007). The potency and efficacy of nicotine were consistently reduced in α4KO/α6L9′S mice compared to α6L9′S mice (Figure 1E), suggesting the emergence of alterations in the sensitivity and/or number of α6* receptors when α4 subunits are removed.
NIH-PA Author Manuscript
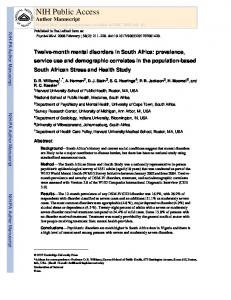
To better understand the altered behavior in α6L9′S mice and the effect of α4 subunit removal, we extended the behavioral analysis of these mice using automated mouse behavior analysis (AMBA) with a video-based behavioral recognition system. This system has previously been validated on several mutant mouse strains that exhibit altered behavior, including mouse models of Huntington's disease and prion diseases (Steele et al., 2007; Steele et al., 2008). Mice are singly housed in their standard cage while the AMBA software analyzes a video feed of the mouse's activity (Figure 2A). To verify that AMBA analyses correspond with the beam-break method (Figure 1), we analyzed distance traveled with AMBA. Consistent with the beam-break data (Figure 1) and our previous work (Drenan et al., 2008b), there was a dramatic and statistically significant increase in the mean distance traveled in α6L9′S mice compared to WT littermates (WT, 281 ± 28 m/24 hr; α6L9′S, 2469 ± 535 m/24 hr; p < 0.05) (Figure 2B). In contrast, we observed no statistically significant increase in distance traveled when α4KO mice were compared to α4KO/α6L9′S mice, although there was a trend towards increased distance with the presence of the α6L9′S BAC transgene (α4KO, 344 ± 62 m/24 hr; α4KO/α6L9′S, 1203 ± 568 m/24 hr; p > 0.05) (Figure 2B). It is not clear why the α6L9′S behavioral hyperactivity phenotype is highly variable and only partially penetrant (Figure 2B), but genetic mosaicism or epigenetic changes are possible explanations. We utilized the power of AMBA to discriminate among several specific behaviors in the genotypes under investigation. Specific behaviors were extracted by the HomeCageScan 3.0 software and expressed as a percentage of total time recorded (percent of total frames). Compared to WT littermates, α6L9′S mice exhibited robust differences in median values for a variety of behaviors. In particular, α6L9′S mice showed the greatest difference from WT control mice in behaviors of activity or ambulatory movement, including “jump”, “walk”, “stretch”, “turn”, and “rear” (Figure 2C). We also noted a large increase in the percent of time α6L9′S mice exhibited “high-velocity”, erratic behaviors that are poorly resolved at the video camera's frame rate and by the AMBA algorithms (Steele et al., 2007). As expected, the α6L9′S mice displayed a corresponding decrease in several relatively inactive behaviors,
J Neurosci. Author manuscript; available in PMC 2012 July 06.
Drenan et al.
Page 8
NIH-PA Author Manuscript
such as “pause”, “hang vertical”, “hang cuddled”, and “drink” (Figure 2C). For α6L9′S mice relative to WT littermates, we found a statistically significant difference for nine behaviors when we compared the percentage of total time spent exhibiting each behavior. α6L9′S mice spent less total time drinking, hanging cuddled, pausing, and grooming (Figure 2D). In contrast, α6L9′S mice spent a greater percentage of total time jumping, turning, rearing, and walking, as well as more time exhibiting “high-velocity” behaviors (Figure 2D). There was also a trend towards reduced eating and reduced resting in α6L9′S mice compared to WT controls (Figure 2D). To study the effect of the α6L9′S mutation in the context of a Chrna4 null mutant background, and to better understand the locomotor activity change that we noted in Figure 1A, we recorded and analyzed the detailed home cage behavior of α4KO and α4KO/α6L9′S mice. In contrast to the α6L9′S vs. WT littermate comparison, we noticed only modest differences in the median value for the behaviors in AMBA for α4KO/α6L9′S mice compared to α4KO controls (Figure 2C). Furthermore, differences in eight of the nine behaviors that were statistically significant in α6L9′S vs. WT were no longer significant in α4KO/α6L9′S vs. α4KO. Only rearing remained significantly different between the latter two genotypes (Figure 2E). In summary, these behavioral results show for the first time the importance of α4 subunits in α6* nAChR function in vivo.
NIH-PA Author Manuscript
Augmented DA release in α6L9′S mice requires α4 subunits
NIH-PA Author Manuscript
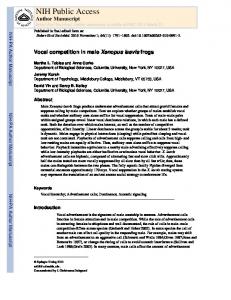
Locomotor hyperactivity is reminiscent of imbalances in striatal DA reported for other genetic models exhibiting abnormal DA transmission (Giros et al., 1996; Zhuang et al., 2001). α6* nAChRs are selectively expressed in SNc and VTA DA neurons cell bodies and their terminal fields, most notably dorsal and ventral striatum (Champtiaux et al., 2002; Champtiaux et al., 2003). Although the primary effect of the L9′S mutation is to augment the function of α6* receptors, it is possible that the behavioral differences seen between WT and α6L9′S or between α4KO and α4KO/α6L9′S are due to differences in receptor expression. To address this, we quantified the number of α4β2* and α6β2* binding sites using [125I]-epibatidine in striatum and olfactory tubercle of these mouse lines. We separately dissected the dorsal striatum (ST) and the olfactory tubercle (OT), thus roughly separating the nigrostriatal and mesolimbic DA pathways (Ikemoto, 2007). We used αCtxMII to separate α4β2* (MII-resistant) from α6β2* (MII-sensitive), the two predominant subtypes in this preparation. There was no significant difference in the number (Figure 3A and D) (ST: WT, 14.2 ± 1.0 fmol/mg protein; α6L9′S, 15.1 ± 2.4 fmol/mg protein; p > 0.05) (OT: WT, 10.6 ± 1.0 fmol/mg protein; α6L9′S, 9.0 ± 0.9 fmol/mg protein; p > 0.05) or the percentage (Figure 3B and E) (ST: WT, 23.7 ± 1.2 % MII-sens; α6L9′S, 24.0 ± 3.7 % MII-sens; p > 0.05) (OT: WT, 24.4 ± 2.0 % MII-sens; α6L9′S, 19.5 ± 1.7 % MII-sens; p > 0.05) of α6β2* binding sites between WT and α6L9′S mice, either in ST or OT, which is consistent with our previous analysis (Drenan et al., 2008b). In OT, we noticed a small but significant increase in MII-resistant (α4β2*) receptors in α6L9′S mice (OT: WT, 32.6 ± 1.3 fmol/mg protein; α6L9′S, 37.1 ± 0.5 fmol/mg protein; p < 0.01) (Figure 3F), but no change in ST (ST: WT, 45.5 ± 1.2 fmol/mg protein; α6L9′S, 47.7 ± 2.6 fmol/mg protein; p > 0.05) (Figure 3C). In α4KO mice, there was a 50-60% reduction in α6β2* receptor numbers in both brain areas (Figure 3A and D), consistent with previous studies (Salminen et al., 2005; Salminen et al., 2007). This was accompanied by a consequent increase in the percentage of MII-sensitive epibatidine binding in mice lacking α4 subunits compared to WT and α6L9′S mice (Figure 3B and E). We noted trace MII-resistant epibatidine binding in α4KO and α4KO/α6L9′S ST and OT (Figure 3C and F), which may represent a minor population of β4* nAChRs (Klink et al., 2001; Azam et al., 2002; Gahring et al., 2004). In both ST (Figure 3A) and OT (Figure 3D), there was a further reduction in α6β2* receptors in α4KO/α6L9′S tissue compared to α4KO (ST: α4KO, 6.0 ± 0.5 fmol/mg protein; α4KO/
J Neurosci. Author manuscript; available in PMC 2012 July 06.
Drenan et al.
Page 9
NIH-PA Author Manuscript
α6L9′S, 2.9 ± 0.4 fmol/mg protein; p < 0.001) (OT: α4KO, 2.9 ± 0.5 fmol/mg protein; α4KO/α6L9′S, 1.5 ± 0.2 fmol/mg protein; p < 0.05), but this did not correspond to any significance difference in the percentage of MII-sensitive binding sites in either of these brain areas (ST: α4KO, 61.1 ± 1.5 % MII-sens; α4KO/α6L9′S, 57.0 ± 3.1 % MII-sens; p > 0.05) (OT: α4KO, 41.8 ± 4.6 % MII-sens; α4KO/α6L9′S, 34.9 ± 4.0 % MII-sens; p > 0.05) (Figure 3B and E). There was a small difference in MII-resistant binding in ST for α4KO/ α6L9′S versus α4KO mice (ST: α4KO, 3.8 ± 0.3 fmol/mg protein; α4KO/α6L9′S, 2.2 ± 0.3 fmol/mg protein; p < 0.01) (Figure 3C), but not in OT (OT: α4KO, 4.1 ± 0.6 fmol/mg protein; α4KO/α6L9′S, 2.8 ± 0.2 fmol/mg protein; p > 0.05) (Figure 3F). Thus, receptor expression may account for a fraction of the effect seen in behavioral assays comparing α4KO vs. α4KO/α6L9′S mice, but not WT vs. α6L9′S mice.
NIH-PA Author Manuscript
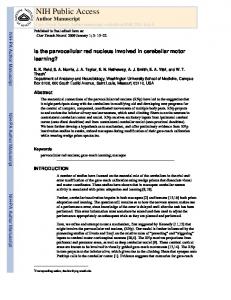
Functional aspects of presynaptic α4* and α6* nAChRs are effectively studied using agonist-evoked DA release from striatal synaptosomes (Grady et al., 2002). To study native nAChRs on DA terminals, we prepared synaptosomes from WT, α6L9′S, α4KO, and α4KO/ α6L9′S mice and measured nicotine-stimulated DA release. To separate responses dependent on α6-containing from α4(non-α6)-containing nAChRs, we blocked α6* nAChRs with αCtxMII as described previously (Salminen et al., 2004; Salminen et al., 2007). In measurements on OT tissue (Figure 4A), we noted a significant increase in Rmax and a substantial reduction in EC50 at α6* OT nAChRs (Figure 4B) comparing WT and α6L9′S mice (WT: Rmax = 4.6 ± 0.3 units, EC50 = 0.075 ± 0.025 μM; α6L9′S: Rmax = 14.7 ± 0.7 units, EC50 = 0.015 ± 0.004 μM; Rmax: p < 0.001; EC50: p < 0.05) (Figure 4G and H), consistent with previous results (Drenan et al., 2008b). We noted a corresponding decrease in Rmax at (non-α6) α4β2* nAChRs (Figure 4C) in α6L9′S OT (WT: Rmax = 14.5 ± 0.5 units; α6L9′S: Rmax = 7.4 ± 0.4 units; p < 0.001) (Figure G), but also saw a minor, yet significant decrease in EC50 at these receptors as well (WT: EC50 = 0.53 ± 0.09 μM; α6L9′S: EC50 = 0.24 ± 0.06 μM; p < 0.05) (Figure 4H). Thus, the apparent increase in α4β2* receptor (MII-resistant) numbers (Figure 3F) in α6L9′S OT had no observed functional consequence. Results for this genotype comparison were very similar in ST (Figure 4D) at α6β2* (Figure 4E) (WT: Rmax = 3.2 ± 0.3 units; α6L9′S: Rmax = 6.6 ± 0.5 units; p < 0.001) (WT: EC50 = 0.031 ± 0.017 μM; α6L9′S : EC50 = 0.016 ± 0.006 μM; p > 0.05) and (non-α6) α4β2* nAChRs (Figure 4F) (WT: Rmax = 15.8 ± 0.5 units; α6L9′S: Rmax = 7.8 ± 0.2 units; p < 0.001) (WT: EC50 = 0.53 ± 0.08 μM; α6L9′S: EC50 = 0.35 ± 0.03 μM; p > 0.05) (Figure 4D-H).
NIH-PA Author Manuscript
To study the effect of α4 subunit deletion on α6* nAChR function, we compared DA release results between α4KO and α4KO/α6L9′S mice. Previous results with α4KO mice showed decreased Rmax and increased EC50 compared to WT (Salminen et al., 2007), results that were replicated in this study. For α6* nAChRs in OT tissue (Figure 4B), we noted only a slight increase in Rmax for α4KO/α6L9′S mice when compared to α4KO mice (α4KO: Rmax = 3.83 ± 0.13 units; α4KO/α6L9′S: Rmax = 5.24 ± 0.24 units; p < 0.001) (Figure 4G). There was a significant reduction in EC50 for α4KO/α6L9′S compared to α4KO (α4KO: EC50 = 0.97 ± 0.15 μM; α4KO/α6L9′S: EC50 = 0.43 ± 0.09 μM; p < 0.01) (Figure 4H), but both values were at least one order of magnitude greater than for either WT or α6L9′S mice. Results in ST (Figure 4E) were similar for the α4KO background (α4KO: Rmax = 3.63 ± 0.15 units; α4KO/α6L9′S: Rmax = 4.16 ± 0.06 units; p < 0.01) (α4KO: EC50 = 0.88 ± 0.16 μM; α4KO/α6L9′S: EC50 = 0.25 ± 0.02 μM; p < 0.001) (Figure 4G and H). Thus, loss of α4 subunits from α6* nAChRs in α6L9′S mice severely reduces the sensitivity of these receptors at DA nerve terminals despite the presence of a sensitizing serine residue at the M2 9′ position. This decisively shows that without α4 subunits, DA neurons cannot augment their α6β2* receptor sensitivity by producing increased numbers of receptors with one or more L9′S α6 subunit.
J Neurosci. Author manuscript; available in PMC 2012 July 06.
Drenan et al.
Page 10
Burst firing selectively increases DA release in α6L9′S dorsal striatum
NIH-PA Author Manuscript
The results obtained with synaptosomes suggest that the hyperactivity observed in α6L9′S mice, which is eliminated or substantially reduced upon removal of α4 subunits, is due to differences in ACh-modulated DA release in striatum. Midbrain DA neurons exhibit both tonic and phasic firing profiles, and the transition to phasic firing is governed in part by pontine cholinergic inputs to DA neuron cell bodies (Lanca et al., 2000). DA neuron firing properties, in turn, strongly influence dopamine release. Therefore, we reasoned that α6L9′S mice may demonstrate alterations in DA release as a result of α6* nAChR hypersensitivity in DA neurons. To study striatal DA release in a preparation with intact DA fibers and functional AChmodulation of DA release, we measured DA overflow with fast-scan cyclic voltammetry at carbon fiber electrodes (CFEs) in coronal striatal slices (Figure 5A). We first calibrated the CFEs with solutions of DA dissolved in ACSF. Catecholamines such as DA and 5-HT produce characteristic oxidation and reduction voltage peaks (Zhou et al., 2005). DA detection was confirmed at our CFEs based on oxidation currents at +600 mV and reduction currents at -200 mV, respectively (Figure 5B, inset). Responses to pure DA were linear at our CFEs in the range of detection expected from striatal slices (0 to 5 μM) (Figure 5B). Electrically evoked DA release from dorsal striatum in slices revealed a voltammogram very similar to that of pure DA (Figure 5C, inset).
NIH-PA Author Manuscript NIH-PA Author Manuscript
Slice electrophysiological experiments in α6L9′S tissue show that nicotine administration increases firing in DA neurons, and that spontaneous ACh release from cholinergic terminals produces a detectable activation of α6L9′S* nAChRs on DA cell bodies (Drenan et al., 2008b) (data not shown). Endogenous ACh or exogenous nicotine may therefore augment DA neuron activity and result in more burst firing in α6L9′S mice. Alternatively (or additionally), DA release from presynaptic terminals may be augmented due to enhanced activity of hypersensitive α6* receptors. To determine the interplay between DA release and DA neuron firing frequency, and to assess the role of α4 subunits, we measured DA release amplitude and kinetics brain slices of WT, α6L9′S and α4KO/α6L9′S mice. Because α6L9′S mice display a locomotor phenotype (Figures 1-2), we focused our experiments on dorsal striatum, the region most strongly implicated in motor function and the region dissected for the ST samples in the synaptosome experiments. We measured absolute DA release following single pulse (1p) stimulation and four pulse (4p, 100 Hz) burst stimulation, which resembles the greatest firing rate for DA neurons in mammals (Hyland et al., 2002; Bayer and Glimcher, 2005). In WT slices, we noted a marked short term synaptic depression for 4p stimulation compared to 1p (Figure 5C, left panel; Figure 5D), which is consistent with other reports utilizing acutely cut slices (Schmitz et al., 2002; Rice and Cragg, 2004; Zhang and Sulzer, 2004; Exley et al., 2007). α6L9′S slices displayed a substantial reduction in peak DA release compared to WT 1p stimulation (WT 1p: 0.92 ± 0.06 μM; α6L9′S 1p: 0.34 ± 0.05 μM; p < 0.001) (Figure 5C, middle panel). Unlike WT, however, α6L9′S slices did not show synaptic depression, as peak DA responses following 4p stimulation were significantly greater than for 1p stimulation (WT: 1p = 0.92 ± 0.06 μM; 4p = 1.04 ± 0.11 μM; p > 0.05) (α6L9′S: 1p = 0.34 ± 0.05 μM; 4p = 0.94 ± 0.19 μM; p < 0.01) (Figure 5C and D). Interestingly, we noted only a slight reduction in peak 1p DA release in α4KO/α6L9′S mice compared to WT (WT 1p: 0.92 ± 0.06 μM; α4KO/α6L9′S 1p: 0.70 ± 0.08 μM; p < 0.05) (Figure 5C, right panel; Figure 5D). Removal of α4 subunits from α6L9′S mice recapitulated the synaptic depression phenomenon seen in WT slices, as 4p stimulation was slightly but not significantly elevated compared to 1p stimulation in α4KO/α6L9′S slices (α4KO/ α6L9′S: 1p = 0.70 ± 0.08 μM; 4p = 0.97 ± 0.11 μM; p > 0.05) (Figure 5C, right panel; Figure 5D).
J Neurosci. Author manuscript; available in PMC 2012 July 06.
Drenan et al.
Page 11
NIH-PA Author Manuscript NIH-PA Author Manuscript
Although neither 1p nor 4p peak DA responses in α6L9′S slices exceeded those in WT slices, we noted substantial alterations to the DA response waveform (Figure 5C, middle panel) in experiments with α6L9′S tissue. To better understand the effect on DA waveforms caused by the α6L9′S mutation, we analyzed the responses in Figure 5C for 10%-90% rise time and decay time constant (tau). In WT slices, there was no significant difference between 1p and 4p for rise time or tau (Rise time: WT 1p = 317 ± 14 ms; WT 4p = 375 ± 33 ms; p > 0.05) (Tau: WT 1p = 650 ± 82 ms; WT 4p = 842 ± 268 ms; p > 0.05) (Figure 5E and F). In contrast, rise time following 1p stimulation in α6L9′S slices was substantially elevated compared to 1p (or 4p) responses in WT slices (α6L9′S: 1p = 617 ± 70 ms; WT: 1p = 317 ± 17 ms; p < 0.01) (α6L9′S: 1p = 617 ± 70 ms; WT: 4p = 375 ± 33 ms; p < 0.01) (Figure 5E). Further, there was an additional increase in rise time for 4p responses compared to 1p in α6L9′S slices (α6L9′S: 1p = 617 ± 70 ms; 4p = 804 ± 28 ms; p < 0.05) (Figure 5E). Tau values were also significantly increased for 4p versus 1p stimulation in α6L9′S slices (α6L9′S: 1p = 824 ± 164 ms; 4p = 1990 ± 221 ms; p < 0.01) (Figure 5F), suggesting that extracellular DA persists in α6L9′S dorsal striatum in response to a burst of action potentials. α4 subunits are apparently required for the effect seen in α6L9′S mice, as there was no significant effect on rise time or decay time constant in α4KO/α6L9′S mice when we compared 1p and 4p stimulation (Rise time: α4KO/α6L9′S 1p = 305 ± 36 ms; α4KO/α6L9′S 4p = 362 ± 59 ms; p > 0.05) (Tau: α4KO/α6L9′S 1p = 504 ± 131 ms; α4KO/α6L9′S 4p = 1019 ± 271 ms; p > 0.05) (Figure 5E and F). We did notice significant differences in the maximum decay slope of the 1p and 4p responses among the three genotypes studied. WT DA responses exhibited the fastest DA uptake (i.e. greatest negative-going maximum decay slope) (1p, -0.00100 ± 0.00007 μM/msec; 4p, -0.00120 ± 0.00017 μM/msec), α6L9′S responses were the slowest (1p, -0.00006 ± 0.00003 μM/msec; 4p, -0.00028 ± 0.00002 μM/ msec), and α4KO/α6L9′S responses exhibited an intermediate value (1p, -0.00043 ± 0.00008 μM/msec; 4p, -0.00053 ± 0.00011 μM/msec). Maximum decay slope indicates the speed of DA uptake at a saturating concentration of DA, thus these differences may reflect changes in DA transporter Vmax (see Discussion). The prolonged decay kinetics seen in 1p and 4p DA release responses in α6L9′S slices (Figure 5F) suggested that the integrated DA response in these mice may differ more substantially than peak measurements would suggest. Area under the curve measurements (Zhang et al., 2009) for 1p and 4p responses in the three genotypes under study were normalized to WT 1p responses. Unlike WT and α4KO/α6L9′S slices, α6L9′S slices showed a significantly elevated 4p DA response compared to 1p stimulation (WT: 1p = 1.0 ± 0.06; 4p = 1.0 ± 0.14; p > 0.05) (α6L9′S: 1p = 0.5 ± 0.1; 4p = 1.6 ± 0.3; p < 0.001) (α4KO/α6L9′S: 1p = 0.8 ± 0.1; 4p = 1.1 ± 0.2; p > 0.05) (Figure 5G).
NIH-PA Author Manuscript
To further isolate and study the effect of the α6L9′S mutation and DA neuron firing frequency on evoked DA release, we conducted paired-pulse experiments. In dorsal striatum, DA release displays marked short term synaptic depression when pulses are paired at frequencies from 1-100 Hz (Cragg, 2003; Rice and Cragg, 2004; Zhang and Sulzer, 2004). In nucleus accumbens, however, initial release probability is lower but paired pulse depression is not as severe (Cragg, 2003; Zhang et al., 2009). In WT dorsal striatum, we also measured significant synaptic depression comparing a first pulse (p1; 0.89 ± 0.21 μM DA) with a second (p2; 0.09 ± 0.05 μM DA) (Figure 6A, left panel). In contrast, experiments in α6L9′S slices revealed no synaptic depression, as peak [DA]o was approximately equivalent for p1 (0.20 ± 0.03 μM DA) and p2 (0.19 ± 0.05 μM DA) (Figure 6A, middle panel). This lack of synaptic depression was reflected in a significantly increased paired-pulse ratio for α6L9′S mice versus WT (WT: 0.13 ± 0.06; α6L9′S: 0.67 ± 0.15; p < 0.01) (Figure 6B). Again, the gain in synaptic facilitation afforded by the α6L9′S mutation was completely reversed by loss of α4 subunits: α4KO/α6L9′S p1 peak DA (0.85 ± 0.13 μM DA) returned to WT levels, p2 responses (0.14 ± 0.10 μM DA) were similar to those seen in WT, and the paired-pulse ratio for α4KO/α6L9′S release (0.12 ± 0.09) was comparable to WT (Figure 6A J Neurosci. Author manuscript; available in PMC 2012 July 06.
Drenan et al.
Page 12
NIH-PA Author Manuscript
and B). Thus, taken together, these electrochemical experiments suggest that patterns of tonic and phasic activity in DA neuron firing in α6L9′S mice results in substantially altered patterns of DA release, from reduced DA release during tonic firing to augmented synaptic DA during phasic firing.
NIH-PA Author Manuscript
DA release and uptake, as well as a variety of mouse behaviors, can be influenced by alterations in components of the DA system such as D1-class and D2-class dopamine receptors and the dopamine transporter (DAT). In particular, DA synaptic lifetime in ST is strongly influenced by the rate of uptake by DAT (Giros et al., 1996; Zhuang et al., 2001; Rice and Cragg, 2008). Further, mice lacking D2 receptors have a decreased peak and duration of DA release in response to single pulses (Schmitz et al., 2002). To determine whether any substantial alterations in these components of the DA system might account for our behavioral or physiological results, we measured DAT, D1 and D2 DA receptors by ligand binding in tissue homogenates. In ST, there were no differences in DAT levels as determined by [3H]-mazindol binding (Figure 7A), whereas we did note an increase in DAT levels in α6L9′S OT versus WT OT (WT = 1083 ± 102 fmol/mg protein; α6L9′S = 1503 ± 191 fmol/mg protein; p < 0.05) (Figure 7A). For D1-class receptors, there was no statistically significant difference in [3H]-SCH23390 ligand binding for any genotype comparison in either OT or ST (Figure 7B). Similarly, there was also no significant difference in D2-class receptors (measured with [3H]-raclopride) in OT or ST for any genotype comparison (Figure 7C). We took note of the overall reduction in DAT and D2 receptor levels in the ventral relative to dorsal striatum, which is consistent with a recent report (Lammel et al., 2008). To directly measure DAT function in vitro, we performed DAT uptake assays using synaptosomes similar to those used for DA release. Using established methods for determining DAT function (Grady et al., 2002), we estimated DAT KM to be 80 nM DA (data not shown), which was consistent with previous studies (Giros et al., 1996; Parish et al., 2005). At a [DA]o close to the KM (50 nM), and at a maximal [DA]o (1 μM), there was little effect on DA uptake for any genotype comparison (Figure 7D and E). Interestingly, these two concentrations of DA roughly correspond to the EC50 for activation of D2 and D1 receptors, respectively. There was a significant difference between α4KO and α4KO/α6L9′S only in OT but not ST, and only at 1.0 μM [DA]o (α4KO = 6.4 ± 0.8 pmol DA/μg protein/min; α4KO/α6L9′S = 4.3 ± 0.4 pmol DA/μg protein/min; p < 0.05) (Figure 7E). There was no difference in either brain region for any genotype comparison for the 1.0 μM [DA]o (~20X KM) / 0.05 μM [DA]o (~KM) ratio of uptake rates (Figure 7F).
Discussion NIH-PA Author Manuscript
Overall, these data are consistent with the idea that cholinergic control over DA release exerts greater influence in α6L9′S mice due to α6* nAChR hypersensitivity (Figure 8). Similar to other in vitro electrochemistry studies, we show that in WT dorsal striatum, single stimulus pulses or brief trains in DA fibers elicit similar levels of DA release due to short term synaptic depression (Figure 8A). Several reports show that decreased presynaptic nAChR activity, via desensitization, pharmacological blockade, or decreased ACh release from striatal cholinergic interneurons, can alter short term depression and enhance the difference in efficacy between single pulses and bursts (Zhou et al., 2001; Rice and Cragg, 2004; Zhang and Sulzer, 2004; Threlfell et al., 2010). In this study, increased nAChR function can also enhance this difference. In mice with hypersensitive α6L9′S* nAChRs, single APs combine with nAChR activity to result in reduced DA release (Figure 8B). In these mice, however, released DA is present for longer periods (Figure 5E and F), paired pulse depression (PPD) is reduced (Figure 6B), and bursts of APs lead to more overall DA release (Figure 5G).
J Neurosci. Author manuscript; available in PMC 2012 July 06.
Drenan et al.
Page 13
NIH-PA Author Manuscript NIH-PA Author Manuscript
In some respects, our electrochemistry results in dorsal striatum, where DA release following single pulse stimulation in α6L9′S slices is reduced and PPD in relieved relative to WT and α4KO/α6L9′S tissue, resembles experiments where nAChR activity is blocked prior to DA fiber stimulation. Indeed, reducing striatal nAChR activity with desensitizing applications of nicotine or antagonists such as dihydro-beta-erythroidine (DHβE) or mecamylamine results in less DA release in response to a single stimulus (Zhou et al., 2001; Rice and Cragg, 2004; Zhang and Sulzer, 2004). These studies also demonstrate that PPD is substantially reduced when nAChR activity is eliminated by these applications. We see a similar result in α6L9′S slices relative to WT: reduced peak DA release following single stimulations (Figure 5C and 6A). We also noted that the DA release profile in α6L9′S dorsal striatum is similar in some respects to the profile in DA D2 receptor KO mice. In these mice, as in ours, DA release following single pulse stimulation is reduced relative to WT mice (Schmitz et al., 2002). Interestingly, our results in α6L9′S dorsal striatum more closely resemble the normal pattern of DA release in ventral striatum of mice and primates. Electrochemical recordings in nucleus accumbens shell of mice (Zhang et al., 2009) or primates (Cragg, 2003) reveals that ventral regions of the striatum are characterized by reduced peak DA release following single stimulation, and paired pulse results showing little PPD or even paired-pulse facilitation (PPF). This is thought to occur via differences in Ca2+ availability in presynaptic terminals of these two brain areas. Thus, in some respects our DA release results in α6L9′S mice are quite similar to various studies, including reports using pharmacological agents or other genetic mutations to manipulate the DA system, as well as reports in different species. In other respects, however, our electrochemical results differ from previous studies. For example, whereas many studies involving elimination of nAChR activity demonstrate that brief trains (e.g. 4p) result in augmented peak DA release compared to identical stimulations under control conditions (Rice and Cragg, 2004; Exley et al., 2007; Zhang et al., 2009), we did not see an increase in peak DA relative to WT slices following 4p stimulus protocols (Figure 5D). Most importantly, though, DA waveforms in α6L9′S dorsal striatum display novel kinetics. We report that DA responses in α6L9′S dorsal striatum are slower to reach peak concentration (Figure 5E), and also decay more slowly following cessation of the stimulus (Figure 5F). These effects on DA kinetics are not seen in studies where nAChR activity is altered with pharmacological agents, and are typically only apparent when the DA transporter is genetically eliminated/reduced, or pharmacologically blocked (Giros et al., 1996; Zhuang et al., 2001; Cragg, 2003; Senior et al., 2008; Zhang et al., 2009).
NIH-PA Author Manuscript
What causes the altered DA release pattern seen in α6L9′S dorsal striatum? ACh release from cholinergic interneurons, perhaps augmented by electrical stimulation of the tissue, may play a role in α6L9′S altered DA release, likely via differences in receptor sensitivity to ligand (Figure 4H). Although intrinsic differences in ACh release probability (and consequent α6* nAChR activation) by cholinergic interneurons in intact α6L9′S versus WT mice are possible, WT and α6L9′S cholinergic interneurons have equivalent firing rates and largely similar membrane properties (Drenan et al., 2008b). We cannot rule out that compensatory or adaptive mechanisms, operating as the animals mature, might cause the reduced 1p release and/or prolonged release kinetics. For instance, α6L9′S presynaptic terminals may have undergone a change in their channel repertoire that renders them hypersensitive to repetitive stimulation. Changes in the ratio of α4*(non-α6)/α6* function, which are present in α6L9′S mice, may be such an adaptation. Alternatively, the reduction in peak DA release following single and/or burst stimulation may be an adaptive response to the prolonged release kinetics, similar to DAT KO mice (Giros et al., 1996). In a previous study, we showed that hypersensitive α6L9′S channels are tonically active in DA neuron somata (Drenan et al., 2008b), suggesting that tonic cholinergic input to
J Neurosci. Author manuscript; available in PMC 2012 July 06.
Drenan et al.
Page 14
NIH-PA Author Manuscript
midbrain DA areas may depolarize DA neurons and/or increase their firing rate in vivo. Furthermore, ligand-gated cation currents through α6L9′S channels in these cells are prolonged compared to their WT counterparts (Drenan et al., 2008b), which reflects the significant increase in single channel burst duration in nAChRs with L9′S mutations (Labarca et al., 1995). In striatum, presynaptic and/or axonal α6L9′S channels may similarly depolarize DA fibers/terminals due to these changes at the single channel level. Axonal depolarization can significantly alter the action potential waveform (Shu et al., 2006; Kole et al., 2007), and tonic depolarization of the presynaptic terminal would be expected to reduce Vmax for the DA transporter (Huang et al., 1999), resulting in slower DA re-uptake following release. Indeed, in PC12 cells expressing DAT and nAChRs, nAChR activation resulted in membrane depolarization and a reduction in DAT uptake velocity (Huang et al., 1999). Although our DAT binding and functional experiments show that there are no intrinsic differences in DAT expression levels or enzymatic function in vitro in the four genotypes examined (Figure 7), they do not address the possibility that α6L9′S channels depolarize DA fibers and reduce DAT function in slices and/or in vivo. Alternatively, α6L9′S DA fibers may have normal resting membrane potentials but undergo prolonged depolarization (due to activation of α6L9′S channels by ACh) during electrical stimulation of the slice, resulting in extended periods of slowed DAT uptake velocity during the time scale of our measurements.
NIH-PA Author Manuscript
Future studies are needed to fully determine the mechanism that gives rise to the alterations in DA release seen in α6L9′S dorsal striatum. It is important to note that, unlike in vitro slice experiments, studies of DA release in vivo are characterized by much smaller DA signals (Michael and Wightman, 1999) and do not show substantial synaptic depression (Chergui et al., 1994). Thus, it will be important to study DA neuron firing and DA release in awake, behaving α6L9′S mice in future studies. Nevertheless, these alterations along with changes in excitability of DA neuron cell bodies in midbrain are sufficient to cause the complex behavioral phenotypes that were observed in α6L9′S mice. We suggest that α6L9′S mouse behavioral hyperactivity results both from 1) a more efficacious action of ACh on DA neuron dendrites and somata harboring hypersensitive α6α4β2* channels, resulting in more phasic firing, and 2) DA fibers in striatum that have more effective frequency filtering (Exley et al., 2007; Exley and Cragg, 2008), where activation of α6L9′S channels by ACh permits DA fibers to diminish their output in response to tonic firing yet augment DA release in response to bouts of phasic firing. In contrast to other recent studies that amplify and isolate phasic DA neuron firing to alter DA-dependent behaviors with gene knockouts (Zweifel et al., 2009) and optogenetics (Tsai et al., 2009), we show that the cholinergic system can be manipulated to alter DA release and modify a variety of behaviors in mammals.
NIH-PA Author Manuscript
More specifically, this study demonstrates the importance of α6α4β2* nAChRs in governing cholinergic control over DA release, and reinforces the idea that compounds capable of selectively targeting α6α4β2* nAChRs could be useful in manipulating the DA system in disorders such as nicotine dependence, PD, schizophrenia, or attention deficit hyperactivity disorder. Such drug therapies that regulate dopaminergic output via modification of somatic and/or presynaptic α6α4β2* receptors may give better outcomes than DA agonists or DA replacement therapies, as the natural spatiotemporal activity patterns of DA neurons would be better preserved. For example, stimulating DA release with α6α4β2* selective compounds in PD may alleviate dyskinesias associated with LDopa therapy if co-administration of the nAChR compound allowed the clinician to reduce the necessary dose of L-Dopa (Quik and McIntosh, 2006; Quik et al., 2008; Bordia et al., 2010).
J Neurosci. Author manuscript; available in PMC 2012 July 06.
Drenan et al.
Page 15
Acknowledgments NIH-PA Author Manuscript
We thank members of the Lester lab for helpful discussion. Thanks to P. Deshpande, M. Liu, C. Xiao, E. Mackey, G. Akopian, S. Benazouz, L. Sandoval, C. Baddick, and C. Wageman. We thank Oliver King and Cynthia Hsu for writing Matlab programs for home cage behavior data analysis. This work was supported by grants from NIH (DA17279 and AG033954 to H.A.L.; DA19375 to H.A.L. and M.J.M.; DA12242, DA015663 and DA03194 to M.J.M.; MH53631 and GM48677 to J.M. McIntosh), the Moore Foundation, the Croll Research Foundation (to J.M. Miwa), and the California Tobacco Related Disease Research Program (TRDRP; 12RT-0245 to H.A.L.). A.D.S. is funded by the Broad Fellow Program in Brain Circuitry at Caltech and an Ellison Medical Foundation New Scholar in Aging award. R.M.D. was supported by postdoctoral fellowships from TRDRP (15FT-0030) and NIH (DA021492 and NS007251).
References
NIH-PA Author Manuscript NIH-PA Author Manuscript
Akopian G, Crawford C, Beal MF, Cappelletti M, Jakowec MW, Petzinger GM, Zheng L, Gheorghe SL, Reichel CM, Chow R, Walsh JP. Decreased striatal dopamine release underlies increased expression of long-term synaptic potentiation at corticostriatal synapses 24 h after 3-nitropropionicacid-induced chemical hypoxia. J Neurosci. 2008; 28:9585–9597. [PubMed: 18799690] Azam L, Winzer-Serhan UH, Chen Y, Leslie FM. Expression of neuronal nicotinic acetylcholine receptor subunit mRNAs within midbrain dopamine neurons. J Comp Neurol. 2002; 444:260–274. [PubMed: 11840479] Bayer HM, Glimcher PW. Midbrain dopamine neurons encode a quantitative reward prediction error signal. Neuron. 2005; 47:129–141. [PubMed: 15996553] Bordia T, Campos C, McIntosh JM, Quik M. Nicotinic receptor-mediated reduction in L-dopa-induced dyskinesias may occur via desensitization. J Pharmacol Exp Ther. 2010; 2010:3. Brown RW, Collins AC, Lindstrom JM, Whiteaker P. Nicotinic α5 subunit deletion locally reduces high-affinity agonist activation without altering nicotinic receptor numbers. J Neurochem. 2007; 103:204–215. [PubMed: 17573823] Cartier GE, Yoshikami D, Gray WR, Luo S, Olivera BM, McIntosh JM. A new α-conotoxin which targets α3β2 nicotinic acetylcholine receptors. J Biol Chem. 1996; 271:7522–7528. [PubMed: 8631783] Champtiaux N, Han ZY, Bessis A, Rossi FM, Zoli M, Marubio L, McIntosh JM, Changeux JP. Distribution and pharmacology of α6-containing nicotinic acetylcholine receptors analyzed with mutant mice. J Neurosci. 2002; 22:1208–1217. [PubMed: 11850448] Champtiaux N, Gotti C, Cordero-Erausquin M, David DJ, Przybylski C, Lena C, Clementi F, Moretti M, Rossi FM, Le Novere N, McIntosh JM, Gardier AM, Changeux JP. Subunit composition of functional nicotinic receptors in dopaminergic neurons investigated with knock-out mice. J Neurosci. 2003; 23:7820–7829. [PubMed: 12944511] Chergui K, Suaud-Chagny MF, Gonon F. Nonlinear relationship between impulse flow, dopamine release and dopamine elimination in the rat brain in vivo. Neuroscience. 1994; 62:641–645. [PubMed: 7870295] Coe JW, et al. Varenicline: an α4β2 nicotinic receptor partial agonist for smoking cessation. J Med Chem. 2005; 48:3474–3477. [PubMed: 15887955] Cragg SJ. Variable dopamine release probability and short-term plasticity between functional domains of the primate striatum. J Neurosci. 2003; 23:4378–4385. [PubMed: 12764127] Cui C, Booker TK, Allen RS, Grady SR, Whiteaker P, Marks MJ, Salminen O, Tritto T, Butt CM, Allen WR, Stitzel JA, McIntosh JM, Boulter J, Collins AC, Heinemann SF. The β3 nicotinic receptor subunit: a component of α-Conotoxin MII-binding nicotinic acetylcholine receptors that modulate dopamine release and related behaviors. J Neurosci. 2003; 23:11045–11053. [PubMed: 14657161] Drenan RM, Nashmi R, Imoukhuede P, Just H, McKinney S, Lester HA. Subcellular trafficking, pentameric assembly, and subunit stoichiometry of neuronal nicotinic acetylcholine receptors containing fluorescently labeled α6 and β3 subunits. Mol Pharmacol. 2008a; 73:27–41. [PubMed: 17932221] Drenan RM, Grady SR, Whiteaker P, McClure-Begley T, McKinney S, Miwa JM, Bupp S, Heintz N, McIntosh JM, Bencherif M, Marks MJ, Lester HA. In vivo activation of midbrain dopamine
J Neurosci. Author manuscript; available in PMC 2012 July 06.
Drenan et al.
Page 16
NIH-PA Author Manuscript NIH-PA Author Manuscript NIH-PA Author Manuscript
neurons via sensitized, high-affinity α6* nicotinic acetylcholine receptors. Neuron. 2008b; 60:123–136. [PubMed: 18940593] Exley R, Cragg SJ. Presynaptic nicotinic receptors: a dynamic and diverse cholinergic filter of striatal dopamine neurotransmission. Br J Pharmacol. 2008; 153(Suppl 1):S283–297. [PubMed: 18037926] Exley R, Clements MA, Hartung H, McIntosh JM, Cragg SJ. α6-Containing Nicotinic Acetylcholine Receptors Dominate the Nicotine Control of Dopamine Neurotransmission in Nucleus Accumbens. Neuropsychopharmacology. 2007; 21:21. Gahring LC, Persiyanov K, Rogers SW. Neuronal and astrocyte expression of nicotinic receptor subunit β4 in the adult mouse brain. J Comp Neurol. 2004; 468:322–333. [PubMed: 14681928] Giros B, Jaber M, Jones SR, Wightman RM, Caron MG. Hyperlocomotion and indifference to cocaine and amphetamine in mice lacking the dopamine transporter. Nature. 1996; 379:606–612. [PubMed: 8628395] Gotti C, Moretti M, Clementi F, Riganti L, McIntosh JM, Collins AC, Marks MJ, Whiteaker P. Expression of nigrostriatal α6-containing nicotinic acetylcholine receptors is selectively reduced, but not eliminated, by β3 subunit gene deletion. Mol Pharmacol. 2005; 67:2007–2015. [PubMed: 15749993] Grady SR, Murphy KL, Cao J, Marks MJ, McIntosh JM, Collins AC. Characterization of nicotinic agonist-induced [3H]dopamine release from synaptosomes prepared from four mouse brain regions. J Pharmacol Exp Ther. 2002; 301:651–660. [PubMed: 11961070] Huang CL, Chen HC, Huang NK, Yang DM, Kao LS, Chen JC, Lai HL, Chern Y. Modulation of dopamine transporter activity by nicotinic acetylcholine receptors and membrane depolarization in rat pheochromocytoma PC12 cells. J Neurochem. 1999; 72:2437–2444. [PubMed: 10349853] Hyland BI, Reynolds JN, Hay J, Perk CG, Miller R. Firing modes of midbrain dopamine cells in the freely moving rat. Neuroscience. 2002; 114:475–492. [PubMed: 12204216] Ikemoto S. Dopamine reward circuitry: two projection systems from the ventral midbrain to the nucleus accumbens-olfactory tubercle complex. Brain Res Rev. 2007; 56:27–78. [PubMed: 17574681] Klink R, de Kerchove d'Exaerde A, Zoli M, Changeux JP. Molecular and physiological diversity of nicotinic acetylcholine receptors in the midbrain dopaminergic nuclei. J Neurosci. 2001; 21:1452– 1463. [PubMed: 11222635] Kole MH, Letzkus JJ, Stuart GJ. Axon initial segment Kv1 channels control axonal action potential waveform and synaptic efficacy. Neuron. 2007; 55:633–647. [PubMed: 17698015] Labarca C, Nowak MW, Zhang H, Tang L, Deshpande P, Lester HA. Channel gating governed symmetrically by conserved leucine residues in the M2 domain of nicotinic receptors. Nature. 1995; 376:514–516. [PubMed: 7637783] Lammel S, Hetzel A, Hackel O, Jones I, Liss B, Roeper J. Unique properties of mesoprefrontal neurons within a dual mesocorticolimbic dopamine system. Neuron. 2008; 57:760–773. [PubMed: 18341995] Lanca AJ, Adamson KL, Coen KM, Chow BL, Corrigall WA. The pedunculopontine tegmental nucleus and the role of cholinergic neurons in nicotine self-administration in the rat: a correlative neuroanatomical and behavioral study. Neuroscience. 2000; 96:735–742. [PubMed: 10727791] Marks MJ, Whiteaker P, Collins AC. Deletion of the α7, β2, or β4 nicotinic receptor subunit genes identifies highly expressed subtypes with relatively low affinity for [3H]epibatidine. Mol Pharmacol. 2006; 70:947–959. [PubMed: 16728647] Marubio LM, Gardier AM, Durier S, David D, Klink R, Arroyo-Jimenez MM, McIntosh JM, Rossi F, Champtiaux N, Zoli M, Changeux JP. Effects of nicotine in the dopaminergic system of mice lacking the α4 subunit of neuronal nicotinic acetylcholine receptors. Eur J Neurosci. 2003; 17:1329–1337. [PubMed: 12713636] Maskos U, Molles BE, Pons S, Besson M, Guiard BP, Guilloux JP, Evrard A, Cazala P, Cormier A, Mameli-Engvall M, Dufour N, Cloez-Tayarani I, Bemelmans AP, Mallet J, Gardier AM, David V, Faure P, Granon S, Changeux JP. Nicotine reinforcement and cognition restored by targeted expression of nicotinic receptors. Nature. 2005; 436:103–107. [PubMed: 16001069]
J Neurosci. Author manuscript; available in PMC 2012 July 06.
Drenan et al.
Page 17
NIH-PA Author Manuscript NIH-PA Author Manuscript NIH-PA Author Manuscript
Michael DJ, Wightman RM. Electrochemical monitoring of biogenic amine neurotransmission in real time. J Pharm Biomed Anal. 1999; 19:33–46. [PubMed: 10698566] Nashmi R, Xiao C, Deshpande P, McKinney S, Grady SR, Whiteaker P, Huang Q, McClure-Begley T, Lindstrom JM, Labarca C, Collins AC, Marks MJ, Lester HA. Chronic nicotine cell specifically upregulates functional α4* nicotinic receptors: basis for both tolerance in midbrain and enhanced long-term potentiation in perforant path. J Neurosci. 2007; 27:8202–8218. [PubMed: 17670967] Parish CL, Nunan J, Finkelstein DI, McNamara FN, Wong JY, Waddington JL, Brown RM, Lawrence AJ, Horne MK, Drago J. Mice lacking the α4 nicotinic receptor subunit fail to modulate dopaminergic neuronal arbors and possess impaired dopamine transporter function. Mol Pharmacol. 2005; 68:1376–1386. [PubMed: 16077034] Picciotto MR, Zoli M, Rimondini R, Lena C, Marubio LM, Pich EM, Fuxe K, Changeux JP. Acetylcholine receptors containing the β2 subunit are involved in the reinforcing properties of nicotine. Nature. 1998; 391:173–177. [PubMed: 9428762] Quik M, McIntosh JM. Striatal α6* nicotinic acetylcholine receptors: potential targets for Parkinson's disease therapy. J Pharmacol Exp Ther. 2006; 316:481–489. [PubMed: 16210393] Quik M, O'Leary K, Tanner CM. Nicotine and Parkinson's disease: implications for therapy. Mov Disord. 2008; 23:1641–1652. [PubMed: 18683238] Rice ME, Cragg SJ. Nicotine amplifies reward-related dopamine signals in striatum. Nat Neurosci. 2004; 7:583–584. [PubMed: 15146188] Rice ME, Cragg SJ. Dopamine spillover after quantal release: rethinking dopamine transmission in the nigrostriatal pathway. Brain Res Rev. 2008; 58:303–313. [PubMed: 18433875] Ross SA, Wong JY, Clifford JJ, Kinsella A, Massalas JS, Horne MK, Scheffer IE, Kola I, Waddington JL, Berkovic SF, Drago J. Phenotypic characterization of an α4 neuronal nicotinic acetylcholine receptor subunit knock-out mouse. J Neurosci. 2000; 20:6431–6441. [PubMed: 10964949] Salminen O, Whiteaker P, Grady SR, Collins AC, McIntosh JM, Marks MJ. The subunit composition and pharmacology of α-Conotoxin MII-binding nicotinic acetylcholine receptors studied by a novel membrane-binding assay. Neuropharmacology. 2005; 48:696–705. [PubMed: 15814104] Salminen O, Drapeau JA, McIntosh JM, Collins AC, Marks MJ, Grady SR. Pharmacology of αConotoxin MII-Sensitive Subtypes of Nicotinic Acetylcholine Receptors Isolated by Breeding of Null Mutant Mice. Mol Pharmacol. 2007; 71:1563–1571. [PubMed: 17341654] Salminen O, Murphy KL, McIntosh JM, Drago J, Marks MJ, Collins AC, Grady SR. Subunit composition and pharmacology of two classes of striatal presynaptic nicotinic acetylcholine receptors mediating dopamine release in mice. Mol Pharmacol. 2004; 65:1526–1535. [PubMed: 15155845] Schmitz Y, Schmauss C, Sulzer D. Altered dopamine release and uptake kinetics in mice lacking D2 receptors. J Neurosci. 2002; 22:8002–8009. [PubMed: 12223553] Schulte A, Chow RH. A simple method for insulating carbon-fiber microelectrodes using anodic electrophoretic deposition of paint. Anals of Chemistry. 1996; 68:3054–3058. Senior SL, Ninkina N, Deacon R, Bannerman D, Buchman VL, Cragg SJ, Wade-Martins R. Increased striatal dopamine release and hyperdopaminergic-like behaviour in mice lacking both alphasynuclein and gamma-synuclein. Eur J Neurosci. 2008; 27:947–957. [PubMed: 18333965] Shu Y, Hasenstaub A, Duque A, Yu Y, McCormick DA. Modulation of intracortical synaptic potentials by presynaptic somatic membrane potential. Nature. 2006; 441:761–765. [PubMed: 16625207] Steele AD, Jackson WS, King OD, Lindquist S. The power of automated high-resolution behavior analysis revealed by its application to mouse models of Huntington's and prion diseases. Proc Natl Acad Sci U S A. 2007; 104:1983–1988. [PubMed: 17261803] Steele AD, Hutter G, Jackson WS, Heppner FL, Borkowski AW, King OD, Raymond GJ, Aguzzi A, Lindquist S. Heat shock factor 1 regulates lifespan as distinct from disease onset in prion disease. Proc Natl Acad Sci U S A. 2008; 105:13626–13631. [PubMed: 18757733] Tapper AR, McKinney SL, Marks MJ, Lester HA. Nicotine responses in hypersensitive and knockout α4 mice account for tolerance to both hypothermia and locomotor suppression in wild-type mice. Physiol Genomics. 2007; 31:422–428. [PubMed: 17712039]
J Neurosci. Author manuscript; available in PMC 2012 July 06.
Drenan et al.
Page 18
NIH-PA Author Manuscript NIH-PA Author Manuscript
Threlfell S, Clements MA, Khodai T, Pienaar IS, Exley R, Wess J, Cragg SJ. Striatal Muscarinic Receptors Promote Activity Dependence of Dopamine Transmission via Distinct Receptor Subtypes on Cholinergic Interneurons in Ventral versus Dorsal Striatum. J Neurosci. 2010; 30:3398–3408. [PubMed: 20203199] Tsai HC, Zhang F, Adamantidis A, Stuber GD, Bonci A, de Lecea L, Deisseroth K. Phasic firing in dopaminergic neurons is sufficient for behavioral conditioning. Science. 2009; 324:1080–1084. [PubMed: 19389999] Xiao C, Nashmi R, McKinney S, Cai H, McIntosh JM, Lester HA. Chronic nicotine selectively enhances α4β2* nicotinic acetylcholine receptors in the nigrostriatal dopamine pathway. J Neurosci. 2009; 29:12428–12439. [PubMed: 19812319] Zhang H, Sulzer D. Frequency-dependent modulation of dopamine release by nicotine. Nat Neurosci. 2004; 7:581–582. [PubMed: 15146187] Zhang T, Zhang L, Liang Y, Siapas AG, Zhou FM, Dani JA. Dopamine signaling differences in the nucleus accumbens and dorsal striatum exploited by nicotine. J Neurosci. 2009; 29:4035–4043. [PubMed: 19339599] Zhou FM, Liang Y, Dani JA. Endogenous nicotinic cholinergic activity regulates dopamine release in the striatum. Nat Neurosci. 2001; 4:1224–1229. [PubMed: 11713470] Zhou FM, Liang Y, Salas R, Zhang L, De Biasi M, Dani JA. Corelease of dopamine and serotonin from striatal dopamine terminals. Neuron. 2005; 46:65–74. [PubMed: 15820694] Zhuang X, Oosting RS, Jones SR, Gainetdinov RR, Miller GW, Caron MG, Hen R. Hyperactivity and impaired response habituation in hyperdopaminergic mice. Proc Natl Acad Sci U S A. 2001; 98:1982–1987. [PubMed: 11172062] Zweifel LS, Parker JG, Lobb CJ, Rainwater A, Wall VZ, Fadok JP, Darvas M, Kim MJ, Mizumori SJ, Paladini CA, Phillips PE, Palmiter RD. Disruption of NMDAR-dependent burst firing by dopamine neurons provides selective assessment of phasic dopamine-dependent behavior. Proc Natl Acad Sci U S A. 2009; 106:7281–7288. [PubMed: 19342487]
NIH-PA Author Manuscript J Neurosci. Author manuscript; available in PMC 2012 July 06.
Drenan et al.
Page 19
NIH-PA Author Manuscript NIH-PA Author Manuscript
Figure 1.
NIH-PA Author Manuscript
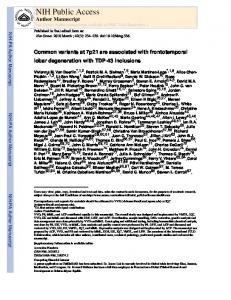
Hyperactivity in α6L9′S mice requires α4 nAChR subunits. (A) Probable receptor subtypes expressed in DA neurons of mice examined in this study. The three main nicotinic receptor subtypes expressed in DA neurons of WT mice, α6α4β2β3*, α6β2β3*, and α4β2*, are shown. α6L9′S mice express α6α4β2β3* and/or α6β2β3* nAChRs with augmented sensitivity relative to the other subtypes, and α4KO and α4KO/α6L9′S mice express only α6β2β3* and/or α6β2* nAChRs. (B and C) α6L9′S mice, but not α4KO/α6L9′S mice are hyperactive in their home cage. Horizontal locomotor activity of mice (α6L9′S and WT littermates; α4KO/α6L9′S and α4KO littermates) in their home cage environment was recorded over 48 hr. Raw locomotor activity data (number of ambulations/15 min period) are reported (B). Total locomotor activity from “lights on” and “lights off” periods indicated in (B) are shown (C) for all genotypes. (D) Nicotine-mediated locomotor activation in α4KO/α6L9′S mice is reduced relative to α6L9′S mice. After 8 min of baseline locomotor activity, mice (α6L9′S and α4KO/α6L9′S) were injected with 0.2 mg/kg i.p. nicotine. Locomotor activity was recorded for an additional 30 min after injection. Raw locomotor activity data (number of ambulations/min) are reported. (E) Dose-response relationship for nicotine-stimulated locomotor activity in WT, α6L9′S, α4KO, and α4KO/α6L9′S mice. Mice were administered nicotine at the indicated dose, and total locomotor activity was measured as in (D). Locomotor activity for each mouse was normalized to a saline control injection for the same mouse. Data are expressed as the percentage of the response to saline (set to 100%). Data are expressed as mean ± SEM. The number of mice for home cage locomotor activity experiments was: WT, n = 7; α6L9′S, n = 16; α4KO, n = 8; α4KO/ α6L9′S, n = 8. The number of mice for nicotine-stimulated locomotor activity experiments was: WT, n = 8; α6L9′S, n = 8; α4KO, n = 8; α4KO/α6L9′S, n = 8. All statistically significant comparisons are indicated. **p < 0.01
J Neurosci. Author manuscript; available in PMC 2012 July 06.
Drenan et al.
Page 20
NIH-PA Author Manuscript Figure 2.
NIH-PA Author Manuscript NIH-PA Author Manuscript
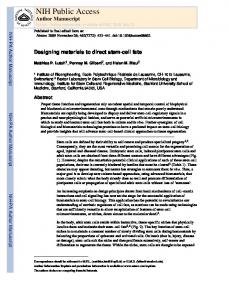
Automated mouse behavior analysis (AMBA) reveals specific behaviors affected by augmented DA release. (A) HomeCageScan system for recording and analyzing mouse behavior. Mice were singly housed in and habituated to a standard cage for video recording (top panel), and HomeCageScan software (bottom panel) analyzed mouse behavior in real time. (B) α6L9′S mice traveled greater distance than WT controls. Distance traveled over 24 hr was calculated and plotted for each WT, α6L9′S, α4KO, and α4KO/α6L9′S mouse. (C) α4 subunits are required for hypersensitive α6* nAChRs to alter mouse behavior. In each of the 4 mouse genotypes indicated, AMBA was used to calculate the percentage of total time that each mouse spent exhibiting each of 17 specific behaviors. Median values for each behavior were compared between genotypes (α6L9′S vs. WT; α4KO/α6L9′S vs. α4KO), and the fold change in median for each behavior of either α6L9′S or α4KO/α6L9′S over its respective control group (WT or α4KO) is expressed via a heat map with yellow indicating an increase in median value and blue indicating a decrease in median value. (D-E) Behavioral differences between α6L9′S and WT control mice largely require α4 nAChR subunits. For either α6L9′S vs. WT (D) or α4KO/α6L9′S vs. α4KO (E), the percentage of total time during 24 hr that mice spent exhibiting each indicated behavior is plotted. Two yaxes are used because several behaviors occupy a large fraction of total time and all behaviors could not be displayed effectively on a single y-axis. Data are expressed as mean ± SEM. The number of mice in each group was: WT, n = 8; α6L9′S, n = 21; α4KO, n = 13; α4KO/α6L9′S, n = 14. All statistically significant comparisons are indicated. *p < 0.05, **p < 0.01, ***p < 0.001
J Neurosci. Author manuscript; available in PMC 2012 July 06.
Drenan et al.
Page 21
NIH-PA Author Manuscript NIH-PA Author Manuscript
Figure 3.
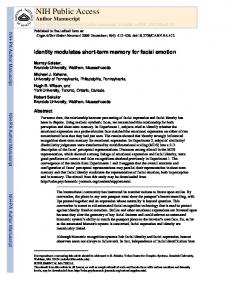
Quantitative analysis of α6β2* and α4β2* receptor levels in dorsal striatum (ST) and olfactory tubercle (OT). (A-C) αCtxMII (50 nM) inhibition of [125I]-epibatidine binding separates α6β2* and α4β2* subtypes in ST of WT, α6L9′S, α4KO, and α4KO/α6L9′S mice. Membrane preparations from dorsal striatum (ST) of the indicated mice were incubated with [125I]-epibatidine in the presence and absence of competing, unlabeled αCtxMII. Raw binding values (C) for MII-resistant (mainly α4β2*) and MII-sensitive (mainly α6β2*) receptors (A), as well as percentage of MII-sensitive receptors (B) are shown. (D-F) α6β2* and α4β2* receptor analysis for olfactory tubercle (OT) was performed identical to ST (A-C). Data are expressed as mean ± SEM. The number of mice in each group was: WT, n = 7; α6L9′S, n = 7; α4KO, n = 6; α4KO/α6L9′S, n = 5. All statistically significant comparisons are indicated. *p < 0.05, **p < 0.01, ***p < 0.001
NIH-PA Author Manuscript J Neurosci. Author manuscript; available in PMC 2012 July 06.
Drenan et al.
Page 22
NIH-PA Author Manuscript NIH-PA Author Manuscript
Figure 4.
NIH-PA Author Manuscript
Dopamine release from striatal presynaptic terminals is restored to WT levels in α4KO/ α6L9′S mice. (A-F) Hypersensitive α6* nAChR-mediated DA release in α6L9′S olfactory tubercle (OT; A-C) and dorsal striatum (ST; D-F) is reversed by α4 nAChR subunit deletion. OT or ST from WT, α6L9′S, α4KO, and α4KO/α6L9′S mice was dissected and synaptosomes were prepared. DA release was stimulated with a range of nicotine concentrations (1 nM, 3 nM, 10 nM, 30 nM, 100 nM, 300 nM, 1 μM, 10 μM, 100 μM, 300 μM), and a concentration-response relation for each mouse line is shown for total release (A and D). To determine the relative contribution of α6* and non-α6* receptors, synaptosome samples were incubated with αCtxMII (50 nM). αCtxMII-sensitive (α6* dependent) release is shown in (B) and (E), and α6*-independent release is shown in (C) and (F). (G-H) Quantification of DA release measured in (A-F) for WT, α6L9′S, α4KO, and α4KO/α6L9′S mice in ST and OT. Rmax (G) and EC50 (H) for αCtxMII-sensitive (α6β2*) and αCtxMIIresistant (α4β2*) DA release in ST and OT is shown. Data are expressed as mean ± SEM. The number of mice in each group was: WT, n = 7; α6L9′S, n = 7; α4KO, n = 9; α4KO/ α6L9′S, n = 10. All statistically significant comparisons are indicated. *p < 0.05, **p < 0.01, ***p < 0.001
J Neurosci. Author manuscript; available in PMC 2012 July 06.
Drenan et al.
Page 23
NIH-PA Author Manuscript NIH-PA Author Manuscript
Figure 5.
NIH-PA Author Manuscript
α4 subunits mediate selective potentiation of burst-evoked striatal DA release in α6L9′S mice. (A) Schematic of the slice recording experiment. A carbon fiber recording electrode (CFE) was placed in the dorsal striatum (CPu; bregma +0.4 mm), and DA release was evoked with a bipolar stimulating electrode placed 200-300 μm from the recording site. (B) Calibration and testing of CFEs for DA detection. To show that CFE DA responses in vitro are linear, peak oxidative current was measured in response to bath solutions of 2.5 μM and 5.0 μM DA. A representative voltammogram is shown for an application of a solution of 5 μM dopamine to the carbon fiber surface (inset). (C) Altered DA release responses in α6L9′S striatum are lost when α4 nAChR subunits are deleted. Coronal slices containing dorsal striatum were stimulated with a bipolar electrode and DA release was measured with fast scan cyclic voltammetry in WT, α6L9′S, and α4KO/α6L9′S adult mice. Responses to 1 pulse (1p) and to 4p (100 Hz) stimulation were normalized to DA concentrations with calibration curves (B) for each genotype. Plots for each average response are shown in (C). A representative voltammogram for evoked (1p) DA release in dorsal striatum is shown (inset). Scale bars: 300 μM DA, 500 msec. (D-G) Statistics of peak responses and kinetic parameters from data in (C). (D) Peak DA responses in α6L9′S dorsal striatum are altered compared to WT and α4KO/α6L9′Smice. The average peak DA concentration (μM) for 1p and 4p stimulation is shown for each genotype. (E) Rise time is prolonged for 4p DA responses in α6L9′S slices but is normalized by elimination of α4 nAChR subunits. In (E), a box plot of 10-90% rise time for 1p and 4p DA responses is shown for WT, α6L9′S, and α4KO/α6L9′S mice. (F) Decay of extracellular DA is delayed following 4p stimulation in dorsal striatum of α6L9′S but not α4KO/α6L9′S mice. For each genotype indicated, tau (τ) was derived and plotted for mean 1p and 4p response curves (F). (G) The relative DA signal is selectively elevated in α6L9′S striatum. 1p and 4p responses for each indicated genotype were integrated (area under the curve) and normalized to the WT 1p DA signal. For (C-G), data are expressed as mean ± SEM. The number of recording sites for each group was: WT,
J Neurosci. Author manuscript; available in PMC 2012 July 06.
Drenan et al.
Page 24
n = 11; α6L9′S, n = 14; α4KO/α6L9′S, n = 10. All statistically significant comparisons are indicated. *p < 0.05, **p < 0.01, ***p < 0.001
NIH-PA Author Manuscript NIH-PA Author Manuscript NIH-PA Author Manuscript J Neurosci. Author manuscript; available in PMC 2012 July 06.
Drenan et al.
Page 25
NIH-PA Author Manuscript
Figure 6.
NIH-PA Author Manuscript
Altered DA release probability in α6L9′S dorsal striatum. (A) Reduced initial release probability and elimination of paired-pulse depression in α6L9′S striatum. Coronal slices from WT, α6L9′S and α4KO/α6L9′S mice were alternately stimulated with 1 pulse (1p) or 2 pulses (2p). 1p waveforms are measured directly as p1 data, while the p2 waveform was isolated by subtracting average 1p waveforms from average 2p waveforms over several trials. Average p1 and p2 waveforms for the indicated genotypes are shown in (A). Scale bars: 300 μM DA, 500 msec. (B) Increased paired-pulse ratio in α6L9′S mice versus WT controls and α4KO/α6L9′S mice. For each dataset in (A), paired pulse ratio was calculated as p2/p1. Data are expressed as mean ± SEM. The number of recording sites for each group was: WT, n = 9; α6L9′S, n = 11; α4KO/α6L9′S, n = 9. All statistically significant comparisons are indicated. **p < 0.01
NIH-PA Author Manuscript J Neurosci. Author manuscript; available in PMC 2012 July 06.
Drenan et al.
Page 26
NIH-PA Author Manuscript Figure 7.
NIH-PA Author Manuscript
Normal DA transporter and DA receptor number and function in α6L9′S and α4KO/ α6L9′Smice. (A-C) Normal DA-related pharmacological parameters in α6L9′S and α4KO/ α6L9′S mice as determined by DAT and DA receptor ligand binding. Brain regions (OT and ST) from WT, α6L9′S, α4KO, and α4KO/α6L9′S mice were dissected and labeled with the indicated ligand followed by washout and quantification by scintillation counting. Raw binding values are indicated as fmol/mg protein for mazindol (DAT ligand), SCH23390 (D1 receptor ligand), and raclopride (D2 receptor ligand). (D and E) Normal DA transporter function in α6L9′S and α4KO/α6L9′S mice. Synaptosomes were prepared as in Figure 2, but [3H]-dopamine uptake was assayed at 50 nM (D) or 1 μM (E) [DA]o for all genotypes. (F) Ratio of DAT activity at 1 μM (“high”) versus 50 nM (“low”) [DA]o. Data are ratios of the values in (D) and (E). Data are expressed as mean ± SEM. The number of mice in each group was: n = 9; α6L9′S, n = 9; α4KO, n = 8; α4KO/α6L9′S, n = 8. All statistically significant comparisons are indicated. *p < 0.05
NIH-PA Author Manuscript J Neurosci. Author manuscript; available in PMC 2012 July 06.
Drenan et al.
Page 27
NIH-PA Author Manuscript NIH-PA Author Manuscript
Figure 8.
Hypersensitive α6* nAChRs mediate sustained burst-evoked DA release in α6L9′S mouse striatum. (A) Single pulse and burst firing in DA fibers of WT mice. DA release from DA terminals is governed by the pattern of firing activity in DA axons (single pulse vs. burst). Local ACh from cholinergic interneurons acts at presynaptic nAChRs, including α6*, to modulate the probability of release. (B) Single pulse and burst firing in DA fibers of α6L9′S mice. Based on the data presented here, single pulses in DA fibers collaborate with nAChR activity in the terminal to reduce the 1p DA response. The combination of 1) a burst of APs and 2) ACh-driven activation of hypersensitive α6* receptors results in augmented DA release compared to single pulse stimulation.
NIH-PA Author Manuscript J Neurosci. Author manuscript; available in PMC 2012 July 06.