Aug 23, 1988 - Nitric Oxide and Nitrous Oxide Production and Cycling during. Dissimilatory Nitrite Reduction by Pseudomonas perfectomarinaâ. (Received for ...
THEJOURNAL OF BIOLOGICAL CHEMISTRY
Vol. 264, No. 10, Issue of April 5 , pp. 5694-5699,1989 Printed in U.S.A.
Q 1989 by The American Society for Biochemistry and Molecular Biology, Inc.
Nitric Oxide and Nitrous Oxide Production and Cycling during Dissimilatory Nitrite Reductionby Pseudomonas perfectomarina” (Received for publication, August 23, 1988)
Oliver C. ZafiriouS and QuentinS.Hanley From the Department of Chemistry, Woods Hole Oceanographic Institution, Woods Hole, Massachusetts 02543
Gabriella Snyder From the Division of Applied Sciences, Haruard University, Cambridge, Massachusetts 02138
NO, + NO; + X -+ N20 ”+ N, Thedenitrifier Pseudomonasperfectomarina reduced nitrite under conditions of kinetic competition It NO between cells and gas sparging for extracellular dissolved nitric and nitrousoxides, NO., and N,O,,, in a SCHEME 2 chemically defined marine medium. Time courses of nitrite reduction andNO, and N,O, removal were in- Until very recently, the involvement of unbound NO in any tegrated to give NO, and N,O, yields. At high sparging role was primarily an indirectinference from in vitro experiments involving various NO reductase activities, as in vivo rates, the NO, yield was 250% of nitrite-N reduced, and the yield of NO, NzO, was -75%. Hence inter- experiments were rendered equivocal by the extreme perturrupted denitrification yields NO,, and NzOaqas major bations involved, such asvery high cell densities (Garber and products. Hollocher, 1981) or presenceof inhibitors or detergents (FireThe yields varied with sparging rates in agreementstone et al., 1979; Betlach and Tiedje, 1981). However, Gorwith a quantitative model of denitrification (Betlach, etski and Hollocher (1988) have now demonstrated that unM. P., and Tiedje, J. M. (1981)Appl. Enuiron. Micro- bound NO clearly plays some important role(s) in denitrifi1074-1084) that applies simplified Michaelis- cation by several species of denitrifiers. Using extracellular biol. 42, Menten kinetics toNO; 4 NO., + NzOaq+ N,. The fit hemoglobin (Hb) asa trap underirreversible conditions, these gave an estimate of the maximum scavengeable NO, authors typically trapped 60-70% of the nitrite-N reduced by yield of 73 2 8% of nitrite-N. Thus a minor path intact cells as HbNO at high [Hb]. independent of NO,, is also required. The fit of the Here we report experiments confirming the importance of model to data atlower sparging rates, where normal extracellular NO and N20 for the marine species Pseudomodenitrification products predominate, implies that the nas perfectomarina, implying that marine denitrifiersmay be extracellular NO,, pool yield is independent of gas animportant source and/orsink of the NO observed in sparging rate. Thus inP.perfectomarina NO., and N,O,, are inter- suboxic marine environments (Goering, 1985; Ward and Zamediates, or facilely equilibrate with true intermedi- firiou, 1988).’ Furthermore, our methodof detecting NO and ates, during complete denitrification. The recoveryof N,O evolution in the presence of a kinetically defined alternative sink, permitting measurements underpartially reversmost nitrite-N as NO and/or N20 under perturbed ible conditions, gives a more completeview of the full sequence conditions is not an artifact of irreversible product removal, butan attributeof denitrification in thisspe- of events envisioned in Schemes 1 and 2. We estimate theavailability of NO,, and N20., outside the cies, and most probably it is characteristic of denitricell by bubbling denitrifying cell suspensions with a gas fication in other speciesas well. stream and measuring the volatilized products NO, and N20, intheeffluent gas stream.Weassumethatthe bubbling process has no directeffect on thecellular emission or uptake Payne (1973) proposed a scheme in which the reduction of of these gases. Using this approach,we 1) measure the yields nitrite to nitricoxide defined denitrification: of NO,, and N20,, as functions of physical removal rate, 2) model the competition between physical removal and reupNO, + NO; 4NO -+ Nz0 -+ N, take in order to derive limiting yields at infinite physical SCHEME 1 removal rate, and 3) evaluate the results in terms of Schemes Modified or alternative schemes have been advanced for the 1and 2. roles of NO and NzO in dissimilatory nitrate/nitritereduction MATERIALS AND M E T H O D S ~ (Zumft and Vega, 1979; Garber and Hollocher, 1981; Payne, 1981a, 1981b; Knowles, 1982) with the most relevant alterRESULTS native indicating a branch point at an intermediate X (FireExperimental Design and Kinetic Scheme-Experiments stone et al., 1979; Averill and Tiedje, 1982): utilized anaerobic batch cultures of P. perfectomarina in a * This work was funded by National Science Foundation Grants
+
~~
~
~
OCE-83-00022 and OCE-86-01618. This is Woods Hole Oceanographic Institution Contribution 6509. The costs of publication of this article were defrayed in part by the payment of page charges. This article must therefore be hereby marked “advertisement” in accordance with 18 U.S.C. Section 1734 solely to indicate this fact. $ To whom correspondence should be addressed.
0. C. Zafiriou, submitted for publication to Nature. Portions of this paper (including “Materials and Methods,” Table 3, Fig. 5, and equations and supporting data) are presented in miniprint at theend of this paper. Miniprint is easily read with the aid of a standard magnifying glass. Full size photocopies are included in the microfilm edition of the Journal that is available from Waverly Press.
5694
Nitrogen Oxides from Pseudomonas perfectomarina
5695
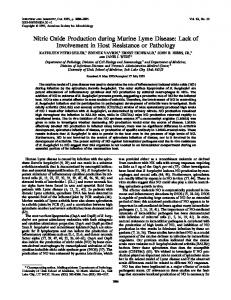
relevant nitrite levels (0-20 p M ) growth was slow. Slow growth does not imply senescence or damage by bubbling, as cells were capable of rapid aerobic growth at the end of gas evolution, bubbled and unbubbled cultures reduced nitrite at similar rates, and replenishment of nitrite immediately after its exhaustion initiated a second, similar time course. Bubbling did not cause detectable cell aggregation or decrease cell counts. Additional experiments (Miniprint Supplement) showed that qualitatively similar results are found when inoculation, medium composition, andotherparameters are varied. The results of 14 experiments at various flows (Table 1) qualitatively establish several major points. In unbubbled cultures NO., did not build up; 90% of the time courses and the K , for bers increased only slightly, primarily after nitrite was de- NO,, was well abovethe estimated values of [NO,,]. K,,, (N,O) pleted. At higher nitrate concentrations, or during aerobic was not measured; however, Betlach and Tiedje (1981) rerespiration, cell numbers increased rapidly, but atoceanically ported a value of 540 nM, more than twice the highest estimated [N20,] and 10-fold above its average concentration in our experiments. To evaluate the likely degree of distortion in the r and k terms of Scheme 3 if our kinetic approximations are significantly in error, we also calculated results assuming drastically different NO,, uptake kinetics. The best-fit parameters found using the approximations (justified above) of zero-order nitrite reduction and first-order uptake of NO., and NzOsqare given in Table 2 (topline). The second line presents the results calculated assuming uptake second-order in [NO,,] (Miniprint Supplement).The resulting values for rz/zr, 73 & 8% for first-order NO., uptake versus 63 f 5% for secondorder NO., uptake, indicate that the NO yields are very insensitive to uptake order. Assuming zero-order NO uptake Time (hr) kinetics (as would result from saturated Michaelis-Menten FIG. 1. Typical time course of [NO;] (A-A), cell density (A-A), NO (o"--o), and N,O (U in ) the effluent gas uptake) predicts an NO yield independent of flow rate and is stream, 0.26 liter (standard temperature and pressure)/min clearly inappropriate (Fig. 4). The flow rate-gas yield behavior predicted from the bestNz. chemically defined marine medium under nitrogen with succinateas carbon source, excess ammonia available for N assimilation, and nitrite at oceanically relevant concentrations as limiting electron acceptor. A computer-controlled experimental and data acquisition system continuously sparged the media with oxygen-free N, at known, reproducible rates and quantified NO and N,O in the effluent gases over the time course of nitrite respiration. Sterilemedia were used as controls. The system frequently recalibrated the detectors to optimize accuracy. Rate laws and constants for transfer (sparging) of dissolved NO and N,O from sterile media into the gas phase were determined in separate experiments. The yields of gases removed were determined by integrating over the time courses of their evolution. The total yields over the course of nitrite exhaustion are the quantities reported. The data from a series of experiments at various gas flow rates were fitted to a kinetic approximation (Miniprint Supplement) derived from Scheme 3:
1
1
1
5696
Pseudomonas from perfectomarina Oxides Nitrogen TABLE 1 Nitrite dissimilation experiments NO and N 2 0 concentrations Flow rate”
literslmin
Initial [NO;]
d[NO;)
Cells’
/dtb
ml
nMjs
PM
55.20.15 2.24 12.8 1.39 98 12.6 0.15 0.18 8.2 0.25 1.12 12.3 36.1 0 7.7 0.25 1.4 8.2 0.35 0.50 9 34.5 43.4 1.8 8.2 .37 10.9 0.87 0.50 76.4 27.2 7.6 0.50 85 11.4 0.50 73 32 11.7 25.8 0.56 0.60 0.82 8 12.2 1.00 7.4 1.50 0.48 1.50 8.7
Recoveriesd
0.88 38.8 48.8 0.45 37.7 136 0.45 0.32 0.45 49.2
Gaseous‘
recovery
NO
N20 recovery
Total recovery
10-3
%
%
%
0.527.6 1.225.2 1.1 2.4 58.7
11.2 23.5
(X
-f
2.27 -f
39.8 2.91
73.8
42.0
37 -f
-I
[NOImx
Solution‘
IN2OImex
[NOA.
ppm
nM
1.96 26.6 1.63 31.5 20.4 -f
[N20.&
2.34 1.47
61.5
1.32 0.79
180 200 77 73 16
2.9 30
65.5
21.9 1.226.1
39.3 0.55
32.0 1.00
39.4 -f
63.3
71.3
0.9
-I
-I -I
17.6 0.30 0.48
0.31 4.0 -I -f
13 7.9 8.5
4.3
Dry gas at standardtemperature and pressure. Zero-order rate over central >80% of progress curve. Initial values; increase