horticulturae Review
Nitrogen Related Diffuse Pollution from Horticulture Production—Mitigation Practices and Assessment Strategies Maria do Rosário Cameira 1,2, * and Mariana Mota 1,2 1 2
*
Department of Biosystems Engineering, Instituto Superior de Agronomia, University of Lisbon, Tapada da Ajuda, 1349-017 Lisboa, Portugal;
[email protected] Linking Landscape, Environment, Agriculture and Food (LEAF), Instituto Superior de Agronomia, University of Lisbon, Tapada da Ajuda, 1349-017 Lisboa, Portugal Correspondence:
[email protected]; Tel.: +351-21-3653478
Academic Editor: Douglas D. Archbold Received: 24 October 2016; Accepted: 22 February 2017; Published: 28 February 2017
Abstract: Agriculture is considered one of the main nitrogen (N) pollution sources through the diffuse emissions of ammonia (NH3 ) and nitrous oxide (N2 O) to the atmosphere and nitrate (NO3 − ) to water bodies. The risk is particularly high in horticultural production systems (HPS), where the use of water and fertilizers is intensive and concentrated in space and time, and more specifically, in the case of vegetable crops that have high growth rates, demanding an abundant supply of water and nitrogen forms. Therefore, to comply with the EU environmental policies aimed at reducing diffuse pollution in agriculture, there is the need for mitigation practices or strategies acting at different levels such as the source, the timing and the transport of N. HPS are often well suited for improvement practices, but efficient and specific tools capable of describing and quantifying N losses for these particular production systems are required. The most common mitigation strategies found in the literature relate to crop, irrigation and fertilization management. Nevertheless, only the success of a mitigation strategy under specific conditions will allow its implementation to be increasingly targeted and more cost effective. Assessment methods are therefore required to evaluate and to quantify the impact of mitigation strategies in HPS and to select the most promising ones. Keywords: horticulture; diffuse pollution; N emissions; N leaching; mitigation strategies; fertigation management; crop management
1. Introduction Diffuse or non-point source pollution refers to both water and air pollution caused by a variety of activities that have no specific point of discharge. Furthermore, the long-range transport ability and multiple sources of the pollutant contribute to the diffuse nature of the process. The management of diffuse pollution is complex and requires the careful analysis and understanding of various processes [1]. Agriculture is seen as one of the main N pollution sources through the diffuse emission of ammonia (NH3 ) and nitrous oxide (N2 O) to air and nitrate (NO3 − ) to surface and ground waters [2]. NO3 − leaching to ground waters represents a loss of soil fertility and also a threat to the wider environment and human health [3,4]. NO3 − that enters drinking water supplies creates a risk of methemoglobinemia in infants/young children and has been linked to cancer and heart disease [5]. Half of the European population live in areas where concentrations in drinking water exceed 5.6 mg N-NO3 ·L−1 , and about 20% live in areas where concentrations exceed the recommended level of 11.3 mg N-NO3 ·L−1 [6]. NO3 − and ammonium (NH4 + ) transported with subsurface flow or surface runoff entering rivers or lakes contributes, together with phosphorous, to eutrophication, resulting in algae blooms and suffocation of aquatic life [7]. Horticulturae 2017, 3, 25; doi:10.3390/horticulturae3010025
www.mdpi.com/journal/horticulturae
Horticulturae 2017, 3, 25
2 of 23
Horticulturae 2017, 3, 10.3390/horticulturae3010025
2 of 22
Atmospheric emissions of some nitrogen oxides, e.g., N2 O (a greenhouse gas) and NOx, and NH3 runoff entering rivers or lakes contributes, together with phosphorous, to eutrophication, resulting are contributing, directly and indirectly, to negative effects on human health [8]. N2 O in the atmosphere in algae blooms and suffocation of aquatic life [7]. emissions some layer nitrogen oxides, e.g., aNsignificant 2O (a greenhouse gas) and NOx, and contributes to Atmospheric the depletion of theof ozone and makes contribution to climate change. NH3 are contributing, directly and indirectly, to negative effects on human health [8]. N2O in the The NH3 emissions contribute to acid rain causing acidification and eutrophication of the ecosystems. atmosphere contributes to the depletion of the ozone layer and makes a significant contribution to The latter climate change. The NH also represent an indirect source of N2 O greenhouse gas [9]. 3 emissions contribute to acid rain causing acidification and eutrophication of the ecosystems. The latter also represent an indirect source of N 2O greenhouse gas [9]. In response to the main environmental and health threats posed by agriculture, several countries In response to the main environmental and measures health threats by agriculture, several around the world have implemented various policy andposed regulation tools developed under countries around the world have implemented various policy measures and regulation tools international conventions. Figure 1 shows the example of how, for the European Union (EU), developed under international conventions. Figure 1 shows the example of how, for the European agricultureUnion (EU), agriculture can comply with these regulations [10]. Thus, the application of fertilizers, can comply with these regulations [10]. Thus, the application of fertilizers, manures and manures and other organic materials has to comply with policy measures dealing with the emissions other organic materials has to comply with policy measures dealing with the emissions to air, to air, ground water and surface water. This is a difficult task since measures to reduce losses to one ground water and surface water. This is a difficult task since measures to reduce losses to one compartment will often have an impact on the emissions to other compartments as a result of the compartment will often have an impact on the emissions to other compartments as a result of the nitrogen nitrogen cycle (pollution swapping) [11]. cycle (pollution swapping) [11].
Figure 1. Overview of the EU policy instruments affecting the use and losses of nitrogen in Figure 1. Overview of the EU policy instruments affecting the use and losses of nitrogen in agriculture agriculture (CLRTAP, Convention on Long Range Transport of Atmospheric Pollutants; IPPC, (CLRTAP, directive Convention on Long Rangeprevention Transport ofcontrol; Atmospheric Pollutants; IPPC, directive on on integrated pollution, and CAP, common agricultural policy) integrated(adapted from [10]). pollution, prevention and control; CAP, common agricultural policy) (adapted from [10]).
Although some improvements have led to the reduction of N inputs, diffuse pollution of
Although some improvements have led to the reduction of N inputs, diffuse pollution of agricultural origin remains a major threat for waters. The technologies and measures to reduce these emissions exist, but the diversity of the cropping systems and the complex diffuse N pathways have agricultural origin remains a major threat for waters. The technologies and measures to reduce these in regulatory obligations are not equally efficient for complex different types of production emissions resulted exist, but the diversity of thethat cropping systems and the diffuse N pathways have systems. Some authors state that the risk is higher in horticultural production systems (HPS) than in resulted inarable lands [12]. Vegetable production, in particular, requires an intensive use of resources, namely regulatory obligations that are not equally efficient for different types of production systems. Some authors state that the risk is higher in horticultural production systems (HPS) than in arable water and fertilizers, in concentrated space and time. Reported N application rates show values as −1 [13–15]. Vegetable crops in general present shallower root systems compared lands [12].high as 600–900 kg∙ha Vegetable production, in particular, requires an intensive use of resources, namely water to arable plants. Furthermore, the nitrogen use efficiency (NUE) of many vegetables is often less than and fertilizers, in concentrated space and time. Reported N application rates show values as high 50% and −can be as low as 20%, [14,16]. Contrary to arable crops, vegetables are harvested in a as 600–900vegetative stage when daily N uptake rates are still high, leaving soils with considerable mineral N kg·ha 1 [13–15]. Vegetable crops in general present shallower root systems compared to arable plants. Furthermore, the also nitrogen efficiency (NUE) of to many vegetables is often oftenlarge less than 50% amounts. Their residues take a use particular position relative arable crops due to −1) and low C:N ratios, left behind on the and can beamounts of biomass, with a high N content (up to 200 kg∙ha as low as 20%, [14,16]. Contrary to arable crops, vegetables are harvested in a vegetative field [16,17]. These adverse characteristics be exacerbated by the incorrect management stage when daily N uptake rates are still high,can leaving soils with considerable mineral of N amounts. irrigation and/or by the precipitation occurring during the post‐harvest season, both situations Their residues also take a particular position relative to arable crops due to often large amounts of biomass, with a high N content (up to 200 kg·ha−1 ) and low C:N ratios, left behind on the field [16,17]. These adverse characteristics can be exacerbated by the incorrect management of irrigation and/or by the precipitation occurring during the post-harvest season, both situations maintaining excessively high moisture conditions in the soil surface and drainage fluxes out of the root zone. Considering fruit crops, which constitute another important part of HPS, the use of resources is not so intensive, but it follows a similar tendency. In particular, intensive and hedgerow orchards are characterized by high plant densities, contributing to a weaker and more superficial root development. This is reinforced by the application of water and nutrients exclusively to the root zone [18,19].
Horticulturae 2017, 3, 25
3 of 23
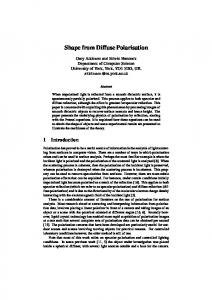
Moreover, the need to correct the soil reaction and/or to supply micronutrients may require the application of N forms that will increase pollution. Horticultural production is important worldwide. For example, in the EU, it was, for the year of 2014, 30 million tons for fruits and 63 million tons for vegetables, the latter having increased 4% in relation to 2013 [20]. Water and N availability remain globally the most limiting plant growth factors, and water application is a management option in irrigated systems that strongly interacts with the efficient use of N [21]. Therefore, irrigated horticulture requires specific practices to increase water and nutrient use efficiency, which is considered to be a major challenge for the food production during this century [22]. Nitrogen losses to water bodies and the atmosphere and the correspondent mitigation strategies are thus significant concerns in HPS. Recent studies highlighted that there is the danger of pollution swapping between nitrate (NO3 − ) leaching and N2 O and NH3 gaseous losses, which requires a holistic approach to the diffuse pollution issue, including the N and water dynamics and management in the soil-plant-atmosphere systems [5,23]. The objective of this review paper is to identify the main strategies available to mitigate the various N losses from HPS with emphasis on vegetable production and to present methods to assess their application success. The first part of the work outlines the threats to the environment and health associated with N losses from HPS. In the second part the EU policy tools concerning N diffuse pollution are presented, followed by the major pathways for N losses and its underlying processes. A description of the available strategies to mitigate these losses is then presented; followed by the revision of three methods to evaluate the success of the different types of measures. 2. Nitrogen Loss Pathways and Processes The N present in the soil is subject to several transformations that influence its availability to plants and influence the potential for losses though the various pathways. Horticulture soils generally contain large pools of N, most of which are in organic forms. Around 1%–3% of the N bound in organic forms may become mineralized and available to crop uptake or be potentially lost within the growth period [24]. In this process, bacteria digest organic material and release NH4 + , which is positively charged and therefore can be bound to negatively-charged soil particles and organic matter (OM). Thus, NH4 + does not move downward in soils and can be volatilized at the soil surface. It can also be absorbed by the plants or subject to nitrification, which is the conversion to NO3 − . This N form is negatively charged and water soluble, and depending on the conditions, it can move below the crop rooting zone (leached), be absorbed by crops or denitrified. A temporary reduction in the available N can occur (immobilization) when the bacteria that decompose high C:N residues use the soil N to grow and build bacterial biomass. However, there is often a net gain of N during the growing season. Tracing the N path through the environmental reservoirs is thus a challenge due to the complex N cycle [25]. In HPS, all of the tree N loss pathways occur: leaching, volatilization and denitrification [9] (Figure4 of 22 2). Horticulturae 2017, 3, 10.3390/horticulturae3010025
Figure 2. Figure Simplified diagram of the nitrogen ina ahorticultural horticultural system, showing 2. Simplified diagram of the nitrogen cycle cycle in system, showing the main the main transformations and pathways for loss. transformations and pathways for loss. 2.1. Nitrate Leaching Leaching refers to the loss of NO3− from the soil root zone into ground and surface waters and results from the combination of three physical processes: convection, diffusion and hydrodynamic dispersion [26]. The convective transport of nitrate in the root zone occurs due to the mass flow of
Horticulturae 2017, 3, 25
4 of 23
2.1. Nitrate Leaching Leaching refers to the loss of NO3 − from the soil root zone into ground and surface waters and results from the combination of three physical processes: convection, diffusion and hydrodynamic dispersion [26]. The convective transport of nitrate in the root zone occurs due to the mass flow of water through the soil during drainage after precipitation and/or irrigation events. Diffusive transport occurs due to the concentration gradient between the soil solution with nitrate that is moving by convection and the surrounding soil with a lower concentration. During irrigation and precipitation events, the convective transport will predominate while diffusion gains importance between events, when the soil water fluxes are low. However, the large variations in soil pore sizes cause a range of pore water velocities. As a result, some portions of the flowing solution move ahead while other portions lag behind, causing the incoming solution to mix or disperse with the antecedent solution. This process is called hydrodynamic dispersion and can predominate over diffusion when the convective velocity is sufficiently high. Factors affecting nitrate leaching have been reviewed, although more extensively for arable crops than for horticultural crops (e.g., [9,12]). The amount of NO3 − leached from the root zone is determined by its concentration in the soil solution and the drainage flux through the soil. While the amount of NO3 − present in the soil solution is a result of the N budget, the drainage flux depends on the soil hydraulic properties, temperature and water inputs. Horticultural crops, vegetables in particular, are mainly produced in sandy to loamy soils, which are less retentive for water and highly to moderately conductive. Soil water contents are usually high since vegetables are irrigated, increasing the leaching risk during the crop season. When irrigation is correctly managed, leaching will be minimized, but N will accumulate in the soil profile, increasing the post-harvest leaching potential. Leaching losses for a variety of vegetable crops, climates, soils and management practices are presented by several authors [12,21,27–35]. A leaching loss of 207 kg NO3 -N ha−1 was reported from a cabbage crop on a sandy soil harvested in September; a broccoli crop in a loamy soil harvested in November leached 282 kg·NO3 -N ha−1 , while in a sandy soil planted with cauliflower harvested in November, leaching reached a value of 293 kg·NO3 -N ha−1 . Nitrate losses from other horticultural systems, e.g., orchards have been less studied. Data collected in an apple orchard show concentrations up to 66 mg NO3 -N·L−1 in the leachate [36]. After the analysis of current fertigation practices in an intensive olive grove, it was found that nitrate leaching accounted for 75% of the fertilization inputs [37]. Other researchers found that 53%–78% of the applied nitrogen was leached in a commercial apple orchard [38]. Results suggest that if an irrigated orchard is located in a light textured and free draining soil and there is a high N input, the potential for leaching can be high, thus requiring the application of mitigation strategies [39,40]. 2.2. Ammonia Volatilization Ammonia volatilization is the transformation of NH4 + into NH3 in the soil and its transport from the soil surface to the atmosphere [9]. Agriculture accounts for 50% of the NH3 that is volatilized worldwide [41], which is undesirable since it represents a loss of N from the soil-plant system and a threat to the environment. The relative concentrations of NH4 + and NH3 in the soil depend on the pH of the soil solution, being favored by high values. Other factors affecting NH3 production are temperature, soil texture, soil cation exchange capacity and soil moisture [9]. The rate of exchange of NH3 between soil surface or plant material and the atmosphere depends on micrometeorological circumstances (especially wind speed and temperature) and ambient NH3 concentration [42]. This process is the most important N loss pathway from agricultural soils receiving NH4 + -based synthetic fertilizers and some type of manures. NH3 volatilization can also be produced by mineralization of soil OM and crop residues, especially from vegetable crops [43], which have high N levels and low C:N ratios. About 5%–16% of the N content of vegetable crop residues can be lost as NH3 [44]. Volatilization losses from poultry manure and dairy slurry were found to be 9%–20% and 14%–35% of total N applied, respectively [44,45]. The potential risk of ammonia volatilization from
Horticulturae 2017, 3, 25
5 of 23
urea fertilizer can represent up to 65% of the N applied, depending on soil and climatic conditions [46]. This aspect is very important in orchards, as urea application is common at the post-harvest stage, to enable a fast-nutrient uptake that confers adequate nutrient storage and a good plant performance for the following spring. 2.3. Nitrification and Denitrification Agriculture accounts for 70% of the N2 O emissions to the atmosphere in Europe [47]. Some of the highest fluxes to date have been measured in irrigated and fertilized systems [48,49]. N2 O emissions from cultivated soils result from the biological nitrification and denitrification processes [50]. Thus, the understanding of the soil and environmental factors regulating the microbial populations is necessary to choose appropriate N2 O mitigation strategies. The major soil parameters that regulate the nitrification-denitrification processes are temperature, percentage of soil pores filled with water, oxygen level and pH. Nitrification is an aerobic process resulting from two distinct steps: the oxidation of NH3 or NH4 + to NO2 − by ammonia-oxidizing bacteria, such as Nitrosospira and Nitrosomonas, and the oxidation of NO2 − to NO3 − by the nitrite-oxidizing bacteria (e.g., Nitrobacter) [51]. During the first step, a portion of the NH4 + may be converted to N2 O during the decomposition of nitrite [52,53]. The optimum soil temperatures for the nitrifying microbial populations range from 25 ◦ C–30 ◦ C [54]. However, lower nitrification rates have been found at temperatures below 5 ◦ C [53]. As to the optimum soil pH, it varies between 4.5 and 7.5 [54]. Nitrifying bacteria are sensitive to changes in soil water content. The maximum nitrification rate occurs when the soil moisture is near field capacity (−10 kPa) [54]. As the soil gets wetter, the nitrification rate decreases, and it is estimated that the process becomes restricted when the water-filled pore space is greater than 60%. However, as water drains and oxygen re-enters the soil, nitrification quickly resumes as the bacteria population recovers. The nitrification rate is also significantly slower when the soil is dry, although it still can occur near the wilting point (−1500 kPa) [55]. In dry environments, a surge in microbial activity (including nitrification) is commonly seen when a soil is rewetted by irrigation or rainfall following a prolonged dry period. The whole process of nitrification is dependent on the ammonia available in the soil; however, high concentrations of ammonium/ammonia can restrict the activity of Nitrobacter [55]. Thus, the process is dependent on management practices, particularly from the type of fertilizer applied. The other main driver for N2 O production is denitrification. It consists of a microbially-mediated process of the reduction of NO3 − and/or nitrite (NO2 − ), which may ultimately produce N2 [56]. In addition to the terminal product, NO and N2 O are generated as obligatory free intermediates [57]. The rate of denitrification and the relative proportions of NO, N2 O and N2 produced depend on the outcomes of complex interactions between soil properties, soil micro-organisms, climatic factors and management practices. Increased soil N supply, decreased soil pH, C availability and water content generally increase the N2 O:N2 ratio, thus increasing N2 O emissions. Mitigation approaches should focus on ways to enhance the reduction of N2 O to N2 , thus lowering the N2 O:N2 product ratio. As denitrification is favored by high NO3 − and C availability, it is likely to occur in wet horticulture soils, in particular immediately after rainfall or an irrigation event when soil pores may become filled with water and the oxygen supply may be temporarily restricted [58]. Extensive descriptions of the denitrification processes and the regulation of the N2 O:N2 ratio can be found in previous literature [56]. Available data provide evidence of the need for strategies to reduce soil N2 O emissions in HPS. Losses are expected to be derived primarily from denitrification during peak soil moisture periods, when more than 60% of the pore space is filled with water [59]. At lower soil moistures, nitrification will be the major source of N2 O. Losses are important especially for cole crop production and must account for the post-harvest period. Field emissions of N2 O following a cauliflower crop harvested in September on a silty clay loam varied from 1.1%–3.7% of the N content of the residues [60]. High N2 O
Horticulturae 2017, 3, 25
6 of 23
emissions have also been reported during winter after incorporation into soil of Brussels sprout and broccoli residues (up to 14% of total N), due to the high moisture content of the residues [61]. Cereal crop residues have significantly lower emissions [62]. Thus, the need for mitigation measures for leaching and gaseous losses in HPS, in particular in vegetable production, is largely justified. 3. Strategies to Mitigate Nitrogen Diffuse Pollution from Horticultural Production N loss mitigation strategies or methods have three different targets: (a) the nutrient availability, aiming to redress the balance between nutrient supply and demand (source methods); (b) the timing for agricultural practices, aiming to synchronize N availability and plant uptake (timing methods); and (c) the nutrient delivery to the receiving environmental compartment, aiming to reduce nutrient mobility and modifying the transport pathways (transport methods) [63]. Whatever strategy is chosen, it must be well designed and adapted to local farming conditions, soils and climate. Some reports suggest that strategies that reduce N losses after harvesting the vegetable crop may be more significant than in season strategies. In fact, over 400 kg·N·ha−1 may remain in the field as soil mineral N due to uncomplete uptake by crop and/or to a low harvesting index and as readily mineralizable organic forms in vegetable crop residues [17]. However, in permanent horticultural crops, as fruit trees or vines, a significant part of the biomass remains in the permanent structure of the plant, and only a minor part is removed through the leaves (in the deciduous species) and the pruning wood [64]. The most common N loss mitigation strategies applicable to HPS are approached next. 3.1. Crop Management Mitigation strategies based on crop management include residue management after harvest, the use of cover crops, crop rotations and intercropping and the growing of N use-efficient plants. 3.1.1. Management of Crop Residues Vegetable crop residues often consist of a large amount of biomass with high N contents and C:N ratios ranging between 10 and 20, thus mineralizing rapidly even at low soil temperatures [4,65–68]. This means that when assessing the risk of post-harvest losses, the N content in the crop residues must be considered in addition to the potential for soil OM mineralization. Up to 198 kg·N·ha−1 may result from leaving broccoli crop residues in the field after harvest, representing a significant risk [69]. This situation may occur mainly for brassica crops, which are the ones with higher N contents (Table 1). Thus, it is very important to manage these residues to conserve N for the next crop [16]. Table 1. N content of vegetable crop residues (adapted from [16]). Crop
N Content (kg·ha−1 )
Reference
Cabbage
170–200
[70]
Cauliflower
150 98–128 193
[70] [71] [72]
Brussels sprouts Broccoli Leek Celery
140–240 76–304 54 25–60
[73] [74] [73] [75]
The in situ management options are:
• •
Incorporation of the vegetable crop residues into the soil reduces NH3 emissions [43]. However, this practice may increase the leaching losses (pollution swapping) (source); Leaving the crop residues intact on the soil surface following harvest in autumn will slow down mineralization [76]; incorporation can be delayed to a period where the risks of N leaching losses
Horticulturae 2017, 3, 25
•
•
•
7 of 23
are lower [77]. However, this practice may lead to an increase in gaseous emissions and also to severe phytosanitary problems, as the inocula remains in the fields from one season to the other [78] (source); Co-incorporation of crop residues with other residues presenting a higher C:N ratio may decrease mineral N availability through the immobilization process or even by reducing the mineralization rate of the residues; this practice was successfully tested using different types of materials as wheat straw and green waste compost (e.g., [29,67]); also, this material will be free of fungal inocula from the previous season, as spores usually lose their viability during the composting procedure [79] (source, timing and transport); When the harvest method leaves the root systems intact (e.g., cauliflower and broccoli), they grow and act as a catch crop during winter. This practice reduced the soil nitrate contents during winter by 39% as compared with the no catch crop situation [80] (transport); Removal of the crop residues from the field, which can be applied later, will reduce the potential for all kinds of losses [71]. The application time requires the synchronization of crop nutrient demand and nutrient availability from the previous crop residues. A leaching reduction of 8% when 20% of cauliflower residues were removed was reported [16] (source, timing and transport).
3.1.2. Use of Cover Crops N losses during autumn/winter, where the conditions are less favorable to physiological activity production, can be significantly reduced by the presence of cover crops in comparison with bare ground acting as a mitigation practice at the source [80]. Cover crops must have a fast developing and deep rooting system, as well as winter hardiness [16,81]. This allows them to rapidly scavenge N from the entire soil profile. Several studies show the success of planting cover crops like oats, hairy vetch, rye, barley and ground wheat after the harvest of vegetables like endive, peas, potatoes and cabbage, in the mitigation of N gaseous and/or leaching losses (e.g., [72,82–84]). However, for some brassica crops like cauliflower or broccoli, harvested as late as November, there is no evidence of the benefits of a cover crop in reducing N losses after production [65,72]. In these cases, the cover crop must be established before the harvest of the vegetable crop (intercropping), and an adequate strategy must be implemented to avoid competition for water and nutrients. Beside leaching and gas losses, cover crops can also mitigate nutrient losses by surface runoff and soil erosion, since water infiltration is increased and the soil surface is protected against erosive forces [85,86]. In orchards, cover crops are often used to protect the soil, enable the use of machinery with reduced soil compaction and avoid nutrient loss. However, they can constitute a reservoir of inocula, and therefore, this practice must be reviewed [87]. In a meta-analysis relative to N loss mitigation strategies, the use of cover crops ranked second best, after irrigation management [88]. 3.1.3. Crop Rotations Rotations are a technique of great importance both for the improvement of soil fertility and the mitigation of N losses at the source, timing and transport. Crop rotations, especially performed with N-fixating rotation crops, reduce the input of fertilizers and the pollution by nitrogen [89]. Legumes such as faba beans can fix large amounts of N (100–200 kg·N·ha−1 ) and can thus reduce the need for N fertilizer on succeeding crops [90]. Biologically-fixed N is used most efficiently in rotations where legumes are followed by crops with high N requirements (e.g., leaves or fruits). Root depths were negatively correlated with NO3 − leaching, and thus, rotations including crops with different root depths were good choices to improve N use efficiency and at the same time reduce nitrate leaching [91]. Deep-rooted crops (e.g., pumpkin, tomato) alternating with shallower-rooted ones (e.g., lettuce, broccoli) explore the entire profile and bring up nutrients from deeper layers that might otherwise be lost from the system [92]. Differences in plant rooting patterns including root
Horticulturae 2017, 3, 25
8 of 23
density and root branching at different soil depths also result in more efficient extraction of nutrients from all soil layers when a series of different crops is grown. 3.1.4. Use of N Use-Efficient Plants The use of plants associated with mycorrhizae can reduce N losses through leaching by acting at the source and transport. Mycorrhizae contribute to the formation of stable aggregates in the soil, developing a macroporous structure that favors infiltration and water retention, penetration of roots and air and prevents erosion. Furthermore, mycorrhizae promote the capacity of plants to acquire N from inorganic sources, with different studies showing that mycorrhizal plants have an increased plant N content, reducing the soil nitrate content [93]. Furthermore, an adequate choice of the rootstock is important, since fast-growing rootstocks have usually a better NUE and are less prone to N losses through leaching, when compared to slow-growing ones [39,94]. 3.2. Irrigation and Fertilization Management Vegetable crops are irrigated frequently due to their shallow rooting system and high sensitivity to moisture stress. The amount of irrigation water applied is frequently far greater than the actual crop needs. This has significant impact on soil NO3 − level, and it is clear that controlling the amount of drainage from irrigation is critical to the protection of groundwater. Since convection is the main process of nitrate transport in the root zone, the control of the NO3 − available for leaching must be complemented with the control of the hydraulic fluxes due to irrigation. Thus, an integrated management of both irrigation and fertilization practices should be considered. 3.2.1. Irrigation Water Management In irrigated horticulture, excessive water applications increase N leaching, leading to a low crop N availability, which is compensated by increasing fertilization rates. As a consequence, when crops are over irrigated, it is common to observe low NUE with a negative impact on groundwater quality [21]. A meta-analysis of several strategies to control nitrate leaching led to the conclusion that the group of strategies based on improving water irrigation management had the largest effect [88]. Irrigation water management has a significant impact on N losses not only because it controls the nutrient delivery to the water bodies (transport type method), but also as a mitigation method at the source, since moisture content controls most of the biochemical reactions leading to N transformations [95]. Irrigation water management can be improved at different levels, as described next.
•
Adjustment of water application to crop needs: irrigation requirements
The adjustment of water application to crop needs without decreasing yields and nutrient uptake efficiency is the irrigation management practice most effective in decreasing N losses [88]. Crop needs refer to the actual water requirements for evapotranspiration (ETc), which primarily depend on crop development and climatic factors. A suitable method for estimating ETc for vegetable crop production is the FAO method based on reference evapotranspiration (ETo) and the crop coefficients (Kc) [96]. Irrigation requirements are primarily determined by crop water requirements, but also depend on the characteristics of the irrigation system, management practices and the soil characteristics. Irrigation systems are generally rated with respect to application efficiency, which is the fraction of the water that has been applied by the irrigation system and that is available to the plant for use [97]. Applied water that is not available to the plant may have been lost from the root zone through evaporation or wind drifts of spray droplets, leaks in the pipe system, surface and subsurface runoff or deep percolation within the irrigated area.
Horticulturae 2017, 3, 25
•
9 of 23
Irrigation scheduling
While the determination of the irrigation requirements only provides general guidelines due to the variable nature of vegetable production, irrigation scheduling provides the means to determine when and how much to irrigate according to the in situ conditions of the plants in a given field. Irrigation scheduling is generally based on experience, being generally accepted that vegetable growers over irrigate to ensure that water is not limiting the production, originating drainage fluxes that carry nitrates beyond the depth of crop roots. The use of soil moisture sensors or soil matric potential sensors is the most appropriate technique to schedule the irrigation of vegetable crops [98]. These sensors can be used as a standalone, complementing the FAO method or even complementing the grower experience. Tensiometers are an example of soil matric potential sensors whose readings are compared with the soil matric potential (SMP) at field capacity, allowing one to adjust the irrigation frequency, once the thresholds are defined. Field capacity is the moisture content or the SMP at which a soil is holding the maximum amount of water it can against the force of gravity. Table 2 contains guidelines for using SMP data to schedule irrigation events. Table 2. Irrigation guidelines for different soil type when using tensiometers. Soil Texture
SMP a (cb)
Soil Moisture Status and Irrigation Requirements
Sand, loamy sand Sandy loam, loam, silty loam Clay loam, clay
5–10 10–20 20–40
Soil at field capacity No irrigation required
Sand, loamy sand Sandy loam, loam, silt loam Clay loam, clay
20–40 40–60 50–10
50% available water depleted Irrigation required
a
SMP, soil matrix potential.
The utility of tensiometers in fine-textured soils is limited due to the range of detection; thus, tensiometers are practical in sandy or coarse-textured soils. Details about the use of tensiometers to schedule the irrigation of vegetable crops are provided by several authors, e.g., [99–102]. SMP thresholds for several vegetables produced in a variety of soil types are also provided [98].
•
Irrigation technologies
Using more efficient systems for water delivery decreases the use of water since it minimizes losses. Different types of irrigation systems have been adapted for use in horticultural crops. Hand-moved sprinklers and travelling guns are systems that present larger application efficiencies (Ea) than the surface irrigation systems; nevertheless, the uniformity of water distribution (UD) is greatly affected by wind conditions. When the UD is low, there is the tendency to over irrigate some of the areas in order to provide enough water to the others, causing considerable drainage fluxes and leaching in some parts of the field. Drip systems potentially optimize Ea and UD, and although they reduce the root development and the volume of soil used by the plants, they are very commonly used in horticultural systems, both for vegetables and for fruits trees and vineyards, as they reduce water consumption and the growth of competitor plants [103]. If fertilizer injection is combined with drip irrigation, greater yield increases are possible. The cost of installing a drip system is relatively high. However, the labor cost through the season is very low. A major advantage of drip systems is that less water is required. Drip irrigation provides the crop with a uniform supply of water through the season. 3.2.2. Fertilizer Management Fertilizer management strategies target both N source and N timing control, since they aim to redress the balance between nutrient supply and demand to minimize the potential loss and to define the best application timing. A meta-analysis study regarding N mitigation practices ranks fertilizer management strategies after irrigation water management and the use of cover crops [86]. The largest
Horticulturae 2017, 3, 25
10 of 23
effect was achieved by the reduction of the recommended amounts followed by improved fertilizer technologies. This group of strategies attained a leaching reduction of almost 40%.
•
Fertilizer amounts and formulations
The fertilizer amount to be supplied must compensate for the exported nutrients, assuming that the remaining organs will store or restores to the soil the nutrients retained. HPS require, in some cases, high levels of N fertilizers (>200 kg·ha−1 ) [17]. Furthermore, as horticultural crops are usually highly valued, the relative cost of this input is less important to farmers, and thus, they may apply it in excess, endangering environmental quality. The literature shows that the best relationship between nitrate leaching and yield is obtained when applying the recommended N fertilizer amount. Values below the recommended ones will reduce leaching, but also reduce yields. The focus is then the calculation of the recommended amount to meet plant demand and reducing excessive N input, considering other potential N sources, such as soil mineral N and potentially mineralizable N from the soil endogenous OM and from incorporated organic materials and the N provided by the irrigation water. As to the formulations, the N use efficiency of foliar urea application is higher than when N is applied to the soil. In addition, it promotes fungal disease control, reducing overwintering spores [103,104]. The lowest N losses reported are associated with ammonium sulfate or diammonium phosphate fertilizers, as ammonium is stored in the soil cationic exchange sites and, therefore, is much less likely to be leached past the tree roots [9]. It is also important to consider the interaction of the N fertilizer with other nutrients, namely with Ca or S; since the need to supply these secondary macronutrients requires the use of formulations that potentially contribute to N leaching, for instance Ca(NO3 )2 . The same applies to the formulations used to control the soil reaction, e.g., the use of (NH4 )2 SO4 to acidify the soil can contribute to N losses through volatilization [105].
•
Fertilizer application method
When urea is spread at the surface, the NH3 volatilization losses can be as high as 50% of the applied N [105]. Moreover, incorporating urea at depths higher than 7.5 cm can result in negligible NH3 emissions and maximum N retention. Application of urea before the onset of rain can significantly reduce the amount of ammonia volatilization because it washes the urea and ammonium below the soil surface. A study reports that 10–16 mm of rainfall soon after application of urea reduced the loss by over 80% [106]. Applying irrigation water after the application of urea fertilizer can also reduce the risk of ammonia volatilization [107]. Similarly, volatilization from applications of anhydrous ammonia can be minimized if the fertilizer is injected to depths below 10 cm when soils are moist, generally after winter or rainy seasons [41]. Measurements of volatilization losses from manure account for 68% of total NH4 + present for surface application, 17% for surface incorporation and 2% for deep placement [42]. Foliar applications until run-off also contribute to N loss, which can be minimized by surfactants, reducing the part of the nutrient supply that drips to the soil.
•
Optimized timing of fertilizer application
The date of application also affects the various pathways for the losses. For example, in the case of manure the greatest losses occur when it is applied in autumn because the soil is warm enough for mineralization. Besides, there is sufficient rainfall over the autumn and winter period to leach the resulting nitrate out of the soil profile. Woody crops, as pome or stone fruits, store N in perennial organs before leaf fall and use these reserves to enhance new metabolic activity at bud break. In this context, the delay of N supply to the active vegetative growth phase can minimize N losses. Results in young pear orchards demonstrate that the N supplied before bud break is not utilized by the trees, as they use first the stored N [108]. Applying nitrogen fertilizers and animal slurries at times when the risk of leaching is low, that is outside the rainy season, is a practice that reduces N losses associated with precipitation, which cannot
Horticulturae 2017, 3, 25
11 of 23
be controlled in open air HPS. Splitting fertilizer applications to match plant demand will also reduce volatilization and leaching losses [106].
•
Improved fertilizer technics
A reliable way to reduce NH3 volatilization is to coat urea fertilizer with a urease inhibitor, because it reduces the conversion rate of urea into ammonium in the soil [47,109]. A reduction of 42% in the cumulative NH3 emissions through the slower release of NH4 + to the soil solution from the hydrolysis of urea was reposted, which also promoted a lower exchangeable N pool [107]. Because ammonia volatilization losses from urea-based fertilizers are variable and unpredictable, the addition of a urease inhibitor can be a potentially valuable mitigation method [110]. The use of a nitrification inhibitor keeps the nitrogen in the NH4 + form, which the plants can use, preventing the accumulation of NO3 − in the soil profile, thus reducing the loss potential to the water bodies and to the atmosphere as N2 O. In some cases the addition of a nitrification inhibitor reduced the N2 O emissions by 45% (in season) and 40% (winter period) during a lettuce-cauliflower rotation, as compared with conventional fertilizer [111]. When the inhibitor was applied to poultry manure and to inorganic fertilizer (broccoli, lettuce and cauliflower crops), the reductions in N2 O losses were of 64% and 32%, respectively [60]. Nevertheless, the beneficial effect of nitrification inhibitors in decreasing direct N2 O emission can be undermined or even outweighed by an increase in NH3 volatilization [112]. The use of fertilizers with N in readably usable forms, as amino acids or algae extracts, can also contribute to reduce N losses, as it promotes a faster N uptake [113]. However, this option is still quite expensive and not overall established. The use of fertilizer techniques can reduce nitrate leaching by 20%–30% compared with standard fertilizers. Nevertheless, it may incur an additional cost for the farmer [88].
•
Organic manures and composts
Agricultural wastes, industrial wastes and sewage sludge (biosolids) usually contain large amounts of nitrogen. Much of the N in these manures and wastes can be released through mineralization processes in the soil, which ultimately results in a risk of nitrate leaching [53,114]. However, it is very difficult to predict the mineralization rate of these organic wastes and manures because of the variability of the constituent materials [115]. Nitrate leaching losses were reported to be significantly higher from poultry manure (low C:N) or slurry than from straw-based (higher C:N) farm yard manure when applied to an arable free-draining soil in the U.K. [116]. In fact, the addition of organic carbon in these wastes may also increase the rate of mineralization/immobilization turnover of soil N, as well as the applied N [117]. Well matured compost should substitute for fresh manure since it presents higher C:N, hence lower mineralization rates. The calculation of the crop needs should consider the soil mineral N at transplanting, which must be always assessed, and also, the N from organic sources by estimating a mineralization coefficient [118]. In the EU, very large manure applications are not allowed due to the EU limit of 170 kg·ha−1 for the nitrate vulnerable zones (Nitrates Directive), and the allowed application periods should be respected according to each country’s action program and rainfall pattern.
•
Monitoring of plant and/or soil N status
The synchronization between N fertilization and crop N demand is essential in order to minimize the amount of N that over the season is in the soil constituting a potential loss. This may be improved by regular analysis of soil solution, plant sap analysis, leaf chlorophyll measurements or plant tissue testing. This management practice is particularly important for vegetable crops, since for woody species, the buffering capacity conferred by the perennial structures reduces the impact of the monitoring. For these cases, the N correction of fertilization management will have an effect predominantly in the coming season. Tissue testing involves taking samples from the plant (most commonly leaves) at various times during the growth period and sending them to a
Horticulturae 2017, 3, 25
12 of 23
laboratory for mineral nutrient analysis [15]. Petiole sap testing involves taking leaf petioles and collecting the sap, which is then tested for nitrate and/or potassium using portable meters [119]. Chlorophyll meters are used to measure the “greenness” of individual leaves and to monitor nitrogen status after proper calibration against the crop with proper fertilization [120,121]. Monitoring the soil N status by collecting soil samples, or placing suction cups beyond the root system to collect soil solution, also constitute efficient mitigation practices, as they provide information regarding the N stored in the soil and/or moving beyond the roots’ depth. 4. Assessment of the Effectiveness of Mitigation Measures The success of a mitigation strategy under specific conditions will allow its implementation to be increasingly targeted and more cost effective. Assessment methods are therefore required to evaluate and to quantify the impact of mitigation strategies. These methods provide evidence of a reduction in nutrient loadings or concentration in the receiving compartments (water body or atmosphere) or an improvement in ecological response [73]. Assessment methods must also recognize responses to mitigation that are often site-specific, since a positive response in one area may not be repeated elsewhere. They must be both practical and suited to their end users. The most commonly-used assessment methods are described below. 4.1. Measurements Long time series of N concentrations in the environmental compartments provide the best analysis of mitigation success, since they describe actual changes resulting from the implementation of a mitigation practice either at the source, timing or transport (Table 3). However, it is not always clear why any response to mitigation has been achieved because of the complex environmental processes involved and our incomplete knowledge of nutrient dynamics. Variations in weather between years add another layer of complexity and make it difficult to distinguish the effect of the mitigation method from environmental noise [122]. Table 3. Assessment method features applicable at field and farm scales (from [73]). Mitigation Type Source Timing Transport Data requirements Uncertainty
Assessment Method Measurement
Budget
Modelling
Y Y Y
Y N N
Y Y Y
medium low
low medium
medium/high medium
Y, sensitive; N, not sensitive.
In the medium-term, the continued development and installation of automated in situ sampling and analytical equipment facilitating high frequency sampling will help improve our understanding and provide more representative assessments [123]. Moreover, sometimes, long time series are necessary to reveal the impact of a mitigation strategy. In this case, or where the measurement is not cost effective, alternatives are required, e.g., nutrient budgets and modelling [73]. 4.2. Farm Surveys and Nutrient Budgets Nutrient budgets are commonly used to assess nutrient management by evaluating inputs and outputs over a period of time. First, there is a need for a survey to collect enough information to enable a thorough system analysis of the crop production practices [124]. The surveyed information is then used to perform the particular water and N budgets. The overall objective is to compare the total amount of water applied with the crop evapotranspiration and the total amount of N fertilizer applied with crop N uptake to identify and quantify possible N surplus and its origin. As the nutrient budget is significantly influenced by horticulture practices, the balances assessment provides an overview of
4.2. Farm Surveys and Nutrient Budgets Nutrient budgets are commonly used to assess nutrient management by evaluating inputs and outputs over a period of time. First, there is a need for a survey to collect enough information to enable a thorough system analysis of the crop production practices [124]. The surveyed information Horticulturae 2017, 3, 25 13 of 23 is then used to perform the particular water and N budgets. The overall objective is to compare the total amount of water applied with the crop evapotranspiration and the total amount of N fertilizer current practices the improvement NUE. The nutrient budget can calculated applied with and crop allows N uptake to identify and of quantify possible N surplus and its be origin. As the using nutrient budget is significantly influenced by horticulture practices, balance the balances assessment simple tools as spreadsheets and user-friendly interfaces. A positive indicates a potential provides an overview of current practices and allows the improvement of NUE. The nutrient budget loss of nutrients to the environment or a nutrient accumulation in the soil, usually designated as can be calculated using simple tools as spreadsheets and user‐friendly interfaces. A positive balance surplus. A negative balance signifies soil nutrient depletion. Different budget levels can be considered indicates a potential loss of nutrients to the environment or a nutrient accumulation in the soil, in association with the system boundaries according to the available data and the purposes of the usually designated as surplus. A negative balance signifies soil nutrient depletion. Different budget study (Figure 3). Farm gate balances, for example, demand minimal and routinely available data levels can be considered in association with the system boundaries according to the available data in farm records compared with soil surface or soil system balances. Thus, the budgets quantify and the purposes of the study (Figure 3). Farm gate balances, for example, demand minimal and waterroutinely available data in farm records compared with soil surface or soil system balances. Thus, and nutrients that enter and leave the farm gate with no consideration of internal transfers or loss processes [63]. The key information to be collected in the horticultural farm consists of the the budgets quantify water and nutrients that enter and leave the farm gate with no consideration area occupied each crop, the amounts of N applied in fertilizers (mineral and organic) and soil of internal by transfers or loss processes [63]. The key information to be collected in the horticultural farm consists of the area occupied by each crop, the amounts of N applied in fertilizers (mineral and amendments, the N fixation by the crops, the irrigation volumes and yields per crop. organic) and soil amendments, the N fixation by the crops, the irrigation volumes and yields per crop.
Figure 3. Schematization of the nitrogen budget for horticultural crops, with examples of inputs and Figure 3. Schematization of the nitrogen budget for horticultural crops, with examples of inputs and outputs considered at three levels: (a) farm gate; (b) soil surface; (c) soil system. Adapted from [63].
outputs considered at three levels: (a) farm gate; (b) soil surface; (c) soil system. Adapted from [63].
The soil surface budgets account for the water and N fluxes through the soil surface boundary while the soil system budgets also consider all of the inputs and outputs resulting from biochemical The soil surface budgets account for the water and N fluxes through the soil surface boundary occurring with the soil profile. all These two approaches correspond to a more whileprocesses the soil system budgets also consider of the inputs and outputs resulting fromscientific biochemical approach often requiring field experiments and the use of mathematical models. processes occurring with the soil profile. These two approaches correspond to a more scientific Some studies have calculated the N balances for different vegetable production systems and approach often requiring field experiments and the use of mathematical models. have estimated that between 9% and 90% of the N applied is not used by the crops and, thus, is Some studies have calculated the N balances for different vegetable production systems and potentially lost [125]. These surpluses should be used to estimate potential nutrient loss. To improve have the relationship between surpluses and losses, some researchers propose that the budgets should be estimated that between 9% and 90% of the N applied is not used by the crops and, thus, is potentially lost [125]. These surpluses should be used to estimate potential nutrient loss. To improve averaged over a significant number of years to eliminate the effect of temporal variation in climate the relationship between surpluses and losses, some researchers propose that the budgets should be and farming practices [126,127]. Although the variety of existent accounting systems and the extent of their adoption is encouraging, a uniform and coherent concept for budget calculations at the field averaged over a significant number of years to eliminate the effect of temporal variation in climate and farm scale is required [126,128]. Nonetheless, the simple budgeting approaches like extent the of and farming practices [126,127]. Although the variety ofmore existent accounting systems and the farm gate budget fail to consider the timing and transport aspects of mitigation (Table 4) and assume their adoption is encouraging, a uniform and coherent concept for budget calculations at the field and a direct causal relationship between potential and actual nutrient loss [73]. farm scale is required [126,128]. Nonetheless, the more simple budgeting approaches like the farm gate budget fail to consider the timing and transport aspects of mitigation (Table 4) and assume a direct causal relationship between potential and actual nutrient loss [73].
Horticulturae 2017, 3, 25
14 of 23
Table 4. Main features of selected models for the simulation of the water and N-related process in horticultural systems. Model
Type
N Loss Mitigation Measures
Pros
Cons
Application Examples [129]
Export-coefficient
E
fertilizer management
simplicity and minimum data requirements
does not allow extrapolation beyond the range of available information
Sticks
C
irrigation and fertilizer management
adaptability to various crops; reasonable amount of input data
so far, it has not been used much for vegetables
[130]
DNDC
PB
fertilizer and manure management; crop management (cover crops, rotation, tillage); nitrification inhibitors and slow release fertilizers; irrigation management
big detail in simulating the soil biogeochemical processes; holistic in relation to the different N path losses
big amount of crop physiological parameters as input data; needs more evaluation for vegetable production systems
[131,132]
EU-Rotate
PB
fertilizer management
database with parameters for most vegetable crops; big detail in the N transformations; simple calibration; economic assessment
research model that needs more work; additional studies are necessary to calibrate the mineralization factor of this model for Mediterranean conditions
[133,134]
RZWQM2
PB
fertilizer and manure management; crop management (rotation, mulching, tillage); cover crops; irrigation management; nitrification inhibitors and slow-release fertilizers
database with parameters for most vegetable crops and fruit trees; holistic for the soil-crop-atmosphere system and for the different N path losses; extensive database
considerable amount of soil, crop parameters; average to high difficulty in parameterization and calibration
[36,135–137]
SWAT
PB
reduced fertilization; cover crops, filter strips; crop management (rotation and tillage); fertilization strategies
holistic in relation to the different N path losses (with a modified version)
requires a big amount of soil, crop parameters; difficult parameterization and calibration
[138–140]
VegSyst
C
dry matter production and crop uptake as a result of fertilization management; when incorporated in a DSS predicts N fertilization requirements
specific for vegetable production
it does not predict N losses, but as it predicts uptake, it can be used to optimize crop uptake efficiency
[141–143]
E, empirical; C, conceptual; PB, process based.
Horticulturae 2017, 3, 25
15 of 23
4.3. Modelling Water and N-Related Processes in Horticultural Systems The increasing concern about the quality of the environment, together with the development of hardware, software and user-friendly interfaces led to an increase in the use of modelling in agricultural systems. Lately, the evaluation of the implementation of the environmental policies has also been a driver for modelling applications. There is a range in the complexity and variety of models for assessing the environmental impact of the water and N cycles in agricultural production systems. These models provide mechanisms for comparing the relative effects of differing mitigation practices on yields and N losses for different soil-crop-climate systems. The running of a number of scenarios has already demonstrated that nitrogen management in field vegetable rotations can be improved in Europe by following at least good agricultural practices. Considering the approach by which the various models simulate water and nitrogen dynamics in the soil, it is possible to distinguish from simple empirical applications to comprehensive, fully process-driven models. Examples of these types of models applicable at plot and farm scales are given in Table 4, including application case references. Empirical models evaluate inputs and outputs, but provide no consideration of internal dynamics, adopting instead a ‘black box’ approach. They are built on quantitative relationships rather than process understanding and generally have low data requirements. These features limit the evaluation of some mitigation methods. Conceptual models occupy an intermediate position in terms of complexity, being process informed and requiring greater empirical evidence to support the selection of coefficients, but not yet offering a full process representation. Process models attempt to simulate the complete systems and quantify all processes that constitute them. They are therefore computationally intense, require expertise and have large data requirements. The wide range of inputs and parameters, the inclusion of transport processes, short time steps and high spatial resolution allow the simulation of source, time and transport mitigation methods. Simulation models need preparatory work of calibration and validation before being used with different crops and soils, which is a rather expensive and time-consuming task. Some of the models that simulate the N dynamics in the soil-plant system are too complex to be used and/or understood by farmers or are still in the state of research at the moment. They require a large amount of input data, and in some cases, research is necessary to obtain calibration factors for specific horticulture crops. The more complex models are useful to test new strategies at a regional level and for legislation purposes. In most cases, advisors should support farmers when they want to use prediction models, and the latter should be involved in the demonstration of models. Some models have been simplified to make them easier to be used by farmers and consultants, reducing the number of required inputs and assuming the possible risk of loss of accuracy. These simplified models work well and provide simple and useful information for farmers to design appropriate and to compare different fertilization and irrigation strategies. 5. Conclusions The reduction of N emissions to water bodies and the atmosphere by horticultural production systems is required. Current directives and international conventions regarding agriculture consider the threats from NO3 − leaching, NH3 and N2 O emissions separately. However, when not combined with an integrated approach to N and irrigation management, the policy measures may induce mitigation strategies/practices with antagonistic effects (swapping pollution). The combined use of fertigation and drip irrigation to frequently apply small amounts of water and N throughout a crop cycle provides the technical possibility for precise N and irrigation management. A combination of optimal water management and applying recommended fertilization rates should be the most profitable choice for the farmer. The recommendations must be corrected in situ by using soil and plant monitoring devices. In addition to the in-crop season good practices, the use of cover crops to catch the N released from the horticultural crop residues during the winter period also seems indispensable. The use of fast-growing rootstocks, mycorrhizal plants or more ready-to-assimilate
Horticulturae 2017, 3, 25
16 of 23
fertilizers, as amino acids, are other examples of mitigation strategies that can also contribute to reduce N losses. Mitigation strategies need to be assessed and the best ones selected and broadly applied at low cost. Simulation models can make long-term assessments as opposed to an expensive and time-consuming pure classical field research. Once models have been calibrated and validated against selected field data, they can be used before and during the cropping season considering the crop type, management practices and environmental conditions for better fertilization and irrigation strategies. A range of potential mitigation practices can be evaluated using models, and the most promising ones can be field tested. Additional studies are still necessary to create complete reference databases (climatic data, physical and chemical soil parameters and crop calibration factors) for different European areas to promote the use of prediction models. The combined use of soil and plant monitoring sensors and simulation models is a useful group of tools for designing optimal irrigation and N management practices that mitigate N losses. The combination of these techniques with crop rotation and intercropping systems will undoubtedly improve the NUE of horticulture crops and minimize N losses as a whole. Author Contributions: Maria do Rosário Cameira outlined the paper; Maria do Rosário Cameira and Mariana Mota wrote the paper. Conflicts of Interest: The authors declare no conflict of interest.
References 1. 2.
3. 4. 5.
6.
7. 8.
9.
10.
11.
World Meteorological Organization. Planning of Water Quality Monitoring Systems; Technical report series 3; WMO: Geneva, Switzerland, 2013; p. 117. Oenema, O.; Bleeker, A.; Braathen, N.A.; Budnakova, M.; Bull, K.; Cermak, P.; Geupel, M.; Hicks, K.; Hoft, R.; Kozlova, N.; et al. Nitrogen in current European policies. In The European Nitrogen Assessment; Sutton, M., Howard, C., Erisman, J., Billen, G., Bleeker, A., Grennfelt, P., Grinsven, H., Grizzetti, B., Eds.; Cambridge University Press: Cambridge, UK, 2011; pp. 62–81. Addiscott, T.M. Fertilizers and nitrate leaching. In Agricultural Chemicals and the Environment Issues; Hester, R.E., Harrison, R.M., Eds.; CABI: Oxfordshire, UK, 1996; pp. 1–26. Di, H.J.; Cameron, K.C. Nitrate leaching in temperate agroecosystems: Sources, factors and mitigating strategies. Nutr. Cycl. Agroecosyst. 2002, 64, 237–256. [CrossRef] Ward, M.H.; DeKok, T.M.; Levallois, P.; Brender, J.; Gulis, G.; Nolan, B.T.; VanDerslice, J. Workgroup report: Drinking-water nitrate and health-recent findings and research needs. Environ. Health Perspect. 2005, 113, 1607–1614. [CrossRef] [PubMed] Grizzetti, B.; Bouraoui, F.; Billen, G.; van Grinsven, H.; Cardoso, A.C.; Thieu, V.; Garnier, J.; Curtis, C.; Howarth, R.W.; Johnes, P. Nitrogen as a threat to European water quality. In The European Nitrogen Assessment; Sutton, M., Howard, C., Erisman, J., Billen, G., Bleeker, A., Grennfelt, P., Grinsven, H., Grizzetti, B., Eds.; Cambridge University Press: Cambridge, UK, 2011; pp. 379–404. Smith, V.H.; Tilman, G.D.; Nekola, J.C. Eutrophication: Impacts of excess nutrient inputs on freshwater, marine, and terrestrial ecosystems. Environ. Pollut. 1999, 100, 179–196. [CrossRef] Moldanovaá, J.; Grennfelt, P.; Jonsson, Å.; Simpson, D.; Spranger, T.; Aas, W.; Munthe, J.; Rabl, A. Nitrogen as a threat to European air quality. In The European Nitrogen Assessment; Sutton, M., Howard, C., Erisman, J., Billen, G., Bleeker, A., Grennfelt, P., Grinsven, H., Grizzetti, B., Eds.; Cambridge University Press: Cambridge, UK, 2011; pp. 405–433. Cameron, K.C.; Rate, A.W.; Noonan, M.J.; Moore, S.; Smith, N.P.; Kerr, L.E. Lysimeter study of the fate of nutrients following subsurface injection and surface application of dairy pond sludge to pasture. Agric. Ecosyst. Environ. 1996, 58, 187–197. [CrossRef] Oenema, O.; Oudendag, D.A.; Witzke, H.P.; Monteny, G.J.; Velthof, G.L.; Pietrzak, S.; Pinto, M.; Britz, W.; Schwaiger, E.; Erisman, J.W.; et al. Integrated Measures in Agriculture to Reduce Ammonia Emissions; Final Summary Report; Alterra: Wageningen, The Netherlands, 2007. Stevens, C.J.; Quinton, J.N. Diffuse pollution swapping in arable agricultural systems. Crit. Rev. Environ. Sci. Technol. 2009, 39, 478–520. [CrossRef]
Horticulturae 2017, 3, 25
12. 13. 14.
15.
16. 17. 18. 19.
20. 21. 22. 23.
24. 25.
26. 27. 28.
29. 30. 31.
32. 33.
17 of 23
Goulding, K. Nitrate leaching from arable and horticultural land. Soil Use Manag. 2000, 16, 145–151. [CrossRef] Pionke, H.B.; Sharma, M.L.; Hirschberg, K.J. Impact of irrigated horticulture on nitrate concentrations in groundwater. Agric. Ecosys. Environ. 1990, 32, 119–132. [CrossRef] Zhu, J.H.; Li, X.L.; Christie, P.; Li, J.L. Environmental implications of low nitrogen use efficiency in excessively fertilized hot pepper (Capsicum frutescens L.) cropping systems. Agric. Ecosys. Environ. 2005, 111, 70–80. [CrossRef] Peña-Fleitas, M.T.; Gallardo, M.; Thompson, R.B.; Farneselli, M.; Padilla, F.M. Assessing crop N status of fertigated vegetable crops using plant and soil monitoring techniques. Ann. Appl. Biol. 2015, 167, 387–405. [CrossRef] [PubMed] Agneessens, L.; De Waele, J.; De Neve, S. Review of alternative management options of vegetable crop residues to reduce nitrate leaching in intensive vegetable rotations. Agronomy 2014, 4, 529–555. [CrossRef] Congreves, K.A.; Van Eerd, L.L. Nitrogen cycling and management in intensive horticultural systems. Nutr. Cycl. Agroecosyst. 2015, 102, 299–318. [CrossRef] Connor, D.J.; Gómez-del-Campo, M.; Rousseaux, M.C.; Searles, P.S. Structure, management and productivity of hedgerow olive orchards: A review. Sci. Hortic. 2014, 169, 71–93. [CrossRef] Rufat, J.; Villar, J.M.; Pasqual, M.; Falguera, V.; Arbonés, A. Productive and vegetative response to different irrigation and fertilization strategies of an Arbequina olive orchard grown undersuper-intensive conditions. Agric. Water Manag. 2014, 144, 33–41. [CrossRef] FAO. Statistical Year Book, Europe and Central Asia Food and Agriculture; FAO: Budapest, Hungary, 2014. Vázquez, N.; Pardo, A.; Suso, M.L.; Quemada, M. Drainage and nitrate leaching under processing tomato growth with drip irrigation and plastic mulching. Agric. Ecosyst. Environ. 2006, 112, 313–323. Tilman, D.; Cassman, K.G.; Matson, P.A.; Naylor, R.; Polasky, S. Agricultural sustainability and intensive production practices. Nature 2002, 418, 671–677. [CrossRef] [PubMed] Agostini, F.; Tei, F.; Silgram, M.; Farneselli, M.; Benincasa, P.; Aller, M.F. Decreasing nitrate leaching in vegetable crops with better N management. In Genetic Engineering, Biofertilisation, Soil Quality and Organic Farming; Sustainable Agriculture Reviews; Lichtfouse, E., Ed.; Springer: Heidelberg, Germany, 2010; Volume 4, pp. 147–200. Christensen, B.T. Tightening the Nitrogen Cycle. In Managing Soil Quality—Challenges in Modern Agriculture; CAB International: Wallingford, UK, 2004; pp. 47–67. Galloway, J.N.; Dentener, F.J.; Capone, D.G.; Boyer, E.W.; Howarth, R.W.; Seitzinger, S.P.; Asner, G.P.; Cleveland, C.C.; Green, P.A.; Holland, E.A.; et al. Nitrogen cycles: Past, present, and future. Biogeochemistry 2004, 70, 153–226. [CrossRef] Hillel, D. Environmental Soil Physics: Fundamentals, Applications, and Environmental Considerations; Academic Press: London, UK, 1998; p. 771. Mitchell, R.; Webb, J.; Harrison, R. Crop residues can affect N leaching over at least two winters. Eur. J. Agron. 2001, 15, 17–29. [CrossRef] Wyland, L.J.; Jackson, L.E.; Chaney, W.E.; Klonsky, K.; Koike, S.T.; Kimple, B. Winter cover crops in a vegetable cropping system: Impacts on nitrate leaching, soil water, crop yield, pests and management costs. Agric. Ecosyst. Environ. 1996, 59, 1–17. [CrossRef] De Neve, S.; Sáez, S.G.; Daguilar, B.C.; Sleutel, S.; Hofman, G. Manipulating N mineralization from high N crop residues using on-and off-farm organic materials. Soil Biol. Biochem. 2004, 36, 127–134. [CrossRef] Feaga, J.B.; Selker, J.S.; Dick, R.P.; Hemphill, D.D. Long-term nitrate leaching under vegetable production with cover crops in the Pacific Northwest. Soil Sci. Soc. Am. J. 2010, 74, 186–195. [CrossRef] Campiglia, E.; Mancinelli, R.; Radicetti, E.; Marinari, S. Legume cover crops and mulches: Effects on nitrate leaching and nitrogen input in a pepper crop (Capsicum annuum L.). Nutr. Cycl. Agroecosyst. 2011, 89, 399–412. [CrossRef] Bruin, A.J.; Ball Coelho, B.R.; Beyaert, R.P.; Reeleder, R.D.; Roy, R.C.; Capell, B. High value crops in coarse-textured soil and nitrate leaching—How risky is it? Can. J. Plant Sci. 2010, 90, 515–528. [CrossRef] Sharma, P.; Shukla, M.K.; Sammis, T.W.; Adhikari, P. Nitrate-nitrogen leaching from onion bed under furrow and drip irrigation systems. Appl. Environ. Soil Sci. 2012, 2012, 650206. [CrossRef]
Horticulturae 2017, 3, 25
34.
35.
36.
37. 38. 39. 40. 41. 42.
43.
44. 45.
46.
47. 48.
49. 50. 51. 52. 53. 54. 55.
18 of 23
Chotangui, A.H.; Sugahara, K.; Okabe, M.; Kasuga, S.; Isobe, K.; Higo, M.; Torigoe, Y. Evaluation of NO3 -N Leaching in Commercial Fields of Leafy Vegetables by the Soil Nitrogen Balance Estimation System. Environ. Control Biol. 2015, 53, 145–157. [CrossRef] Woli, P.; Hoogenboom, G.; Alva, A. Simulation of potato yield, nitrate leaching, and profit margins as influenced by irrigation and nitrogen management in different soils and production regions. Agric. Water Manag. 2016, 171, 120–130. [CrossRef] Merwin, I.A.; Ray, J.A.; Steenhuis, T.S.; Boll, J. Groundcover management systems influence fungicide and nitrate-N concentrations in leachate and runoff from a New York apple orchard. J. Am. Soc. Hortic. Sci. 1996, 121, 249–257. Cameira, M.R.; Pereira, A.; Ahuja, L.; Ma, L. Sustainability and environmental assessment of fertigation in an intensive olive grove under Mediterranean conditions. Agric. Water Manag. 2014, 146, 346–360. [CrossRef] Hardie, M.A.; Oliver, G.; Clothier, B.E.; Bound, S.A.; Green, S.A.; Close, D.C. Effect of biochar on nutrient leaching in a young apple orchard. J. Environ. Qual. 2015, 44, 1273–1282. [CrossRef] [PubMed] Lea-Cox, J.D.; Syvertsen, J.P.; Graetz, D.A. Springtime 15 Nitrogen uptake, partitioning, and leaching losses from young bearing citrus trees of differing nitrogen status. J. Am. Soc. Hort. Sci. 2001, 126, 242–251. Lehmann, J.; Schroth, G. Nutrient leaching. In Trees, Crops and Soil Fertility; Schroth, G., Sinclair, F.L., Eds.; CABI: Oxfordshire, UK, 2003; pp. 151–166. Sommer, S.G.; Schjoerring, J.K.; Denmead, O.T. Ammonia emission from mineral fertilizers and fertilized crops. Adv. Agron. 2004, 82, 557–622. Huijsmans, J.F.M.; Hol, J.M.G.; Vermeulen, G.D. Effect of application method, manure characteristics, weather and field conditions on ammonia volatilization from manure applied to arable land. Atmos. Environ. 2003, 37, 3669–3680. [CrossRef] Miola, E.C.; Rochette, P.; Chantigny, M.H.; Angers, D.A.; Aita, C.; Gasser, M.O.; Pelster, D.E.; Bertrand, N. Ammonia volatilization after surface application of laying-hen and broiler-chicken manures. J. Environ. Qual. 2014, 43, 1864–1872. [CrossRef] [PubMed] De Ruijter, F.J.; Huijsmans, J.F.M.; Rutgers, B. Ammonia volatilization from crop residues and frozen green manure crops. Atmos. Environ. 2010, 44, 3362–3368. [CrossRef] Sadeghpour, A.; Hashemi, M.; Weis, S.A.; Spargo, J.T.; Mehrvarz, S.; Herbert, S.J. Assessing tillage systems for reducing ammonia volatilization from spring-applied slurry manure. Commun. Soil Sci. Plant Anal. 2015, 46, 724–735. [CrossRef] Sutton, M.A.; Grinsven, H. Summary for policy makers. In The European Nitrogen Assessment; Sutton, M.A., Howard, C.M., Erisman, J.W., Billen, G., Grennfelt, P., van Grinsven, H., Grizzetti, B., Eds.; Cambridge Univerity Press: Cambridge, UK, 2011; pp. 2–18. Bishop, P.; Manning, M. Urea Volatilisation: The Risk Management and Mitigation Strategies; Occasional Report no. 24; Massey University: Palmerston North, New Zealand, 2010. Rochette, P.; Tremblay, N.; Fallon, E.; Angers, D.A.; Chantigny, M.H.; MacDonald, J.D.; Bertrand, N.; Parent, L.É. N2 O emissions from an irrigated and non-irrigated organic soil in eastern Canada as influenced by N fertilizer addition. Europ. J. Soil Sci. 2010, 61, 186–196. [CrossRef] Trost, B.; Prochnow, A.; Drastig, K.; Meyer-Aurich, A.; Ellmer, F.; Baumecker, M. Irrigation, soil organic carbon and N2 O emissions. A review. Agron. Sustain. Dev. 2013, 33, 733–749. [CrossRef] Benckiser, G.; Schartel, T.; Weiske, A. Control of NO3 − and N2 O emissions in agroecosystems: A review. Agron. Sustain. Dev. 2015, 35, 1059–1074. [CrossRef] Prosser, J.I. The ecology of nitrifying bacteria. In Biology of the Nitrogen Cycle; Bolhe, H., Fergusoin, S.J., Newton, W.E., Eds.; Elsevier: Oxford, UK, 2006; pp. 223–245. Kool, D.M.; Müller, C.; Wrage, N.; Oenema, O.; Van Groenigen, J.W. Oxygen exchange between nitrogen oxides and H2 O can occur during nitrifier pathways. Soil Biol. Biochem. 2009, 41, 1632–1641. [CrossRef] Cameron, K.C.; Di, H.J.; Moir, J.L. Nitrogen losses from the soil/plant system: A review. Ann. Appl. Biol. 2013, 162, 145–173. [CrossRef] Haynes, R. Mineral Nitrogen in the Plant-Soil System; Elsevier: Amsterdam, The Netherlands, 2012. Monaghan, R.M.; Barraclough, D. Some chemical and physical factors affecting the rate and dynamics of nitrification in urine-affected soil. Plant Soil 1992, 143, 11–18. [CrossRef]
Horticulturae 2017, 3, 25
56.
57. 58. 59. 60.
61. 62. 63. 64. 65. 66.
67. 68.
69. 70. 71.
72. 73. 74. 75.
76.
77.
19 of 23
Saggar, S.; Jha, N.; Deslippe, J.; Bolan, N.S.; Luo, J.; Giltrap, D.L.; Kim, D.-G.; Zaman, M.; Tillman, R.W. Denitrification and N2 O: N2 production in temperate grasslands: Processes, measurements, modelling and mitigating negative impacts. Sci. Total Environ. 2013, 465, 173–195. [CrossRef] [PubMed] Ye, R.B.; Averill, B.A.; Tiedje, J.M. Denitrification: Production and consumption of nitric oxide. Appl. Environ. Microbiol. 1994, 60, 1053–1058. [PubMed] Ussiri, D.; Lal, R. The role of nitrous oxide on climate change. In Soil Emission of Nitrous Oxide and Its Mitigation; Springer: Dordrechet, The Netherlands, 2013; pp. 1–28. Davidson, E.A. Soil water content and the ratio of nitrous oxide to nitric oxide emitted from soil. In Biogeochemistry of Global Change; Springer: Berlin, Germany, 1993; pp. 369–386. Pfab, H.; Palmer, I.; Buegger, F.; Fiedler, S.; Müller, T.; Ruser, R. Influence of a nitrification inhibitor and of placed N-fertilization on N2 O fluxes from a vegetable cropped loamy soil. Agric. Ecosyst. Environ. 2012, 150, 91–101. [CrossRef] Zhu, T.; Zhang, J.; Yang, W.; Cai, Z. Effects of organic material amendment and water content on NO, N2 O, and N2 emissions in a nitrate-rich vegetable soil. Biol. Fertil. Soils 2013, 49, 153–163. [CrossRef] Velthof, G.L.; Kuikman, P.J.; Oenema, O. Nitrous oxide emission from soils amended with crop residues. Nutr. Cycl. Agroecosyst. 2002, 62, 249–261. [CrossRef] Cherry, K.A.; Shepherd, M.; Withers, P.J.A.; Mooney, S.J. Assessing the effectiveness of actions to mitigate nutrient loss from agriculture: A review of methods. Sci. Total Environ. 2008, 406, 1–23. [CrossRef] [PubMed] Palmer, J.W.; Dryden, G. Fruit mineral removal rates from New Zealand apple (Malus domestica) orchards in the Nelson region. N. Z. J. Crop Hortic. Sci. 2006, 34, 27–32. [CrossRef] De Neve, S.; Hofman, G. N mineralization and nitrate leaching from vegetable crop residues under field conditions: A model evaluation. Soil Biol. Biochem. 1998, 30, 2067–2075. [CrossRef] Chaves, B.; De Neve, S.; Cabrera, M.D.C.L.; Boeckx, P.; Van Cleemput, O.; Hofman, G. The effect of mixing organic biological waste materials and high-N crop residues on the short-time N2 O emission from horticultural soil in model experiments. Biol. Fertil. Soils 2005, 41, 411–418. [CrossRef] De Neve, S.; Pannier, J.; Hofman, G. Temperature effects on C-and N-mineralization from vegetable crop residues. In Proceedings of the 8th Nitrogen Workshop, Ghent, Belgium, 5–8 September 1996; pp. 41–46. Trinsoutrot, I.; Nicolardot, B.; Justes, E.; Recous, S. Decomposition in the field of residues of oilseed rape grown at two levels of nitrogen fertilisation. Effects on the dynamics of soil mineral nitrogen between successive crops. Nutr. Cycl. Agroecosyst. 2000, 56, 125–137. [CrossRef] Congreves, K.A.; Vyn, R.J.; Van Eerd, L.L. Evaluation of post-harvest organic carbon amendments as a strategy to minimize nitrogen losses in cole crop production. Agronomy 2013, 3, 181–199. [CrossRef] Rahn, C.R.; Vaidyanathan, L.V.; Paterson, C.D. Nitrogen residues from brassica crops. Asp. Appl. Biol. 1992, 30, 263–270. Everaarts, A.P.; De Moel, C.P.; Van Noordwijk, M. The effect of nitrogen and the method of application on nitrogen uptake of cauliflower and on nitrogen in crop residues and soil at harvest. NJAS Wagening. J. Life Sci. 1996, 44, 43–55. Nett, L.; Feller, C.; George, E.; Fink, M. Effect of winter catch crops on nitrogen surplus in intensive vegetable crop rotations. Nutr. Cycl. Agroecosyst. 2011, 91, 327–337. [CrossRef] Whitmore, A.P. Modelling the release and loss of nitrogen after vegetable crops. NJAS Wagening. J. Life Sci. 1996, 44, 73–86. Bakker, C.J.; Swanton, C.J.; McKeown, A.W. Broccoli growth in response to increasing rates of pre-plant nitrogen. I. Yield and quality. Can. J. Plant Sci. 2009, 89, 527–537. [CrossRef] Wehrmann, J.; Scharpf, H.C. Reduction of nitrate leaching in a vegetable farm: Fertilization, crop rotation, plant residues. In Management Systems to Reduce Impact of Nitrates; Elsevier Applied Sciences: London, UK, 1989. Coppens, F.; Garnier, P.; Findeling, A.; Merckx, R.; Recous, S. Decomposition of mulched versus incorporated crop residues: Modelling with PASTIS clarifies interactions between residue quality and location. Soil Biol. Biochem. 2007, 39, 2339–2350. [CrossRef] Mitchell, R.D.J.; Harrison, R.; Russell, K.J.; Webb, J. The effect of crop residue incorporation date on soil inorganic nitrogen, nitrate leaching and nitrogen mineralization. Biol. Fertil. Soils 2000, 32, 294–301. [CrossRef]
Horticulturae 2017, 3, 25
78.
79.
80.
81. 82. 83.
84.
85. 86.
87. 88.
89. 90. 91. 92.
93. 94. 95.
96. 97. 98.
20 of 23
Smit, A.L.; de Ruijter, F.J.; ten Berge, H.F.M. The fate of nitrogen from crop residues of broccoli, leek and sugar beet. In Proceedings of the IV International Symposium on Ecologically Sound Fertilization Strategies for Field Vegetable Production, Alnarp, Sweden, 22–29 September 2008; Volume 852, pp. 157–162. Nutter, F., Jr. The role of plant disease epidemiology in developing successful integrated disease management programs. In General Concepts in Integrated Pest and Disease Management; Ciancio, A., Mukerji, K.J., Eds.; Springer: Berlin, Germany, 2007; pp. 45–90. Thorup-Kristensen, K.; Dresbøll, D.B.; Kristensen, H.L. Crop yield, root growth, and nutrient dynamics in a conventional and three organic cropping systems with different levels of external inputs and N re-cycling through fertility building crops. Eur. J. Agron. 2012, 37, 66–82. [CrossRef] Thorup-Kristensen, K. Effect of deep and shallow root systems on the dynamics of soil inorganic N during 3-year crop rotations. Plant Soil. 2006, 288, 233–248. [CrossRef] Gabriel, J.L.; Muñoz-Carpena, R.; Quemada, M. The role of cover crops in irrigated systems: Water balance, nitrate leaching and soil mineral nitrogen accumulation. Agric. Ecosyst. Environ. 2012, 155, 50–61. [CrossRef] Campiglia, E.; Mancinelli, R.; Di Felice, V.; Radicetti, E. Long-term residual effects of the management of cover crop biomass on soil nitrogen and yield of endive (Cichorium endivia L.) and savoy cabbage (Brassica oleracea var. sabauda). Soil Tillage Res. 2014, 139, 1–7. [CrossRef] Bliss, C.; Andersen, P.; Brodbeck, B.; Wright, D.; Olson, S.; Marois, J. The Influence of Bahiagrass, Tillage, and Cover Crops on Organic Vegetable Production and Soil Quality in the Southern Coastal Plain. Sustain. Agric. Res. 2016, 5, 65. [CrossRef] Morgan, R.P. Soil Erosion and Conservation; Longman Science & Technical: Hoboken, NJ, USA, 1995. Govers, G.; Poesen, J.; Goossens, D.; Christensen, B.T. Soil erosion-processes, damages and countermeasures. In Managing Soil Quality, Challenges in Modern Agriculture; Schjønning, P., Elmholt, S., Christensen, B.T., Eds.; Institute of Agricultural Sciences: Tjele, Denmark, 2004; pp. 199–217. Wiman, M.R.; Kirby, E.M.; Granatstein, D.M.; Sullivan, T. Cover crops influence meadow vole presence in organic orchards. HortTechnology 2009, 19, 558–562. Quemada, M.; Baranski, M.; Nobel-de Lange, M.N.J.; Vallejo, A.; Cooper, J.M. Meta-analysis of strategies to control nitrate leaching in irrigated agricultural systems and their effects on crop yield. Agric. Ecosyst. Environ. 2013, 174, 1–10. [CrossRef] Khan, S.A.; Mulvaney, R.L.; Ellsworth, T.R.; Boast, C.W. The myth of nitrogen fertilization for soil carbon sequestration. J. Environ. Qual. 2007, 36, 1821–1832. [CrossRef] [PubMed] Jensen, E.S.; Peoples, M.B.; Hauggaard-Nielsen, H. Faba bean in cropping systems. Field Crops Res. 2010, 115, 203–216. [CrossRef] Li, X.; Hu, C.; Delgado, J.A.; Zhang, Y.; Ouyang, Z. Increased nitrogen use efficiencies as a key mitigation alternative to reduce nitrate leaching in north china plain. Agric. Water Manag. 2007, 89, 137–147. [CrossRef] Thorup-Kristensen, K. Utilising differences in rooting depth to design vegetable crop rotations with high nitrogen use efficiency (NUE). In Proceedings of the Workshop Towards and Ecologically Sound Fertilisation in Field Vegetable Production, Wageningen, The Netherlands, 11–14 September 2000; Volume 571, pp. 249–254. Asghari, H.R.; Cavagnaro, T.R. Arbuscular mycorrhizas reduce nitrogen loss via leaching. PLoS ONE 2012, 7, e29825. [CrossRef] [PubMed] Syvertsen, J.P.; Smith, L.M. Nitrogen leaching, N uptake efficiency and water use from citrus trees fertilized at three N. Proc. Fla. State Hort. Soc. 1995, 108, 151–155. Shang, F.; Ren, S.; Yang, P.; Chi, Y.; Xue, Y. Effects of Different Irrigation Water Types, N Fertilizer Types, and Soil Moisture Contents on N2 O Emissions and N Fertilizer Transformations in Soils. Water Air Soil Pollut. 2016, 227, 225. [CrossRef] Allen, R.G.; Pereira, L.S.; Raes, D.; Smith, M. Crop Evapotranspiration-Guidelines for Computing Crop Water Requirements; FAO Irrigation and Drainage Paper 56; FAO: Rome, Italy, 1998. Keller, J.; Bliesner, R.D. Sprinkle and Trickle Irrigation; The Blackburn Press: Caldwel, NJ, USA, 1990; p. 652. Thompson, R.B.; Gallardo, M.; Valdez, L.C.; Fernández, M.D. Using plant water status to define threshold values for irrigation management of vegetable crops using soil moisture sensors. Agric. Water Manag. 2007, 88, 147–158. [CrossRef]
Horticulturae 2017, 3, 25
99.
100.
101.
102. 103. 104. 105.
106.
107.
108. 109.
110. 111. 112. 113.
114. 115. 116. 117. 118.
119. 120.
21 of 23
Granados, M.R.; Thompson, R.B.; Fernández, M.D.; Martínez-Gaitán, C.; Gallardo, M. Prescriptive–corrective nitrogen and irrigation management of fertigated and drip-irrigated vegetable crops using modeling and monitoring approaches. Agric. Water Manag. 2013, 119, 121–134. [CrossRef] Rekika, D.; Caron, J.; Rancourt, G.T.; Lafond, J.A.; Gumiere, S.J.; Jenni, S.; Gosselin, A. Optimal irrigation for onion and celery production and spinach seed germination in Histosols. Agron. J. 2014, 106, 981–994. [CrossRef] Létourneau, G.; Caron, J.; Anderson, L.; Cormier, J. Matric potential-based irrigation management of field-grown strawberry: Effects on yield and water use efficiency. Agric. Water Manag. 2015, 161, 102–113. [CrossRef] Rahil, M.H.; Qanadillo, A. Effects of different irrigation regimes on yield and water use efficiency of cucumber crop. Agric. Water Manag. 2015, 148, 10–15. [CrossRef] Berrie, A.; Ellerker, B.; Lower, K. Evaluation of alternative treatments to urea to eliminate leaf litter in organic apple production. IOBC/WPRS Bull. 2006, 29, 139. Mitre, V.; Mitre, J.; Sestras, A.; Petrisor, P.; Sestras, R.E. Reducing primary inoculum of apple scab using foliar application of urea in autumn. Bull. UASVM Hortic. 2012, 69, 415–416. Rochette, P.; Angers, D.A.; Chantigny, M.H.; Gasser, M.O.; MacDonald, J.D.; Pelster, D.E.; Bertrand, N. Ammonia volatilization and nitrogen retention: How deep to incorporate urea? J. Environ. Qual. 2013, 42, 1635–1642. [CrossRef] [PubMed] Black, A.S.; Sherlock, R.R.; Smith, N.P.; Cameron, K.C.; Goh, K.M. Effects of form of nitrogen, season, and urea application rate on ammonia volatilisation from pastures. N. Z. J. Agric. Res. 1985, 28, 469–474. [CrossRef] Sanz-Cobena, A.; Misselbrook, T.H.; Arce, A.; Mingot, J.I.; Diez, J.A.; Vallejo, A. An inhibitor of urease activity effectively reduces ammonia emissions from soil treated with urea under Mediterranean conditions. Agric. Ecosyst. Environ. 2008, 126, 243–249. [CrossRef] Neto, C.; Carranca, C.; Clemente, J.; de Varennes, A. Nitrogen distribution, remobilization and re-cycling in young orchard of non-bearing ‘Rocha’ pear trees. Sci. Hortic. 2008, 118, 299–307. [CrossRef] Shan, L.; He, Y.; Chen, J.; Huang, Q.; Wang, H. Ammonia volatilization from a Chinese cabbage field under different nitrogen treatments in the Taihu Lake Basin, China. J. Environ. Sci. 2015, 38, 14–23. [CrossRef] [PubMed] Chambers, B.; Dampney, P. Nitrogen Efficiency and Ammonia Emissions from Urea-Based and Ammonium Nitrate Fertilisers; The International Fertiliser Society: Colchester, UK, 2009; p. 657. Riches, D.; Mattner, S.; Davies, R.; Porter, I. Mitigation of nitrous oxide emissions with nitrification inhibitors in temperate vegetable cropping in southern Australia. Soil Res. 2016, 54, 533–543. [CrossRef] Lam, S.K.; Suter, H.; Mosier, A.R.; Chen, D. Using nitrification inhibitors to mitigate agricultural N2 O emission: A double-edged sword? Glob. Chang. Biol. 2016, 23, 485–489. [CrossRef] [PubMed] Shehata, S.M.; Abdel-Azem, H.S.; El-Yazied, A.A.; Abou, A.; El-Gizawy, A.M. Effect of foliar spraying with amino acids and seaweed extract on growth chemical constitutes, yield and its quality of celeriac plant. Eur. J. Sci. Res. 2011, 58, 257–265. Elwell, D.L.; Keener, H.M.; Carey, D.S.; Schlak, P.P. Composting unamended chicken manure. Compost. Sci. Util. 1998, 6, 22–35. [CrossRef] Van Kessel, J.S.; Reeves, J. Nitrogen mineralization potential of dairy manures and its relationship to composition. Biol. Fertil. Soils 2002, 36, 118–123. [CrossRef] Chambers, B.J.; Smith, K.A.; Pain, B.F. Strategies to encourage better use of nitrogen in animal manures. Soil Use Manag. 2000, 16, 157–166. [CrossRef] Heinrich, A.L.; Pettygrove, G.S. Influence of dissolved carbon and nitrogen on mineralization of dilute liquid dairy manure. Soil Sci. Soc. Am. J. 2012, 76, 700–709. [CrossRef] Schepers, J.S.; Mosier, A.R. Accounting for nitrogen in nonequilibrium soil-crop systems. In Managing Nitrogen for Groundwater Quality and Farm Profitability; Soil Science Society of America: Fitchburg, WI, USA, 1991; pp. 125–138. Farneselli, M.; Tei, F.; Simonne, E. Reliability of petiole sap test for N nutritional status assessing in processing tomato. J. Plant Nutr. 2014, 37, 270–278. [CrossRef] Parry, C.; Blonquist, J.; Bugbee, B. In situ measurement of leaf chlorophyll concentration: Analysis of the optical/absolute relationship. Plant Cell Environ. 2014, 37, 2508–2520. [CrossRef] [PubMed]
Horticulturae 2017, 3, 25
22 of 23
121. Padilla, F.M.; Peña-Fleitas, M.T.; Gallardo, M.; Thompson, R.B. Threshold values of canopy reflectance indices and chlorophyll meter readings for optimal nitrogen nutrition of tomato. Ann. Appl. Biol. 2015, 166, 271–285. [CrossRef] 122. Lord, E.I.; Anthony, S.G.; Goodlass, G. Agricultural nitrogen balance and water quality in the UK. Soil Use Manag. 2002, 18, 363–369. [CrossRef] 123. Harris, G.; Heathwaite, A.L. Inadmissible evidence: Knowledge and prediction in land and riverscapes. J. Hydrol. 2005, 304, 3–19. [CrossRef] 124. Thompson, R.B.; Martínez-Gaitan, C.; Gallardo, M.; Giménez, C.; Fernández, M.D. Identification of irrigation and N management practices that contribute to nitrate leaching loss from an intensive vegetable production system by use of a comprehensive survey. Agric. Water Manag. 2007, 89, 261–274. [CrossRef] 125. HongYeng, L.; Agamuthu, P. Nitrogen flow in organic and conventional vegetable farming systems: A case study of Malaysia. Nutr. Cycl. Agroecosyst. 2015, 103, 131–151. [CrossRef] 126. Oborn, I.; Edwards, A.C.; Witter, E.; Oenema, O.; Ivarsson, K.; Withers, P.J.A.L.; Nilsson, S.I.; Stinzing, A.R. Element balances as a tool for sustainable nutrient management: A critical appraisal of their merits and limitations within an agronomic and environmental context. Eur. J. Agron. 2003, 20, 211–225. [CrossRef] 127. Bechmann, M.; Eggestad, H.O.; Vagstad, N. Nitrogen balances and leaching in four agricultural catchments in southeastern Norway. Environ. Pollut. 1998, 102, 493–499. [CrossRef] 128. Oenema, O.; Kros, H.; de Vries, W. Approaches and uncertainties in nutrient budgets: Implications for nutrient management and environmental policies. Eur. J. Agron. 2003, 20, 3–16. [CrossRef] 129. Ding, X.; Shen, Z.; Hong, Q.; Yang, Z.; Wu, X.; Liu, R. Development and test of the export coefficient model in the upper reach of the Yangtze River. J. Hydrol. 2010, 383, 233–244. [CrossRef] 130. Brisson, N.; Gary, C.; Justes, E.; Roche, R.; Mary, B.; Ripoche, D.; Zimmer, D.; Sierra, J.; Bertuzzi, P.; Burger, P.; et al. An overview of the crop model STICS. Eur. J. Agron. 2003, 18, 309–332. 131. Zhang, Y.; Niu, H.; Wang, S.; Xu, K.; Wang, R. Application of the DNDC model to estimate N2 O emissions under different types of irrigation in vineyards in Ningxia, China. Agric. Water Manag. 2016, 163, 295–304. [CrossRef] 132. Uzoma, K.C.; Smith, W.; Grant, B.; Desjardins, R.L.; Gao, X.; Hanis, K.; Tenuta, M.; Goglio, P.; Li, C. Assessing the effects of agricultural management on nitrous oxide emissions using flux measurements and the DNDC model. Agric. Ecosyst. Environ. 2015, 206, 71–83. [CrossRef] 133. Rahn, C.R.; Zang, K.; Lillywhite, R.D.; Ramos, C.; De Paz, J.M.; Doltra, J.; Riley, H.; Fink, M.; Nendel, C.; Thorup-Kristensen, K.; et al. Development of a Model Based Decision Support System to Optimise Nitrogen Use in Horticultural Crop Rotations Across Europe—EU-ROTATE N; Final Scientific Report QLK5–2002–01100; Horticulture Research International: Wellesbourne, UK, 2007. 134. Nendel, C.; Venezia, A.; Piro, F.; Ren, T.; Lillywhite, R.D.; Rahn, C.R. The performance of the EU-Rotate-N model in predicting the growth and nitrogen uptake of rotations of field vegetable crops in a Mediterranean environment. J. Agric. Sci. 2013, 151, 538–555. [CrossRef] 135. Bakhsh, A.; Kanwar, R.S.; Jaynes, D.B.; Colvin, T.S.; Ahuja, L.R. Simulating effects of variable nitrogen application rates on corn yields and NO3 –N losses in subsurface drain water. Trans. ASAE. 2001, 44, 269. [CrossRef] 136. Fang, Q.X.; Ma, L.; Halvorson, A.D.; Malone, R.W.; Ahuja, L.R.; Del Grosso, S.J.; Hatfield, J.L. Evaluating four nitrous oxide emission algorithms in response to N rate on an irrigated corn field. Environ. Model. Softw. 2015, 72, 56–70. [CrossRef] 137. Cameira, M.R.; Tedesco, S.; Leitão, T.E. Water and nitrogen budgets under different production systems in Lisbon urban farming. Biosys. Eng. 2014, 125, 65–79. [CrossRef] 138. Chaplot, V.; Saleh, A.; Jaynes, D.B.; Arnold, J. Predicting water, sediment and NO3 -N loads under scenarios of land-use and management practices in a flat watershed. Water Air Soil Pollut. 2004, 154, 271–293. [CrossRef] 139. Santhi, C.; Srinivasan, R.; Arnold, J.G.; Williams, J.R. A modeling approach to evaluate the impacts of water quality management plans implemented in a watershed in Texas. Environ. Model. Softw. 2006, 21, 1141–1157. [CrossRef] 140. Arabi, M.; Frankenberger, J.R.; Engel, B.A.; Arnold, J. Representation of agricultural conservation practices with SWAT. Hydrol. Process. 2008, 22, 3042–3055. [CrossRef]
Horticulturae 2017, 3, 25
23 of 23
141. Giménez, C.; Gallardo, M.; Martínez-Gaitán, C.; Stöckle, C.O.; Thompson, R.B.; Granados, M.R. VegSyst, a simulation model of daily crop growth, nitrogen uptake and evapotranspiration for pepper crops for use in an on-farm decision support system. Irrig. Sci. 2013, 31, 465–477. [CrossRef] 142. Gallardo, M.; Thompson, R.B.; Giménez, C.; Padilla, F.M.; Stöckle, C.O. Prototype decision support system based on the VegSyst simulation model to calculate crop N and water requirements for tomato under plastic cover. Irrig. Sci. 2014, 32, 237–253. [CrossRef] 143. Gallardo, M.; Fernández, M.D.; Giménez, C.; Padilla, F.M.; Thompson, R.B. Revised VegSyst model to calculate dry matter production, critical N uptake and ET of several vegetable species grown in Mediterranean greenhouses. Agric. Syst. 2016, 146, 30–43. [CrossRef] © 2017 by the authors. Licensee MDPI, Basel, Switzerland. This article is an open access article distributed under the terms and conditions of the Creative Commons Attribution (CC BY) license (http://creativecommons.org/licenses/by/4.0/).