Md. Zia Ur Rahman, Rafi Ahamad Shaik & D V Rama Koti Reddy
Noise Cancellation in ECG Signals using Computationally Simplified Adaptive Filtering Techniques: Application to Biotelemetry Md. Zia Ur Rahman
[email protected]
Department of Electronics and Communication Engg. Narasaraopeta Engg. College Narasaraopet, 522601, India
Rafi Ahamed Shaik
[email protected]
Department of Electronics and Communication Engg. Indian Institute of Technology Guwahati, 781039, India
D V Rama Koti Reddy
[email protected]
Department of Instrumentation Engineering College of Engineering, Andhra University Visakhapatnam, 530003, India
Abstract
Several signed LMS based adaptive filters, which are computationally superior having multiplier free weight update loops are proposed for noise cancellation in the ECG signal. The adaptive filters essentially minimizes the mean-squared error between a primary input, which is the noisy ECG, and a reference input, which is either noise that is correlated in some way with the noise in the primary input or a signal that is correlated only with ECG in the primary input. Different filter structures are presented to eliminate the diverse forms of noise: 60Hz power line interference, baseline wander, muscle noise and the motion artifact. Finally, we have applied these algorithms on real ECG signals obtained from the MIT-BIH data base and compared their performance with the conventional LMS algorithm. The results show that the performance of the signed regressor LMS algorithm is superior than conventional LMS algorithm, the performance of signed LMS and sign-sign LMS based realizations are comparable to that of the LMS based filtering techniques in terms of signal to noise ratio and computational complexity. Keywords: Adaptive filtering, Artifact, ECG, LMS algorithm, Noise cancellation.
1. INTRODUCTION The extraction of high-resolution ECG signals from recordings contaminated with back ground noise is an important issue to investigate. The goal for ECG signal enhancement is to separate the valid signal components from the undesired artifacts, so as to present an ECG that facilitates
Signal Processing: An International Journal (SPIJ) Volume (3) : Issue (5)
120
Md. Zia Ur Rahman, Rafi Ahamad Shaik & D V Rama Koti Reddy
easy and accurate interpretation. Many approaches have been reported in the literature to address ECG enhancement [2]-[5]. In recent years, adaptive filtering has become one of the effective and popular approaches for the processing and analysis of the ECG and other biomedical signals. Adaptive filters permit to detect time varying potentials and to track the dynamic variations of the signals. Besides, they modify their behavior according to the input signal. Therefore, they can detect shape variations in the ensemble and thus they can obtain a better signal estimation. Several papers have been presented in the area of biomedical signal processing where an adaptive solution based on the LMS algorithm is suggested [5]-[8]. The fundamental principles of adaptive filtering for noise cancelation were described by Widrow et al. [1]. Thakor and Zhu [5] proposed an adaptive recurrent filter to acquire the impulse response of normal QRS complexes, and then applied it for arrhythmia detection in ambulatory ECG recordings. The reference inputs to the LMS algorithm are deterministic functions and are defined by a periodically extended, truncated set of orthonormal basis functions. In these papers, the LMS algorithm operates on an "instantaneous" basis such that the estimate. In a recent study, however, a steady state convergence analysis for the LMS algorithm with deterministic reference inputs showed that the steady-state weight vector is biased, and thus, the adaptive estimate does not approach the Wiener solution. To handle this drawback another strategy was considered for estimating the coefficients of the linear expansion, namely, the block LMS (BLMS) algorithm [7], in which the coefficient vector is updated only once every occurrence based on a block gradient estimation. A major advantage of the block, or the transform domain LMS algorithm is that the input signals are approximately uncorrelated. Complexity reduction of the noise cancellation system, particularly in applications such as wireless biotelemetry system has remained a topic of intense research. This is because of the fact that with increase in the ECG data transmission rate, the channel impulse response length increases and thus the order of the filter increases. Thus far, to the best of our knowledge, no effort has been made to reduce the computational complexity of the adaptive algorithm without affecting the signal quality. In order to achieve this, we considered the sign based adaptive algorithms. These algorithms enjoy less computational complexity because of the sign present in the algorithm. In the literature, there exist three versions of the signed LMS algorithm, namely, the signed regressor algorithm, the sign algorithm and the sign-sign algorithm. All these three require only half as many multiplications as in the LMS algorithm, thus making them attractive from practical implementation point of view [9]-[11]. In this paper, we considered the problem of noise cancellation and arrhythmia detection in ECG by effectively modifying and extending the framework of [5]. For that, we carried out simulations on MIT-BIH database. The simulation results shows that the performances of the sign based algorithms are comparable with LMS counterpart to eliminate the noise from ECG signals.
2. PROPOSED IMPLEMENTATION When the doctors are examining the patient on-line and want to review the ECG of the patient in real-time, there is a good chance that the ECG signal has been contaminated by noise. The predominant artifacts present in the ECG includes: Power-line Interference (PLI), Baseline wander (BW), Muscle artifacts (MA) and Motion artifacts (EM), mainly caused by patient breathing, movement, power line interference, bad electrodes and improper electrode site preparation. The low frequency ST segments of ECG signals are strongly affected by these contaminations, which lead to false diagnosis. To allow doctors to view the best signal that can be obtained, we need to develop an adaptive filter to remove the noise in order to better obtain and interpret the ECG data.
Signal Processing: An International Journal (SPIJ) Volume (3) : Issue (5)
121
Md. Zia Ur Rahman, Rafi Ahamad Shaik & D V Rama Koti Reddy
2.1 Basic Adaptive Filtering Structure Figure 1 shows an adaptive filter with a primary input that is an ECG signal s1 with additive noise n1. While the reference input is noise n2, possibly recorded from another generator of noise n2 that is correlated in some way with n1. If the filter output is y and the filter error e= (s1+n1)-y, then 2 2 2 = (s1 + n1) – 2y (s1 + n1) + y 2 2 = (n1 – y) + s1 + 2 s1 n1 – 2y s1. (1) Since the signal and noise are uncorrelated, the mean-squared error (MSE) is 2 2 2 E[e ]=E[(n1 – y) ]+E[s1 ] (2) Minimizing the MSE results in a filter error output that is the best least-squares estimate of the signal s1. The adaptive filter extracts the signal, or eliminates the noise, by iteratively minimizing the MSE between the primary and the reference inputs.
FIGURE 1: Adaptive Filter Structure.
FIGURE 2: Alternate Adaptive Filter Structure.
Figure 2 illustrates another situation where the ECG is recorded from several electrode leads. The primary input s1 + n1 is a signal from one the leads. A reference signal s2 is obtained from a second lead that is noise free. The signal s1 can be extracted by minimizing the MSE between the primary and the reference inputs. Generally in biomedical signal processing the filter structure
Signal Processing: An International Journal (SPIJ) Volume (3) : Issue (5)
122
Md. Zia Ur Rahman, Rafi Ahamad Shaik & D V Rama Koti Reddy
shown in figure 1 is used, since it is difficult to obtain a noise free signal. Using the same procedure similar to (1) we can show that 2 2 2 E[e ]=E[(s1 – y) ]+E[n1 ] (3) Minimizing the MSE results in a filter error output y that is the best least-squares estimate of the signal s1. 2.2 Simplified Adaptive Algorithms The LMS algorithm is a method to estimate gradient vector with instantaneous value. It changes the filter tap weights so that e(n) is minimized in the mean-square sense. The conventional LMS algorithm is a stochastic implementation of the steepest descent algorithm. It simply replaces the 2 cost function ξ(n) = E[e (n)] by its instantaneous coarse estimate. The error estimation e(n) is e(n) = d(n) – w(n) Φ(n) (4) Coefficient updating equation is w(n+1) = w(n) + µ Φ(n) e(n), (5) Where µ is an appropriate step size to be chosen as 0 < µ < ( 2 / tr R ) for the convergence of the algorithm. The most important members of simplified LMS algorithms are: The Signed-Regressor Algorithm (SRLMS): The signed regressor algorithm is obtained from the conventional LMS recursion by replacing the tap-input vector x(n) with the vector sgn{x(n)}. Consider a signed regressor LMS based adaptive filter that processes an input signal x(n) and generates the output y(n) as per the following: t (6) y(n) = w (n)x(n), t where, w(n) = [ w0(n), w1(n), … , wL-1(n) ] is a L-th order adaptive filter. The adaptive filter coefficients are updated by the Signed-regressor LMS algorithm as, w(n+1) = w(n) + µ sgn{Φ(n)}e(n), (7) Because of the replacement of Φ(n) by its sign, implementation of this recursion may be cheaper than the conventional LMS recursion, especially in high speed applications such as biotelemetry these types of recursions may be necessary. The Sign Algorithm (SLMS): This algorithm is obtained from conventional LMS recursion by replacing e(n) by its sign. This leads to the following recursion: w(n+1) = w(n) + µ Φ(n) sgn{e(n)}, (8) The Sign – Sign Algorithm (SSLMS): This can be obtained by combining signed-regressor and sign recursions, resulting in the following recursion: w(n+1) = w(n) + µ sgn{Φ(n)} sgn{e(n)},
(9)
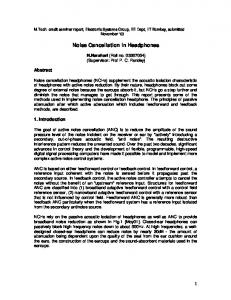
where sgn{ . } is well known signum function, e(n) = d(n) – y(n) is the error signal. The sequence d(n) is the so-called desired response available during initial training period. The performance of these algorithms compared from the convergence characteristics shown in figure 3. From the convergence curves it is clear that the performance of the signed-regressor algorithm is only slightly worse than the conventional LMS algorithm. However the sign and sign – sign algorithms are both slower than the LMS algorithm. Their convergence behavior is also rather peculiar. They converge very slowly at the beginning, but speed up as the MSE level drops.
Signal Processing: An International Journal (SPIJ) Volume (3) : Issue (5)
123
Md. Zia Ur Rahman, Rafi Ahamad Shaik & D V Rama Koti Reddy
Convergence curve of the SRLMS 20
10
15 MSE
Convergence curve of the LMS
MSE
15
5 0
5 0
0
1000 2000 3000 4000 Number of iterations Convergence curve of the SLMS
30
1000 2000 3000 4000 Number of iterations Convergence curve of the SSLMS 35
25
30 MSE
MSE
-5
10
20
15
0
1000 2000 3000 Number of iterations
4000
0
25
20
0
1000 2000 3000 Number of iterations
4000
FIGURE 3: Convergence Characteristics of various algorithms
2.3 Noise Generator The reference signal n2 shown in figure 1 is taken from noise generator. A synthetic PLI with 1mv amplitude is simulated for PLI cancellation. No harmonics are synthesized. In order to test the filtering capability in non-stationary environment we have considered real BW, MA and EM noises. These are taken from MIT-BIH Normal Sinus Rhythm Database (NSTDB). This database was recorded at a sampling rate of 128Hz from 18 subjects with no significant arrhythmias. A random noise with variance of 0.001 is added to the ECG signals to evaluate the performance of the algorithm. The input SNR for the above non-stationary noise is taken as 1.25dB. In these three simplified algorithms because of the sign present in the recursion some tiny noise remains along the ST segment of the ECG signal. In order to extract the residual noise a tiny PLI is added to the noise reference signal. This improvers the performance of the filter. 2.4 Computational Complexity Issues The computational complexity figures required to compute all the three versions of sign LMS, as proposed above are summarized in Table 1, offers significant reduction in the number of operations required for LMS algorithm. Further, as these sign based algorithms are largely free from multiplication operation, these algorithms provides elegant means for removing the noise from the ECG signals. For LMS algorithm L+1 multiplications and L+1 additions are required to compute the weight update equation (5). In case of signed regressor algorithm only one multiplication is required to compute µe(n). Where as other two signed LMS algorithms does not require multiplication if we choose µ value a power of 2. In these cases multiplication becomes shift operation which is less complex in practical realizations.
Signal Processing: An International Journal (SPIJ) Volume (3) : Issue (5)
124
Md. Zia Ur Rahman, Rafi Ahamad Shaik & D V Rama Koti Reddy
Algorithm
Multiplications
Additions
LMS SRLMS SLMS SSLMS
L+1 1 Nil Nil
L+1 L+1 L+1 L+1
Shifts Nil Nil L Nil
TABLE 1: A Computational Complexity Comparison Table. . .
3. SIMULATION RESULTS To show that signed LMS algorithms are appropriate for ECG denoising we have used real ECG signals. We used the benchmark MIT-BIH arrhythmia database ECG recordings as the reference for our work. The data base consists of 48 half hour excerpts of two channel ambulatory ECG recordings, which were obtained from 47 subjects, including 25 men aged 32-89 years, and women aged 23-89 years. The recordings were digitized at 360 samples per second per channel with 11-bit resolution over a 10 mV range. In our simulation, first we collected 4000 samples of ECG signal. In this simulation µ for all the filters is chosen as 0.001 and the filter length as 5. For all the figures in this section number of samples is taken on x-axis and amplitude on y-axis, unless stated. Figure 4 shows the clean ECG signal (data105) and its frequency spectrum. In our experiments we have considered a dataset of five ECG records: data100, data105, data108, data203 and data228 to ensure the consistency of the results
Amplitude
2 1 0 -1
0
500
1000
1500
2000 Samples (a)
2500
3000
3500
4000
Magnitude(dB)
0 -20 -40 -60 -80 10
20
30
40 50 60 Frequency in Hz (b)
70
80
90
100
FIGURE 4: Clean ECG signal (data105) and its Spectrum.
3.1 Adaptive Power-line Interference (PLI) Cancellation In this experiment, first we collected 4000 samples of ECG signal and corrupted with synthetic PLI with frequency 60Hz, sampled at 200Hz. This signal is applied as primary input to the adaptive filter shown in figure 1. The experiment is performed over the dataset average SNR improvement is considered to compare the performance of the algorithms. The reference signal is a synthesized PLI, the output of the filter is recovered signal. These results for data105 are shown in figure 5. Table 2 shows the SNR improvement for the dataset. In SNR measurements it is found that signed-regressor LMS algorithm gets average SNR improvement 29.5441dB, sign LMS gets 22.5405dB, sign-sign LMS improves 20.5345dB and conventional LMS algorithm
Signal Processing: An International Journal (SPIJ) Volume (3) : Issue (5)
125
Md. Zia Ur Rahman, Rafi Ahamad Shaik & D V Rama Koti Reddy
improves 31.0146dB. Figure 4 shows the power spectrum of the noisy signal before and after filtering with sign regressor LMS algorithm. The spectrum clears that the sign regressor LMS algorithm filters the PLI efficiently comparable to LMS filter with reduced number of computations.
5 0 -5
2 0 -2
2 0 -2
2 0 -2
0
500
1000
1500
2000 (a)
2500
3000
3500
4000
0
500
1000
1500
2000 (b)
2500
3000
3500
4000
0
500
1000
1500
2000 (c)
2500
3000
3500
4000
0
500
1000
1500
2000 (d)
2500
3000
3500
4000
0
500
1000
1500
2000 (e)
2500
3000
3500
4000
2 0 -2
FIGURE 5: Typical filtering results of PLI Cancelation (a) MIT-BIH record 105 with 60Hz noise, (b) recovered signal using LMS algorithm, (c) recovered signal using signed regressor LMS algorithm, (d) recovered signal using sign LMS algorithm (e) recovered signal using sign sign LMS algorithm. LMS Rec. No
100 105 108 203 228 Avg. (dBs)
SNR Before Filtering
SRLMS
SLMS
SSLMS
SNR After Filtering
SNR Imp
SNR After Filtering
SNR Imp
SNR After Filtering
SNR Imp
SNR After Filtering
SNR Imp
-2.9191 -2.6949 -3.0647 -1.4531 -3.5242
28.7206 28.5262 28.4051 27.3762 28.3893
31.6397 31.2211 31.4698 28.8293 31.9135
26.6853 26.9251 26.4778 26.8677 27.1089
29.6044 29.6200 29.5425 28.3208 30.6331
17.8050 20.3215 22.4489 18.5911 19.8804
20.7241 23.0164 25.5136 20.0442 23.4046
14.1486 18.0484 19.3579 17.1029 18.8069
18.6195 20.7433 22.4226 18.5560 22.3311
-2.7312
28.2834
31.0146
26.8129
29.5441
19.8093
22.5405
17.4929
20.5345
TABLE 2: SNR Improvement of various algorithms for PLI Cancellation
Signal Processing: An International Journal (SPIJ) Volume (3) : Issue (5)
126
Md. Zia Ur Rahman, Rafi Ahamad Shaik & D V Rama Koti Reddy
Magnitude(dB)
0
-50
-100 10
20
30
40 50 60 Frequency in Hz (a)
70
80
90
100
10
20
30
40 50 60 Frequency in Hz (b)
70
80
90
100
Magnitude(dB)
0
-50
-100
FIGURE 6: (a) Frequency spectrum of ECG with PLI, (b) Frequency spectrum after filtering with Sign regressor LMS algorithm.
3.2 Baseline Wander (BW) Reduction In this experiment, first we collected 4000 samples of ECG signal (data105) and corrupted with real baseline wander (BW of MIT-BIH NSTDB), it is used as primary input to the adaptive filter of figure 1. The algorithms are applied on entire dataset. Simulation results for data105 are shown in figure 7. For the evaluating the performance of the proposed adaptive filter structures we have measured the average SNR improvement and compared with LMS algorithm. The sign-regressor LMS algorithm gets SNR improvement 10.1255dB, sign LMS gets 6.0443dB, sign-sign LMS improves 4.9937dB and conventional LMS algorithm improves 9.7282dB. Table 3 shows the SNR improvement for the dataset. LMS Rec. No
SNR Before Filtering
100 105 108 203 228 Avg. (dBs)
SRLMS
SLMS
SSLMS
SNR After Filtering
SNR Imp
SNR After Filtering
SNR Imp
SNR After Filtering
SNR Imp
SNR After Filtering
SNR Imp
1.2500 1.2500 1.2500 1.2500 1.2500
11.1571 12.3824 11.6224 6.8122 12.9172
9.9071 11.1324 10.3724 5.5622 11.6672
11.6220 13.1645 12.1420 6.6976 12.9314
10.3720 11.9561 10.8920 5.7260 11.6814
6.7036 8.0460 7.1091 6.4628 8.1500
5.4536 6.7960 5.8591 5.2128 6.9000
6.4829 6.4677 5.8679 5.0930 7.1053
5.2329 5.4177 4.6179 3.8430 5.8553
1.2500
10.9782 9.7282
11.3115 10.1255
7.2943
6.0443
6.2033
4.9937
TABLE 3: SNR Improvement of various algorithms for Baseline wander removal
Signal Processing: An International Journal (SPIJ) Volume (3) : Issue (5)
127
Md. Zia Ur Rahman, Rafi Ahamad Shaik & D V Rama Koti Reddy
2 0 -2
2 0 -2
2 0 -2
2 0 -2
0
500
1000
1500
2000 (a)
2500
3000
3500
4000
0
500
1000
1500
2000 (b)
2500
3000
3500
4000
0
500
1000
1500
2000 (c)
2500
3000
3500
4000
0
500
1000
1500
2000 (d)
2500
3000
3500
4000
0
500
1000
1500
2000 (e)
2500
3000
3500
4000
2 0 -2
FIGURE 7: Typical filtering results of baseline wander reduction (a) MIT-BIH record 105 with real baseline wander, (b) recovered signal using LMS algorithm, (c) recovered signal using signed regressor LMS algorithm, (d) recovered signal using sign LMS algorithm, (e) recovered signal using sign sign LMS algorithm.
3.3 Muscle Artifacts (MA) Removal The MA originally had a sampling frequency of 360Hz. The original ECG signal with MA is given as input to the adaptive filter. The results of data105 are shown in figure 8. The average SNR improvement of sign-regressor LMS algorithm is 12.2192dB, sign LMS gets 7.6995 dB, sign-sign LMS improves 6.9517dB and conventional LMS algorithm improves 11.4306dB. Table 4 shows the SNR improvement for the dataset. LMS Rec. No
SNR Before Filtering
100 105 108 203 228 Avg. (dBs)
SRLMS
SLMS
SSLMS
SNR After Filtering
SNR Imp
SNR After Filtering
SNR Imp
SNR After Filtering
SNR Imp
SNR After Filtering
SNR Imp
1.2500 1.2500 1.2500 1.2500 1.2500
11.4058 12.4265 12.3752 13.8786 13.3169
10.1558 11.1765 11.1252 12.6286 12.0669
12.3791 12.9827 13.4397 15.1749 13.3698
11.1291 11.7327 12.1897 13.9249 12.1198
7.8347 8.5680 8.0919 10.0800 10.1735
6.5847 7.3180 6.8414 8.8300 8.9235
7.0363 8.2148 7.4295 9.2585 9.0695
5.7863 6.9648 6.1795 8.0085 7.8195
1.2500
12.6806 11.4306 13.4692 12.2192
8.9496
7.6995
8.2017
6.9517
TABLE 4: SNR Improvement of various algorithms for adaptive cancellation of muscle artifacts
Signal Processing: An International Journal (SPIJ) Volume (3) : Issue (5)
128
Md. Zia Ur Rahman, Rafi Ahamad Shaik & D V Rama Koti Reddy
2 0 -2
2 0 -2
2 0 -2
2 0 -2
0
500
1000
1500
2000 (a)
2500
3000
3500
4000
0
500
1000
1500
2000 (b)
2500
3000
3500
4000
0
500
1000
1500
2000 (c)
2500
3000
3500
4000
0
500
1000
1500
2000 (d)
2500
3000
3500
4000
0
500
1000
1500
2000 (e)
2500
3000
3500
4000
2 0 -2
FIGURE 8: Typical filtering results of muscle artifacts removal (a) MIT-BIH record 105 with real muscle artifacts (b) recovered signal using LMS algorithm, (c) recovered signal using signed regressor LMS algorithm, (d) recovered signal using sign LMS algorithm, (e) recovered signal using sign sign LMS algorithm.
3.4 Motion Artifacts (EM) Removal To demonstrate this we used MIT-BIH record number 105 ECG data with real electrode motion artifact (EM) added. The ECG signal corresponds to record 105 is corrupted with EM is given as input to the adaptive filter. The reference signal is taken from noise generator. The algorithms are tested for dataset. Figure 9 shows the results correspond to data105. The average SNR improvements for various algorithms are 11.8950dB, 7.2525dB, 5.7464dB and 10.3374dB for signed regressor, sign, sign-sign and LMS algorithms respectively. Table 5 shows the SNR improvement for the dataset. LMS Rec. No
SNR Before Filtering
100 105 108 203 228 Avg. (dBs)
SRLMS
SLMS
SSLMS
SNR After Filtering
SNR Imp
SNR After Filtering
SNR Imp
SNR After Filtering
SNR Imp
SNR After Filtering
SNR Imp
1.2500 1.2500 1.2500 1.2500 1.2500
11.5749 12.5709 12.4709 8.9543 12.4062
10.3249 11.3209 11.1809 7.7043 11.1562
13.3180 14.4069 14.9770 10.4778 12.5457
12.0680 13.1569 13.7270 9.2278 11.2957
7.6309 8.2145 9.0952 8.6879 8.8840
6.3809 6.9645 7.8455 7.4379 7.6340
6.4164 6.7265 7.0101 7.0210 7.8080
5.1664 5.4765 5.7601 5.7710 6.5580
1.2500
11.5954 10.3374 13.1450 11.8950
8.5025
7.2525
6.9964
5.7464
TABLE 5: SNR Improvement of various algorithms for motion artifacts Cancellation.
Signal Processing: An International Journal (SPIJ) Volume (3) : Issue (5)
129
Md. Zia Ur Rahman, Rafi Ahamad Shaik & D V Rama Koti Reddy
2 0 -2
2 0 -2
2 0 -2
2 0 -2
0
500
1000
1500
2000 (a)
2500
3000
3500
4000
0
500
1000
1500
2000 (b)
2500
3000
3500
4000
0
500
1000
1500
2000 (c)
2500
3000
3500
4000
0
500
1000
1500
2000 (d)
2500
3000
3500
4000
0
500
1000
1500
2000 (e)
2500
3000
3500
4000
2 0 -2
FIGURE 9: Typical filtering results of motion artifacts removal (a) MIT-BIH record 105 with real motion artifacts, (b) recovered signal using LMS algorithm, (c) recovered signal using signed regressor LMS algorithm, (d) recovered signal using sign LMS algorithm, (e) recovered signal using sign sign LMS algorithm.
4. CONCLUSION In this paper the problem of noise removal from ECG using Signed LMS based adaptive filtering is presented. For this, the same formats for representing the data as well as the filter coefficients as used for the LMS algorithm were chosen. As a result, the steps related to the filtering remain unchanged. The proposed treatment, however exploits the modifications in the weight update formula for all categories to its advantage and thus pushes up the speed over the respective LMS-based realizations. Our simulations, however, confirm that the corresponding show-down effect with regard to the algorithm convergence is quit minor and is acceptable for all practical purposes. From the simulation results it is clear that the signed regressor LMS algorithm performs better than LMS in both SNR improvement and computational complexity, hence it is more suitable for wireless biotelemetry ECG systems.
Signal Processing: An International Journal (SPIJ) Volume (3) : Issue (5)
130
Md. Zia Ur Rahman, Rafi Ahamad Shaik & D V Rama Koti Reddy
5. REFERENCES [1] B. Widrow, J. Glover, J. M. McCool, J. Kaunitz, C. S. Williams, R. H.Hearn, J. R. Zeidler, E. Dong, and R. Goodlin,“Adaptive noise cancelling: Principles and applications ”, Proc. IEEE, vol. 63, pp.1692-1716, Dec. 1975. [2] A. K. Barros and N. Ohnishi, ``MSE behavior of biomedical event-related filters," IEEE Trans. Biomed. Eng., vol. 44, pp. 848-855, Sept.1997. [3] O. Sayadi and M. B. Shamsollahi, ``Model-based fiducial points extraction for baseline wander electrocardiograms," IEEE Trans. Biomed. Eng., vol. 55, pp. 347-351, Jan.2008. [4] Y. Der Lin and Y. Hen Hu, ``Power-line interference detection and suppression in ECG signal processing," IEEE Trans. Biomed. Eng., vol. 55, pp. 354-357, Jan.2008. [5] N. V. Thakor and Y.-S. Zhu, ``Applications of adaptive filtering to ECG analysis: noise cancellation and arrhythmia detection," IEEE Transactions on Biomedical Engineering, vol. 38, no. 8, pp. 785-794, 1991. [6] Ziarani. A. K, Konrad. A, ``A nonlinear adaptive method of elimination of power line interference in ECG signals", IEEE Transactions on Biomedical Engineering, Vol49, No.6, pp.540-547, 2002. [7] S. Olmos , L. Sornmo and P. Laguna, ``Block adaptive filter with deterministic reference inputs for event-related signals:BLMS and BRLS," IEEE Trans. Signal Processing, vol. 50, pp. 11021112, May.2002. [8] P. Laguna, R. Jane, S. Olmos, N. V. Thakor, H. Rix, and P. Caminal, ``Adaptive estimation of QRS complex by the Hermite model for classification and ectopic beat detection," Med. Bio. Eng. Comput., vol. 34, pp. 58-68, Jan. 1996. [9] Farhang-Boroujeny, B., “Adaptive Filters- Theory and applications”, John Chichester, UK, 1998.
Wiley and Sons,
[10] E. Eweda, “ Analysis and design of a signed regressor LMS algorithm for stationary and nonstationary adaptive filterinh with correlated Gaussian data,” IEEE Transations on Circuits and Systems, Vol. 37, No.11, pp.1367-1374, 1990. [11] S. Koike, “ Analysis of Adaptive Filters using Normalized Signed Regressor LMS algorithm”, IEEE Transactions on Signal Processing, Vol. 47, No.1, pp.2710-2733, 1999.
Signal Processing: An International Journal (SPIJ) Volume (3) : Issue (5)
131