Abstractâ With the increasing deployment of computers in a wide variety of applications, the ability to detect the user's attention, or engagement, is becoming ...
ACHI 2014 : The Seventh International Conference on Advances in Computer-Human Interactions
Nonintrusive Multimodal Attention Detection Hugo Jiawei Sun, Michael Xuelin Huang, Grace Ngai and Stephen Chi Fai Chan Department of Computing The Hong Kong Polytechnic University Hong Kong S.A.R. {hugo.sun, michael.xl.huang}@connect.polyu.hk, {grace.ngai, stephen.c.chan}@comp.polyu.edu.hk Abstract— With the increasing deployment of computers in a wide variety of applications, the ability to detect the user’s attention, or engagement, is becoming more important as a key piece of contextual information in building effective interactive systems. For instance, one can imagine that a system that is aware of whether the user is attending to it would be able to adapt itself better to the user activities to enhance productivity. The ability to detect attention would also be useful for system analysis in designing and building better systems. However, much previous work in attention detection is either obtrusive or imposes demanding constraints on the context and the participants. In addition, most approaches rely on uni-modal signals, which are often limited in availability and stability. This paper attempts to address these two major limitations through a noninvasive multimodal solution, which allows participants to work naturally without interference. The solution makes use of common off-the-shelf items that could reasonably be expected of any computing environment and does not rely on expensive and tailor-made equipment. Using a three-class attention state setting, it achieves average accuracy rates of 59.63% to 77.81%; the best result being 77.81% for a general searching task, which shows 11.9% improvement over the baseline. We also analyze and discuss the contribution by individual features to different models. Keywords-Affective computing; keystroke dynamics; facial expression; multimodal recognition; attention detection
I.
INTRODUCTION
Human attention is strongly correlated with a person’s efficiency in both working and studying. Considering the pervasiveness of computers today, it makes sense to provide better interaction between users and computers by taking into account contextual information, such as location, expertise, and preference, in the development of applications [1]. However, one of the most important factors in Human Computer Interaction (HCI), the mental state of a user, has been largely ignored in real world applications. Affective computing [2] and psychophysiology represent the most important areas in HCI towards the understanding and utilization of human mental states, and there has been some work on the automatic detection and recognition of human mental states by the computer [1, 3]. Among the various mental states, it is known that attention is one of the most significant and indicative affects that affects a user’s efficiency, productivity and even creativity [4]. Recent advancements in technology have enabled more precise estimation of a human’s psychological states in the
Copyright (c) IARIA, 2014.
ISBN: 978-1-61208-325-4
form of physiological signals, which formerly could only be acquired through the use of intrusive and sometimes even invasive medical sensors. These products, such as the NeuroSky Mindset [5] and the Emotiv EPOC [6], use a headset with dry sensors to detect electroencephalogram (EEG) signals, and report the alpha and beta waves. This is a large step forward in term of convenience compared to the traditional clinical use of EEG, but these devices are still intrusive as they require a user to buy and wear them. Therefore, we believe that a truly nonintrusive approach in obtaining the attention, concentration, and engagement levels of a user is necessary and would be a contribution to the field. Previous work has explored vision-based approaches that estimate the concentration level by analyzing the facial expression of a user [7], and keystroke dynamics and mouse activities have been used to classify a user’s mental state of engagement and boredom [8]. These research works focus on attention detection through analyzing signals from a single modality. We believe that for real world applications, uni-modal attention detection approaches may be easily affected by the contextual factors and individual differences. To address this problem, we propose a multi-modal approach to detect attention level in a nonintrusive manner. Our challenge lies in the feature representation and selection of modalities. Most of the features we adopted have been proven effective in state-of-the-art research, while the rest are introduced specifically for this work. Our contributions include the introduction of useful features in attention recognition, the analysis of contributing factors of different features from distinct modalities, the evaluation of our proposed solution along the feature and temporal dimensions, and the identification of important features that are closely related to human attention states. The rest of the paper is organized as follows. Section II first presents an overview of research work in related fields, including facial expression and keystroke application. Section III describes the multimodal signal features in detail and illustrates the collection of ground truth after a short analysis on problems of existing solutions. In addition, it also illustrates the experimental setting and explains the choice of experiment tasks. Section IV follows with a performance analysis on proposed models. Results are presented and interpreted from both specific and general aspects. Based on the results, Section V discusses the findings and suggests some potential problems of the work.
192
ACHI 2014 : The Seventh International Conference on Advances in Computer-Human Interactions
Finally, the paper ends with an outline of future research direction and a brief summary in Section VI. II.
RELATED WORK
State-of-the-art affective computing research usually uses features from a wide range of areas: facial expression, vocal intonation, hand gesture, body posture, language, and physiology signals [1, 3]. Of the above, physiological signals are the most able to provide a precise measurement, but they are often intrusive, in the sense that experimental subjects are required to have different sensors, like Electrocardiogram (ECG), Electromyogram (EMG), and EEG, attached onto their bodies. On the contrary, nonintrusive approaches rely on observations of expression, gesture, posture, vocal intonation and language, which are captured by camera and microphone. Of these, relatively less attention has been paid to body posture and hand gesture, partially because it is more difficult to accurately infer affective states from these modalities, and also because there is some evidence that posture can only reflect the quantity (intensity) of the emotion, instead of its quality (category) [9]. More recently, keystroke dynamics have been investigated as a potential nonintrusive input for emotion detection [8], [10]. In this paper, we focus on detecting a user’s attention level for various tasks that commonly occur in a workplace setting. Therefore, our approach requires us to use information that can be collected in a nonintrusive approach from equipment that is available readily in a standard desktop computer. Since similar approaches have been used to detect different dimensions and categories of emotions and cognitive mental states, we believe that it is also possible to detect a user’s attention level based on these modalities in a nonintrusive manner. A. Facial expression Facial affect detection is one of the most popular approaches in affective computing. Since facial expressions are strongly correlated with emotions, especially basic emotions [11], most vision-based affect recognition research focuses on facial expression analysis [3], mostly to recognize the basic emotions [1, 3], or higher level affects (e.g., interest) and cognitive states (e.g., thinking). El Kaliouby et al. [7] use dynamic Bayesian networks to model and recognize six complex mental states, namely, agreeing, concentrating, disagreeing, interested, thinking and unsure. Lan et al. compare static and dynamic approaches to model and infer fatigue [12], taking into account environment factors (e.g., noise, temperature, and humidity), and personal physical states (e.g., sleep quality) and visual hints (e.g., head and eyelid movements). Ashraf et al. [13] and Littlewort et al. [14] attempt to infer pain from facial expressions. Subjects are required to act and feel pain by putting their hands into the icy water in the control experiments. In addition, differences in both appearance and timing between posed (simulated) and natural facial expressions have been observed.
Copyright (c) IARIA, 2014.
ISBN: 978-1-61208-325-4
B. Keystroke Emotion detection based on keystroke dynamics has a relatively short history, despite its remarkable success in authentication [15], [16]. Vizer et al. [17] detect cognitive and physical stress based on keystroke dynamic. Besides traditional keyboard event features, their method also includes linguistic features like emotive word rate, verb rate, conjunction rate, etc. Epp et al. [10] create 2-level classifiers using keystrokes to recognize 15 emotional states, among which confidence, hesitance, nervousness, relaxation, sadness and tiredness accord at least 27% accuracy better than chance. The essential keystroke features used are timing patterns of single keystrokes, digraphs and trigraphs. Bixler et al. [8] investigated 14 emotion states, based on pausing behaviors, keystroke verbosity and timing, and found that only 6 of them occur with some regularity, among which engagement and boredom rank as the most frequent states. Our proposed method distinguishes itself from the previous works in several essential aspects. First, for attention level detection, we apply multimodal features, including vision, keyboard, mouse, etc. This allows our method to take into account a wide context of the user’s environment. Second, we distill the essential features into different modalities that contribute significantly in the attention level classification. Third, we attempt to classify attention levels according to different time intervals and compare their performances. Fourth, we generalize our approach and evaluate it across dissimilar working tasks performed by different subjects. Finally, we also propose a novel feature to quantify mouse movements. III.
METHODOLOGY
Our method approaches the problem from a nonintrusive and multimodal perspective. Since we are interested in realuse scenarios, our approach assumes only equipment and peripherals that would commonly be available on computers in an office setting, and signals that can feasibly be collected via such devices. For ease of explanation, we classify our incoming signals into machine- and human-specific features. Machine-specific features include keystrokes, mouse activity, window layout, and so on, whereas human-specific features include facial expressions and head movement. As the various input devices collect data at different frequencies, the raw incoming data is aligned at the desired frequency via resampling to create a feature vector for every second. A nonparametric random forest machine learning algorithm then analyzes the features to identify indicative features. A. Keyboard features As one of the most often-used input devices in a work setting, the keyboard is one of the most indicative recorders of a user’s behavior and activity. Table I shows the different keyboard-related features used in our approach. These keyboard features make use of both statistical and grammatical information to characterize a user’s activity. They include 1) counting of key presses and 2) time intervals between presses. For example, Feature KB,
193
ACHI 2014 : The Seventh International Conference on Advances in Computer-Human Interactions
TABLE I. KEYBOARD FEATURES
Code KB BS
Description The number of key presses per second The number of Backspace and Delete key presses per second NWIS The number of words since the most recently-finished sentence NLIW The number of letters since the most recently-finished word VWIS Word input rate of the last sentence VLIW Letter input rate of the last word STD Time interval since last Space key press DTD Time interval since the last “.”, “?”, and “!” press KIDT Keyboard idle time as a general parameter reflecting overall keyboard activities, counts the total number of keyboard press each second, including letter, number, punctuation, and control keys. Feature BS measures the frequency that a user corrects a typo, which implies the user’s level of awareness, and, indirectly, the level of attention. Features NWIS and NLIW are delimited by “space” and “punctuation”, where “space” signifies the end of a word, while punctuation marks like period (“.”), question mark (“?”), and exclamation mark (“!”) indicate the end of a sentence in modern English. The assumption behind these two features is that generally, long and complex language processing requires more thinking, and these features imply language information that in turn would suggest human attention. Features STD and DTD record the time intervals between two spaces and punctuations, which are used for the calculation of word and sentence input rate together with features NWIS and NLIW. These keyboard features are highly useful especially for typing tasks. In addition, feature KIDT is introduced to characterize “idle time” on the keyboard. This feature is activated when the machine has received no key press for 1 minute. There are no conventions that clearly define idle state (i.e., how many seconds of inactivity counts as an idle state?), so this 1-minute threshold is used as a starting point and subject to further investigation. When the keyboard enters the “idle” state, it resets all other keyboard statistical features, under the assumption that they are now outdated. The data are further extracted into time frames of 5, 10 and 15 seconds as in previous approaches [8], [10], under the assumption that attention is a temporally changing state. Taking this information into consideration helps us to understand attention from a temporal aspect. In the experiments, these features are denoted with the extensions: 5, -10, and -15 (e.g., KB-5, KB-10, and KB-15).
TABLE II. MOUSE FEATURES
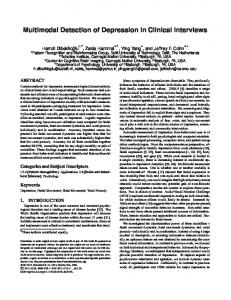
Code Description MC The number of mouse click per second MM Mouse move by pixel per second MR Mouse wheel rotation angle per second UM Unnecessary mouse movement MIDT Mouse idle time Intuitively, characterizing mouse activity might start with seeing how far the mouse has moved and how often it triggers a click. Feature MC counts the mouse click per second, while Feature MM captures the mouse move as a number of pixels. In addition to move and click, Feature MR, reflecting the rotation direction of mouse wheel, is in use when the user is browsing and reading. Since the program is able to detect direction of rotation (e.g., toward the monitor or backward to the user), this feature can reveal some interesting user behavior (e.g., disordered reading pattern). Besides the aforementioned features, we also introduce the new Unnecessary Mouse Movement (UM) feature. The rationale behind this feature is based on the assumption that users moving the mouse with a clear target in mind will normally follow the shortest path from their current location to the target point, and an observation that, often, perhaps as a nervous habit, distracted users often move the mouse around somewhat randomly, without clicking (as this would not trigger an operating system event). Unnecessary Mouse Movement is defined by the difference between 1) the actual mouse movement path (the dotted line) and 2) the shortest distance (the solid line) between the current cursor position (B) and the position of the last mouse click (A) (Figure 1). This allows us to quantify random and aimless mouse movements, which may be potential indicators of a lack of user attention. Similar to keyboard features, we extract the data by time frames of 5, 10 and 15 seconds to obtain a temporal view. C. Facial features From real-life experience, facial expressions, including head gestures, are good indicators of a person’s attention. Among the various representations of face and head features, facial action units [11] have been proven to be valuable interpretations of facial expression in both psychology and computer vision [7], [14], [18]-[20]. They are the essential representation of a facial expression – it is possible to describe all facial expressions by combining different facial action units. Furthermore, facial action unit based expression analysis is relatively robust. Once the facial landmarks are accurately identified, the values of action units will not be influenced by the variation of environmental factors, such as
B. Mouse features Other than the keyboard, much of the rest of the user input takes place through the mouse. Mouse activities include click, move and wheel rotation. Table II gives a description for each of them. Figure 1: Unnecessary Mouse Movement (UM)
Copyright (c) IARIA, 2014.
ISBN: 978-1-61208-325-4
194
ACHI 2014 : The Seventh International Conference on Advances in Computer-Human Interactions
TABLE III. FACIAL FEATURES
Code Description FF1-FF4 Inner and outer eyebrow movement FF5-6 Eyebrow movement FF7-8 Eyelid movement FF9 Upper eyelid movement FF10-11 Lip corner puller or depressor FF12 Lower lip depressor FF13 Lip pucker FF14 Lip stretcher FF15 Lip funneler FF16 Lip tightener FF17 Lip separated FF18-FF22 Head movement FF24 Eye gaze light intensity change and shadow movement. In this paper, we apply Constrained Local Models (CLM) [21] to track 66 facial landmarks. The model is trained on the CMU Multi-PIE Face database [22], which contains over 750 thousand images from 337 individuals. The CLM optimization procedure iteratively adjusts the 2D and 3D landmarks and other global and local parameters. Figure 2 shows the facial landmarks tracked by CLM and Table III presents the 24 facial features adopted in our work. The wired models indicate the 2D and 3D tracked facial landmarks, and the lengths of the green bars denote the intensities of the facial features. The facial features we used are similar to motion units [23], which describe facial movement; but are numeric in nature and represent both direction and intensity of the facial movements. Similar to previous work [24], we represent the degree of
Figure 2 Illustration of CLM face tracking results of two facial expressions (left: attentive; right: non-attentive).
a motion unit by the normalized distance between the corresponding feature points. To reduce the influence caused by head orientation, we use the 3D landmarks to calculate the features in the 3D space, which is more stable than calculating the distance features from the aligned face through the affine transformation. The five head movement features, “FF18-FF22”, capture the head scaling, orientation (pitch, yaw and roll) and position (x-axis and y-axis translation). Since the CLM model we used does not track iris movement, we extract the iris based on the integral image [24] of the region covered by the eye landmarks. The darkest sub-region in the integral image is considered to be the iris. Feature “FF24” represents the distance proportion from the pupil center to eye corners.
Copyright (c) IARIA, 2014.
ISBN: 978-1-61208-325-4
TABLE IV. MACHINE-SPECIFIC FEATURE
Code WS
Description Proportion of current active windows to desk top
D. Other features In addition to the keyboard and mouse features, we introduced another machine-specific feature: active window size (Table IV). The active window size is the proportion of size of the window relative to the whole screen. Our hypothesis is that the bigger the window size, the less likely the user would be distracted by irrelevant information on the screen. Our input features cover a diverse spectrum of the user’s activity on the computer; however, there is one obvious feature that is omitted – that being the focus of the user’s eye gaze on the screen. We had indeed considered inclusion of that feature, but it is very difficult to obtain that information accurately without the use of specialized eye-tracking equipment and/or requiring the use of wearable devices. Since this is not compatible with the assumptions and objective of our project, we made the decision not to include this as a feature. E. Ground truth collection In order to classify the incoming signals, the individual vectors need to be labeled with the “ground truth” for training and testing. Previous work has pioneered the use of the Neurosky Mindset device [27] as an off-the-shelf EEG device to provide the ground truth in an objective manner for attention detection [26]. The Mindset collects brainwave data (i.e., alpha, beta, and theta waves) [27] and also processes the raw brainwave data into integer values ranging from 0 to 100, which indicate the level of “concentration” of the user. The accuracy of the Mindset’s attention detection algorithm has been verified in previous work [27], which measured a positive correlation between the Mindset-measured and userself-reported results. Given these results and the fact that we wish to detect attention as it relates to brain activity level, e.g., the intensity of mental “focus” that occurs during intense concentration [28], we believe that the Mindset is reliable as a measure of ground truth for our work. The MindSet’s attention detection algorithm returns an integer that indicates a user’s attention level. The MindSet Instruction Manual [28] provides an interpretation that classifies the attention level into five equally divided classes of incremental attention level. We further simplify this into a three-class model dividing the range uniformly across the three classes to produce the three levels: non-attentive, neutral, and attentive. F. Machine Learning Classification The data collected for this project includes multiple signals from various channels. These features may contribute differently, depending upon the user’s context or his/her task. For example, we would hypothesize that the keyboard-based activities would be more indicative during typing tasks, but
195
ACHI 2014 : The Seventh International Conference on Advances in Computer-Human Interactions
Figure 3: Performance Changes as a Function of Time Interval
would contribute far less when the user is web browsing. Therefore, our machine learning algorithm has to be able to identify useful features among large numbers of signals and to avoid overfitting at the same time. We use the Random Forests [29] machine learning algorithm for this work. The random forest algorithm constructs multiple decision tree classifiers and aggregates the result using the mode of the output results of the individual classifiers. It is known to have several advantages: 1) it yields better accuracy than many current algorithms; 2) it can handle large number of variables; and 3) it weights importance of different features; 4) it is known to be fairly robust to overfitting; and finally, 5) it does not require unified data types in the same feature vector. G. Experimental Tasks and Setup A total of 10 participants were recruited for our experiments (5 male and 5 female, aged 22-29, 3 undergraduates and 7 graduates). All participants were proficient in using a computer running Windows 7 and read and write English fluently. They were first asked to search for academic papers relevant to their research or coursework for 30 minutes. They then spent another 30 minutes reading papers. Finally, in the last 30 minutes, they did some academic writing. The materials involved in the three tasks may or may not be relevant to each other. The three tasks were chosen because they are simplified versions of commonly-performed tasks in the office or lab space, and thus provide a realistic picture of user interaction. The tasks also represent three common modes of interactions with the computer: input-oriented, output-oriented, and hybrid, which triggers or relies on different interaction patterns: in the reading task, neither keyboard nor mouse is active, while in writing, the keyboard produces the main source of signals. Finally, the searching task expects both keyboard and mouse activities. The experimental setup was kept as close to that of a normal workplace as possible. With the exception of the Mindset, which was connected to the computer via a Bluetooth link, the rest of the experimental setup consists of equipment that would commonly be found in an office or lab setting: a desktop computer running Microsoft Windows 7 with keyboard, mouse, and webcam. H. Data logging and preprocessing The preprocessing procedure transforms the computer interaction log into the set of previously-mentioned features. The programs use windows hook to collect data and produce
Copyright (c) IARIA, 2014.
ISBN: 978-1-61208-325-4
event-based logs. A new entry is appended to the log whenever there is a key press or mouse activity on the computer. At the same time, the Mindset device returns a temporal log. The raw data is then preprocessed into features suitable for classification. Human-specific features from the video stream and machine-specific features (keyboard, mouse, etc.) from the computer log were extracted according to the re-sampling frequency, and then were aligned with the temporal readings from the Mindset. IV.
RESULTS
A total amount of 54000 seconds of responses were gathered, each participant contributing about 5400 seconds. The data from each task was preprocessed into four sets with different lengths of time frames: 5, 10 and 15 seconds, as previously mentioned. Following previous work [17], we evaluated the results using 10-fold cross-validation. The results were also compared across different feature combinations, i.e., machine-specific features alone, humanspecific features alone, and fusion of the two. We use accuracy, i.e., Correctly Classified Rate (CCR) and Kappa statistics [30] to study the classification performance. One observation that was made early on in our experiments was that the raw data collected follows a normal distribution. Given this, our three-class model for the ground truth places more than half of the data into the neutral class. This uneven distribution obviously will affect the evaluation benchmark, so we also provide a comparison between our model and the “most-frequent class” baseline to provide a fairer picture. A. Performance of specific models Table V shows our evaluation results. Our method constructs individual models for each user in each task. The mean and standard deviation of the performance by CCR are presented, and the best value along each row is bolded. The reported performances here represent the average performances over all subjects. The results, achieved from three-class models (attentive, neutral, and non-attentive), are generally appreciable. The best result reported is 77.81%, when the searching task is performed, with a moving window of 15 seconds. It is 11.90% better than the benchmark 65.91%. An inspection of our results shows that fusion of both human-specific and machine-specific features achieves better results. Almost all (11 out of 12) of the fused, multimodal models achieve the best performance for each sample set.
196
ACHI 2014 : The Seventh International Conference on Advances in Computer-Human Interactions
This bears out our hypothesis that a multimodal approach that integrates both machine-specific and human-specific features performs better than using either of the two alone. Besides feature combination, we can also analyze the performance along the dimension of window size. As the time interval increases, the classification accuracy increases as well. For example, on the reading task, using only machine-specific features, changing the window size from 1 to 15 seconds gives us an accuracy gain of 14.46%, which outranks the improvement achieved using feature combination. Generally speaking, as the window size increases from 1 to 5 seconds, the performance increases significantly, and flattens out after that (Figure 3). In our research, a moving window with time interval of 15 second yields the best result. This is consistent with previous work [8], [10], [27], which also use a 15-second time interval in data preprocessing, albeit for uni-modal models.
performed a leave-one-out evaluation on all three tasks. The model was trained and tested multiple times, each time with one feature omitted. Table VII shows the features that produced the biggest drop in accuracy when they were omitted. Both machine-and human-specific features contribute to the top 10 most contributing features. Of the mouse features, only one of them (UM – unnecessary mouse movement) makes it to the top 10. The rest are keyboard features, especially contentaware features that take linguistic information into account (e.g., letter input rate of the last word). It is also observed that most of the highest-contributing features rank highly in more than one task scenarios (highlighted in Table VII), which gives us a sense of the overall most indicative features for the general attention detection problem.
B. Performance of general models Our results so far produce a user-specific, task-specific model. In order to get a sense of how well our model would work when extrapolated to a general usage, we combined our data from all the participants to create general models for each task: reading, searching, and writing, using a 15-second time window. In addition, we also combine all data to create a universal model that is independent of the task context. Table VI presents the results, with the accuracy measured by CCR and Kappa statistics. It can be seen that again, a multimodal model using feature fusion yields the best results, and the combination of machine- and human-specific features perform better than any of the two alone in both task-specific models and the universal model. With one exception, the models achieve Kappa statistics between 0.4 and 0.6, which gives us a good support of classifier agreement. The best classification result is 77.46% (Searching task, All features considered), 12.35% above baseline. The worst case (Reading Task, Machine-specific features only) achieves a performance of 73.07%, which is still 6.61% better than baseline. To better understand the role of the different features, we
A. Findings Our results have demonstrated the feasibility of detecting user attention and engagement from their behavior and interaction with the computer, using a nonintrusive approach and deploying only standard off-the-shelf equipment. Our models have been evaluated under different task scenarios that were chosen to be representative and realistic, and achieve significant performance gain over the baseline. An analysis of our results shows that both fusing multiple features from multiple modalities and lengthening the time window for sampling contribute to performance improvement. Using 40 features, including 16 machinespecific features and 24 human-specific features, the results from the multimodal models almost always outperform the uni-modal models. A leave-one-out analysis shows that both machine- and human-specific features contribute to the classification result, which supports our hypothesis of the value of a multimodal approach. In addition to feature combination, temporal-smoothing of the data also contributes to performance. This can be understood from two aspects: on one hand, lengthening the time frame produces a smoothing effect and reduces
V.
DISCUSSION
TABLE V. PERFORMANCE OF USER-SPECIFIC, TASK-SPECIFIC MODELS
Task
Reading
Searching
Writing
Time Interval (s) 1 5 10 15 1 5 10 15 1 5 10 15
Majority Baseline (%)
All Features (%)
63.86±6.20 69.40±6.07 67.04±6.30 66.34±6.03 63.23±6.38 69.26±8.37 66.88±6.84 65.91±6.76 66.25±5.58 70.64±5.98 69.05±5.86 67.91±5.52
67.41±2.73 76.18±2.48 76.44±1.97 76.72±1.39 67.56±4.35 76.62±2.92 76.73±2.63 77.81±2.91 70.60±3.52 77.17±2.27 77.49±1.40 77.10±2.16
Machine-specific Features (%) 59.63±7.20 71.41±4.08 73.23±3.12 74.09±2.44 64.20±4.58 74.16±2.74 75.41±2.81 76.07±2.90 69.96±3.11 75.71±2.31 76.14±2.19 77.07±1.41
Human-specific Features (%) 66.73±3.52 75.17±2.17 76.55±2.22 76.67±0.87 65.65±4.44 75.65±2.81 76.18±2.23 76.80±2.26 67.81±3.15 76.02±2.17 76.63±1.52 76.91±1.67
NOTE: Numbers are averaged across all users. The best performance for each model class is bolded.
Copyright (c) IARIA, 2014.
ISBN: 978-1-61208-325-4
197
ACHI 2014 : The Seventh International Conference on Advances in Computer-Human Interactions
TABLE VI. PERFORMANCE OF GENERAL AND UNIVERSAL MODELS
Task Reading Searching Writing Universal
ANA-15 (%) 76.57 77.46 76.95 75.15
ANK-15 0.49 0.53 0.48 0.46
MNA-15 (%) 73.07 75.89 76.48 73.41
MNK-15 0.39 0.49 0.46 0.41
HNA-15 (%) 76.41 76.17 76.31 74.31
HNK-15 0.49 0.50 0.46 0.44
NOTE: AEA-15/AEK-15: All features, Even distribution, Accuracy/Kappa Statistics, in 15 seconds; CEA-15/CEK-15: Computer features; FEA-15/FEK-15: Facial features.
fluctuation of the data. Intuitively, it seems reasonable that a user’s attention at a particular point in time is not an isolated “event”, but is in fact linked to many factors, including those that occurred shortly before the current moment. B. Specific or general Our work started off by constructing user-specific and task-specific models, and then generalized to a task-specific model and then a universal model. We found several challenges to creating a truly universal model. Facial features are highly distinct and it is very difficult to generalize without substantial training data. This is especially a challenge for our approach as we rely significantly on facial features. We plan to address this weakness in the future. To a lesser extent, the variability of the tasks also hinders our efforts to create a universal model. Even though we specify the nature of the tasks, there is still substantial ambiguity present in the content. This may make it difficult to generalize our model across the same task for different users, as individual user differences, such as language ability or familiarity with the topic, will influence the result. Even so, we made an attempt to build general models and received recognizable results. Interestingly, the model that is trained on data from all the participants achieves better performance than some of individual models. This can be interpreted into two ways: 1) we are not using enough data when constructing our user- or task-specific models, and so our models suffer from robustness, and 2) even though we collected individually distinct data, the algorithm is still able to generalize across different users and tasks to create a classification with accuracy close to that of the specific models. This result implies that creating universal models has its potential regardless of task type or participants. C. Lab or field study In order to mimic the real world as much as possible, our experiments were carried out in a lab setting, with all the chatting, phone calls and discussions that usually go along with it. The tasks are based on commonly-performed jobs
and are familiar to the subjects. In other words, the subjects just need to transfer their normal tasks to the experimental computer and carry on as normal. However, even though efforts have been made to simulate a real-world environment, there are still various factors affecting the results. To begin with, the subjects are not using their own machines (the presence of the key and mouse logger would have created serious privacy issues if installed on the subjects’ personal machines), and they are also not in their “regular” environments, which may affect their engagement with the task. The need to wear the Mindset device to get the ground truth labels would also assuredly affect their performance! Therefore, we would assume a certain level of nervousness or anxiety that would perhaps not be present in a real-world setting. In the future, we plan to conduct longer-term experiments that will allow users to work on their own machines in their familiar environments. Assuming that the privacy issues can be worked out, this allows us to observe user interactions in a more realistic context, which would create a more suitable model, which would be closer to a truly generalizable model. VI.
CONCLUSION AND FUTURE WORK
We have presented a nonintrusive, multimodal method to detect and classify user attention in a realistic setting. We obtain a performance (correctly classified rate) of 77.46% using a user-general model for a searching task, 12.34% above baseline, while our universal (user-general, taskgeneral) model achieves a performance of 75.15%, which is 8.65% better than baseline. Our analysis of the results brings us to the following conclusions: (1) A multimodal approach, as in a combination of machine-specific and human-specific features, achieves better performance than a uni-modal approach; (2) for attention detection, using a longer time window (e.g., 15s) yields better results than with shorter windows, suggesting that attention is a more stable attribute that does not change rapidly with time; (3) features contribute differently under different task scenarios; and 4) it is possible to build up
TABLE VII. TOP 10 MOST CONTRIBUTING FEATURES FOR EACH TASK
Reading Searching Writing
1 NLIW FF5 NWIS
2 FF10 FF11 FF9
3 FF9 UM FF16
4 UM FF21 FF19
5 BS FF16 FF6
6 FF15 VLIW WS
7 WS NLIW KB
8 MIDT KBIDT MR
9 FF19 NWIS NLIW
10 STD FF23 FF5
NOTE: Highlighted features rank among the top 10 for more than one task.
Copyright (c) IARIA, 2014.
ISBN: 978-1-61208-325-4
198
ACHI 2014 : The Seventh International Conference on Advances in Computer-Human Interactions
general and universal models with recognizable accuracy. We believe that our approach has much potential, both in terms of providing a means through which to detect the user’s attention, as well as a novel mode of human-computer interaction. We believe that the ability to detect the user’s attention could be important in the development of a better interactive system which would be able to deduce users’ attention state and adapt itself to enhance users’ productivity. In future work, we plan to investigate more deeply the contribution of the various features, including the use of linguistic and sequential models in the keyboard and the mouse movement features. We also plan to deploy our system as input for interactive systems and applications. ACKNOWLEDGMENT This work was performed at the CHILab of the Department of Computing and partially supported by Grants #G-U898 and #PolyU-523511 from the Hong Kong Polytechnic University and the Hong Kong Research Grants Council, respectively. We thank all our experiment subjects for their time and patience. REFERENCES [1]
[2] [3]
[4]
[5] [6] [7]
[8]
[9]
[10]
[11]
[12]
R. A. Calvo and S. D'Mello, "Affect Detection: An Interdisciplinary Review of Models, Methods, and Their Applications," IEEE Transactions On Affective Computing, vol. 1, 2010, pp. 18-37. R. W. Picard, Affective Computing. Cambridge, Mass: MIT Press, 1997. Z. Zeng, M. Pantic, G. I. Roisman, and T. S. Huang, "A Survey of Affect Recognition Methods: Audio, Visual, and Spontaneous Expressions," IEEE Transactions On Pattern Analysis and Machine Intelligence, vol. 31, 2009, pp. 39-58. P. Howard-Jones and S. Murray, "Ideational Productivity, Focus of Attention, and Context," Creativity Research Journal, vol. 15, 07/01; 2013/10, 2003, pp. 153-166. Neurosky (2013). NeuroSky - MindSet. Retrieved: Jan 2014. Available: http://www.neurosky.com/products/mindset.aspx. Emotiv (2013). Emotiv|EEG System|Electroencephalography. Retrieved: Jan 2014. Available: http://emotiv.com/. R. El Kaliouby and P. Robinson, "Real-time inference of complex mental states from facial expressions and head gestures," Conf. On Computer Vision and Pattern Recognition Workshop, 2004. CVPRW '04. 2004, pp. 154-154. R. Bixler and S. D'Mello, "Detecting boredom and engagement during writing with keystroke analysis, task appraisals, and stable traits," in Procs of the 2013 Int'l Conf on Intelligent User Interfaces, Santa Monica, CA, USA, 2013, pp. 225-234. P. Ekman and W. V. Friesen, "Detecting deception from the body or face," J. Pers. Soc. Psychol., vol. 29, 1974, pp. 288-298. C. Epp, M. Lippold, and R. L. Mandryk, "Identifying emotional states using keystroke dynamics," in Proceedings of the SIGCHI Conference on Human Factors in Computing Systems, Vancouver, BC, Canada, 2011, pp. 715-724. P. Ekman and W. Friesen, Facial Action Coding System: A Technique for the Measurement of Facial Movement. Palo Alto: Consulting Psychologists Press, 1978. Qiang Ji, P. Lan, and C. Looney, "A probabilistic framework for modeling and real-time monitoring human fatigue," IEEE
Copyright (c) IARIA, 2014.
ISBN: 978-1-61208-325-4
[13]
[14]
[15]
[16]
[17]
[18]
[19]
[20]
[21]
[22]
[23]
[24]
[25]
[26]
[27]
[28] [29] [30]
Transactions On Systems, Man and Cybernetics, Part A: Systems and Humans, vol. 36, 2006, pp. 862-875. A. B. Ashraf et al., "The painful face – Pain expression recognition using active appearance models," Image Vision Comput., vol. 27, 11, 2009, pp. 1788-1796. G. C. Littlewort, M. S. Bartlett, and K. Lee, "Faces of pain: Automated measurement of spontaneousallfacial expressions of genuine and posed pain," in Procs of the 9th Int'l Conf on Multimodal Interfaces, Nagoya, Aichi, Japan, 2007, pp.15-21. O. Hamdy and Traor\'e Issa, "Homogeneous physiobehavioral visual and mouse-based biometric," ACM Trans.Comput.-Hum.Interact., v18, Aug 2011, pp. 12:112:30. M. Karnan, M. Akila, and N. Krishnaraj, "Biometric personal authentication using keystroke dynamics: A review," Applied Soft Computing, vol. 11, 3, 2011, pp. 1565-1573. L. M. Vizer, L. Zhou, and A. Sears, "Automated stress detection using keystroke and linguistic features: An exploratory study," International Journal of HumanComputer Studies, vol. 67, 10, 2009, pp. 870-886. G. Littlewort, M. S. Bartlett, I. Fasel, J. Susskind, and J. Movellan, "Dynamics of facial expression extracted automatically from video," in Conference On Computer Vision and Pattern Recognition Workshop, 2004. CVPRW '04. 2004, pp. 80-80. D. McDuff, R. El Kaliouby, K. Kassam, and R. Picard, "Affect valence inference from facial action unit spectrograms," in 2010 IEEE Computer Society Conference On Computer Vision and Pattern Recognition Workshops (CVPRW), 2010, pp. 17-24. M. Pantic, "Machine Analysis of Facial Behaviour: Naturalistic and Dynamic Behaviour," Philosophical Transactions: Biological Sciences, vol. 364, Dec. 12, 2009, pp. 3505-3513. J. M. Saragih, S. Lucey, and J. F. Cohn, "Face alignment through subspace constrained mean-shifts," in 2009 IEEE 12th Int'l Conf On Computer Vision, 2009, pp. 1034-1041. R. Gross, I. Matthews, J. Cohn, T. Kanade, and S. Baker, "Multi-PIE," in 8th IEEE Int'l Conference On Automatic Face & Gesture Recognition, 2008. FG '08. 2008, pp. 1-8. I. Cohen, N. Sebe, A. Garg, L. S. Chen, and T. S. Huang, "Facial expression recognition from video sequences: temporal and static modeling," Comput. Vision Image Understanding, vol. 91, 2003, pp. 160-187. Feng Zhou, F. De la Torre, and J. F. Cohn, "Unsupervised discovery of facial events," in 2010 IEEE Conference On Computer Vision and Pattern Recognition (CVPR), 2010, pp. 2574-2581. P. Viola and M. Jones, "Robust Real-Time Face Detection," International Journal of Computer Vision, vol. 57, 05/01, 2004, pp. 137-154. D. Szafir and B. Mutlu, "Pay attention!: Designing adaptive agents that monitor and improve user engagement," in Proceedings of the SIGCHI Conference on Human Factors in Computing Systems, Austin, Texas, USA, 2012, pp. 11-20. K. Crowley, A. Sliney, I. Pitt, and D. Murphy, "Evaluating a brain-computer interface to categorise human emotional response," in 2010 IEEE 10th Int'l Conference On Advanced Learning Technologies (ICALT), 2010, pp. 276-278. NeuroSky, "NeuroSky mindset instruction manual," 2009. L. Breiman, "Random Forests," Mach. Learning, vol. 45, 10/01, 2001 pp. 5-32. J. Cohen, "A Coefficient of Agreement for Nominal Scales," Educational and Psychological Measurement, vol. 20, pp. 37-46, April 01, 1960.
199