Neural decoding of treadmill walking from noninvasive electroencephalographic signals
Alessandro Presacco, Ronald Goodman, Larry Forrester and Jose Luis Contreras-Vidal J Neurophysiol 106:1875-1887, 2011. First published 13 July 2011; doi:10.1152/jn.00104.2011 You might find this additional info useful... This article cites 49 articles, 14 of which can be accessed free at: http://jn.physiology.org/content/106/4/1875.full.html#ref-list-1 Updated information and services including high resolution figures, can be found at: http://jn.physiology.org/content/106/4/1875.full.html Additional material and information about Journal of Neurophysiology can be found at: http://www.the-aps.org/publications/jn
Journal of Neurophysiology publishes original articles on the function of the nervous system. It is published 12 times a year (monthly) by the American Physiological Society, 9650 Rockville Pike, Bethesda MD 20814-3991. Copyright © 2011 by the American Physiological Society. ISSN: 0022-3077, ESSN: 1522-1598. Visit our website at http://www.the-aps.org/.
Downloaded from jn.physiology.org on October 17, 2011
This infomation is current as of October 17, 2011.
J Neurophysiol 106: 1875–1887, 2011. First published July 13, 2011; doi:10.1152/jn.00104.2011.
Neural decoding of treadmill walking from noninvasive electroencephalographic signals Alessandro Presacco,1 Ronald Goodman,5 Larry Forrester,4,5 and Jose Luis Contreras-Vidal1,2,3 1
Neural Engineering and Smart Prosthetics Research Laboratory, Department of Kinesiology, School of Public Health, Fischell Department of Bioengineering, and 3Graduate Program in Neuroscience and Cognitive Science, University of Maryland, College Park; and 4Department of Physical Therapy and Rehabilitation Science, University of Maryland School of Medicine and 5Department of Veterans Affairs Medical Center, Baltimore, Maryland
2
Submitted 7 February 2011; accepted in final form 7 July 2011
2004), whereas electrophysiological investigations demonstrate electrocortical potentials related to lower limb movements (Wieser et al. 2010), as well as a greater involvement of human cortex during steady-speed locomotion than previously thought (Gwin et al. 2010, 2011). In this regard, studies using functional near-infrared spectroscopy (fNIRS) show involvement of frontal, premotor, and supplementary motor areas during walking (Harada et al. 2009; Miyai et al. 2001; Suzuki et al. 2004, 2008). That primary sensorimotor cortices carry information about bipedal locomotion has been directly proven by the work of Nicolelis and colleagues (Fitzsimmons et al. 2009), who demonstrated that chronic recordings from ensembles of cortical neurons in primary motor (M1) and primary somatosensory (S1) cortices can be used to predict the kinematics of bipedal walking in rhesus macaques. However, neural decoding of bipedal locomotion in humans has not yet been demonstrated. Here we compare the predictive power of neural decoders based on human scalp (noninvasive) electroencephalography (EEG) signals during treadmill walking with that reported from multiple single-unit activity (SUA) in the rhesus monkey performing bipedal treadmill walking (Fitzsimmons et al. 2009). We demonstrate the feasibility of using scalp EEG to reconstruct the detailed kinematics of human walking, and the potential of the proposed approach as a new tool for inferring the cortical contributions to walking.
brain computer interface; brain-machine interface; electroencephalography
MATERIALS AND METHODS
LITTLE IS KNOWN about the organization, neural network mechanisms, and computations underlying the control of walking in humans (Choi and Bastian 2007). Although central pattern generators for locomotion are important in the control of walking, supraspinal networks, including the brain stem, cerebellum, and cortex, must be critical, as demonstrated by the changing motor and cognitive (i.e., spatial attention) demands imposed by bipedal walking in unknown or cluttered dynamic environments (Choi and Bastian 2007; Grillner et al. 2008; Nielsen 2003; Rossignol et al. 2007). Neuroimaging studies show that rhythmic foot or leg movements recruit primary motor cortex (Christensen et al. 2001; Dobkin et al. 2004; Heuninckx et al. 2005, 2008; Luft et al. 2002; Sahyoun et al.
Address for reprint requests and other correspondence: J. L. ContrerasVidal, Dept. of Kinesiology, Rm. 2343 SPH Bldg., Univ. of Maryland School of Public Health, College Park, MD 20742 (e-mail:
[email protected]). www.jn.org
Experimental setup and procedure. Six healthy adults, aged 18 – 45 (3 men, 3 women) with no history of neurological disease or lower limb pathology and free of injury participated in the study after giving informed consent. The study was conducted with protocols approved by the Institutional Review Boards at the University of Maryland College Park and the University of Maryland Baltimore and the Baltimore Department of Veterans Affairs Research and Development Committee. Participants were first asked to walk on a treadmill, to establish their comfortable speed during a 5-min familiarization period that preceded the beginning of the recordings. Next, a 2-min rest period (baseline) while standing on the treadmill was followed by 5 min of precision walking, when subjects were instructed to walk on the treadmill at their comfortable speed while receiving real-time visual feedback (30 frames/s) of their lower limbs through a video monitor in front of them. Subjects were told to avoid stepping on the white stripe (2 in. wide) glued diagonally on the treadmill’s belt by using the monitor’s video to keep track of foot placement relative to the white stripe. This increased the attentional demands during treadmill walking (Yogev-Seligman et al. 2008), a condition that can be considered to mimic walking in a novel environment or under novel conditions 1875
Downloaded from jn.physiology.org on October 17, 2011
Presacco A, Goodman R, Forrester L, Contreras-Vidal JL. Neural decoding of treadmill walking from noninvasive electroencephalographic signals. J Neurophysiol 106: 1875–1887, 2011. First published July 13, 2011; doi:10.1152/jn.00104.2011.—Chronic recordings from ensembles of cortical neurons in primary motor and somatosensory areas in rhesus macaques provide accurate information about bipedal locomotion (Fitzsimmons NA, Lebedev MA, Peikon ID, Nicolelis MA. Front Integr Neurosci 3: 3, 2009). Here we show that the linear and angular kinematics of the ankle, knee, and hip joints during both normal and precision (attentive) human treadmill walking can be inferred from noninvasive scalp electroencephalography (EEG) with decoding accuracies comparable to those from neural decoders based on multiple single-unit activities (SUAs) recorded in nonhuman primates. Six healthy adults were recorded. Participants were asked to walk on a treadmill at their self-selected comfortable speed while receiving visual feedback of their lower limbs (i.e., precision walking), to repeatedly avoid stepping on a strip drawn on the treadmill belt. Angular and linear kinematics of the left and right hip, knee, and ankle joints and EEG were recorded, and neural decoders were designed and optimized with cross-validation procedures. Of note, the optimal set of electrodes of these decoders were also used to accurately infer gait trajectories in a normal walking task that did not require subjects to control and monitor their foot placement. Our results indicate a high involvement of a fronto-posterior cortical network in the control of both precision and normal walking and suggest that EEG signals can be used to study in real time the cortical dynamics of walking and to develop brain-machine interfaces aimed at restoring human gait function.
1876
NEURAL DECODING OF TREADMILL WALKING FROM EEG SIGNALS
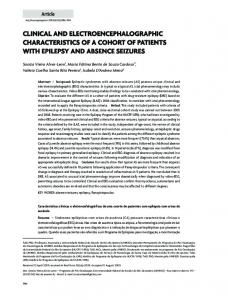
Power spectral density analysis. The power spectral density (PSD) for the kinematic data and for each channel of the EEG recorded during rest and during the walking task for the six subjects was computed with the adaptive Thompson’s multitaper method as implemented in MATLAB’s pmtm function. The time-bandwidth product for the discrete prolate spheroidal sequences used was 4 and the frequency resolution 0.1 Hz. The confidence interval was set to 95% and was estimated with a 2 approach. To account for the variability of the kinematics, and for purposes of cross-validation of the decoders (see Model performance metrics), during the walking task the data for each gait parameter (x,y,z,,d/dt) were divided into five segments (1 min each) and the PSD was calculated for each of these five segments independently. The segments were then averaged across all the parameters and all the subjects, leading to a grand average of the PSD. Frequencies ⱕ 3 Hz accounted for ⬎90% of the total PSD for the kinematics. The same segmentation was applied to each channel of the EEG recorded during rest and walking conditions. The PSD of each segment was averaged across channels and then averaged across subjects, leading to a grand average. The grand averages for the kinematics and the EEG were then smoothed with local regression using weighted linear least squares and a 2nd degree polynomial model as implemented in MATLAB’s loess function with a span (percentage of the total number of data points) of 10%. Signal preprocessing. Figure 1 shows our decoding methodology. All the data analysis, decoder design, and cross-validation procedures were performed off-line with custom software written in MATLAB (Mathworks, Natick, MA). The most frontal electrodes (FP1, FP2, FPz) were removed off-line from all the subjects, as they are usually contaminated by eyeblinks. Temporal electrodes were also removed, as they are most susceptible to artifacts from facial and cranial muscle
Fig. 1. Diagram depicting the decoding methodology. The subject was fitted with a 60-channel EEG cap to record brain activity, and a plurality of sensors were used to record 3-dimensional (3D) kinematics and foot switch data. EEG and kinematics were synchronized, preprocessed, and saved. The training, testing, and optimization of individual neural decoders for each decoded gait parameter were performed off-line with cross-validation procedures. J Neurophysiol • VOL
106 • OCTOBER 2011 •
www.jn.org
Downloaded from jn.physiology.org on October 17, 2011
(e.g., after brain injury). Thus the precision walking paradigm puts us a step closer to the actual application where patients have impaired gait function and therefore would need to rely purely or significantly on effortful attentive conscious control of gait. In an ancillary task, a subset of the participants whose decoders showed the best and worst decoding performance in the precision walking task were also tested under normal walking conditions that did not require precise positioning of the feet or monitoring of foot placement through a computer monitor (subjects were instructed to direct their gaze straight ahead). Limb movement and EEG recordings. The three-dimensional (3D) joint kinematics of the hip, knee, and ankle joints were recorded with an infrared optical motion capture system (Optotrak, Northern Digital, Waterloo, ON, Canada; at 100 Hz) with foot switch data (Koningsberg Instrumentation, Pasadena, CA; at 100 Hz). Precision-manufactured 5-cm-diameter disks (Innovative Sports Training, Chicago, IL), each embedded with three infrared diodes that formed an equilateral triangle (⬃3-cm sides), were affixed with adhesive and secured with foam wrap at the second sacral vertebra (S2) and on the thigh, shank, and foot segments of each lower limb. A segmental model of the lower limbs was then determined by digitizing joint centers for the hip, knee, and ankle joints of each limb. Gait kinematics were derived from the model with motion analysis software (Motion Monitor, Innovative Sports Training) and exported as ascii files containing time histories of the X, Y, and Z positions, joint angular positions, and joint angular velocities for the hip, knee, and ankle joints of the right leg. Whole scalp 60-channel EEG (Neuroscan Synamps2 RT, Compumedics USA, Charlotte, NC) and electroocular activity were recorded [sampling rate of 500 Hz; band-pass filtered from 0.1 to 100 Hz; right ear lobe (A2) was used as a reference] and time-locked with the movement kinematics, using the foot switch signals.
NEURAL DECODING OF TREADMILL WALKING FROM EEG SIGNALS
activity (Goncharova et al. 2003). Signals from each EEG electrode were decimated by a factor of 5 (to 100 Hz) and then filtered with a zero-phase, 3rd-order, band-pass Butterworth filter (0.1–2 Hz) and normalized by subtracting their mean and dividing by their standard deviation (Bradberry et al. 2010). Kinematic data were filtered with a zero-phase, 3rd-order, band-pass Butterworth filter (0.1–3 Hz), as this frequency range accounted for 90% of the signal power. Decoding method. A time-embedded (10 lags, corresponding to 100 ms in the past) linear Wiener filter (Bradberry et al. 2010; Carmena et al. 2003; Fitzsimmons et al. 2009) was independently designed, optimized, and cross-validated for each extracted gait parameter. The linear model was given by: y 共 t兲 ⫽ a ⫹
N
L
兺 兺 bnkSn共t ⫺ k兲 ⫹ 共t兲 n⫽1 k⫽1
r共x, xˆ兲 ⫽
ranked based on the maximum value of the correlations calculated at each lag. For the Cartesian position (x,y,z) reconstructions, the sensors were ranked according to the following sensor sensitivity curve equation (Bradberry et al. 2010): Rn ⫽
N
%Ti ⫽ %100 ⴱ
xˆx
SNR共x, xˆ兲 ⫽ 101log 10
冋
Var共x兲
MSE共xˆ兲
册
where the variance (Var) of the actual measured parameter (signal x) was calculated by subtracting out the mean of the signal, then squaring and averaging the amplitude. The noise or error (xˆ) was the difference between the predicted and actual measured signal. The mean squared error (MSE) was calculated by squaring the difference, then averaging to get the MSE, or the power of the noise. The ratio between Var(x) and MSE(xˆ) was converted into a decibel (dB) scale. A SNR with a value of “0” means that the signal and the noise are equally present in the reconstructed kinematic parameter. A SNR ⬍ 0 (poor prediction) indicates a noisy reconstruction, while a SNR ⬎ 0 (good prediction) indicates a high-quality reconstruction of the signal. Sensor dropping analysis. A sensor dropping analysis (SDA) was used to evaluate the importance of groups of sensors of different sizes to decoding accuracy (e.g., Carmena et al. 2003; Fitzsimmons et al. 2009). First, decoder models were trained by using each lag of each sensor (1 lag at a time) with the above-mentioned fivefold crossvalidation procedure. To rank the sensors, two different methods were then used based on which kinematic parameter was to be decoded. For the joint angle () and the angular velocity (d/dt) the sensors were J Neurophysiol • VOL
L
2 2 ⫹ cnkz 兺 兹c2nkx ⫹ cnky L ⫹ 1 k⫽0
where L is the number of lags, Rn is the rank of sensor n, and c are the best correlation coefficients for each Cartesian position (x,y,z). These procedures were followed for all 45 sensors used for decoding after removing the most prefrontal and temporal electrodes. The best 34 and 16 sensors of the 45 sensors ranked were then used for training and testing the decoders for each kinematic parameter extracted. Decoding kinematics by regions of interest. To assess the contribution to the decoding of each scalp area, the scalp was divided into five major regions of interest (ROIs): prefrontal (PF), central (SM), posterior-occipital (PO), and right (RH) and left (LH) hemispheres. The kinematics were decoded by using the sensors belonging to each of these ROIs, leading to five different decoders for each parameter for each joint and each subject. Scalp maps. To visualize the relative contributions of scalp regions to the reconstruction of the position (x,y,z), joint angle (), and angular velocity (d/dt) of the hip, knee, and ankle joints, the squared correlation (i.e., variance) values c for each sensor at each lag were projected into a time series of scalp maps (⫺100 to 0 ms in increments of 10 ms for a total of 11 scalp maps). The topoplot function of EEGLAB (Delorme and Makeig 2004; http://sccn.ucsd.edu/eeglab/) was used to plot the correlation values. The contribution of the reconstruction of each lag, for the Cartesian data, was calculated as follows (Bradberry et al. 2010):
cov共x, xˆ兲
where x is the actual measured parameter, xˆ is the prediction of that parameter, and x and xˆ are the standard deviations of x and xˆ, respectively. The signal-to-noise ratio (SNR) was calculated according to Fitzsimmons et al. (2009):
1
2 2 2 ⫹ cniy ⫹ cniz 兺 兹cnix n⫽1 N
L
2 2 2 ⫹ cniy ⫹ cniz 兺 兺 兹cnix n⫽1 k⫽0
for all i from 0 to L, where %Ti is the percentage of reconstruction contribution at time lag i. Artifacts. To address the issue of potential mechanical artifacts introduced by motion of the EEG cap wires to the recording amplifiers (due in turn to movement of the subject), the phase-locking value (PLV) (Lachaux et al. 2000, 2002) was computed by using Morlet wavelets (Tallon-Baudry et al. 1997). We made the assumption that if the motion of the EEG wires corrupted in some way the measured EEG signals, this problem should have been observed in all the electrodes, as the wires were bundled in a single connector. We were particularly interested in investigating the phase in the 1–2 Hz range, as these were the main frequencies used for decoding. We calculated the PLV between each electrode for the walking task and the corresponding kinematics recorded from the subjects. The averaged values of PLV at 1 and 2 Hz were averaged across the electrodes, leading to a mean value at the two frequencies of interest, and compared with the correlation values of the decoding. Analysis of potential eye movement contributions to decoding. To assess a potential contribution of the movement of the eyes to decoding, the decoding process was also carried out by adding the standardized vertical electrooculogram (VEOG) activity to the optimal set of electrodes used for decoding (Bradberry et al. 2011). The r values and the regression weights were calculated in this new condition. We compared the r values with and without the VEOG electrode by calculating the difference in percentage and divided the absolute value of the regression weights of the eye electrode by the sum of the absolute value of all the regression weights of the best fold.
106 • OCTOBER 2011 •
www.jn.org
Downloaded from jn.physiology.org on October 17, 2011
where y(t) is the predicted gait parameter (x,y,z,,d/dt) time series representing the linear and angular kinematics, and their time derivatives, for the hip, knee, and ankle joints; L and N are the number of lags and the number of electrodes, respectively; Sn(t ⫺ k) is the standardized voltage measured at EEG electrode n at lag time k, a and b are weights obtained through multiple linear regression; and (t) is the residual error. The parameters of the model were calculated with the standard GLM functions in MATLAB under the Gaussian distribution using MATLAB’s linear link function. Model performance metrics. To assess and compare the predictive power of each decoder (neural decoders were trained independently for each subject and each decoded parameter), a fivefold crossvalidation procedure, i.e., five distinct sets of test data that were not used to train the decoder, was employed for testing purposes. That is, the data recorded during the 5 min of the walking task were divided into five segments (1 min each). Four segments were used for training, while the remaining segment was used for testing the model. This procedure was repeated for all the possible combinations. The Pearson correlation coefficient (r) was calculated between the known measured signal and the predicted decoder’s output as follows:
1877
1878
NEURAL DECODING OF TREADMILL WALKING FROM EEG SIGNALS
RESULTS
Fig. 2. A: mean power spectral density (PSD, in dB/Hz; black) and 95% confidence intervals (gray) of the grand mean of the kinematic parameters across the 6 subjects. B: confidence intervals (C.I., 95%) of the PSD (in dB/Hz) of the EEG recorded during rest and walking of the grand mean (not shown) across the 6 subjects. Black lines represent the PSD at rest, while gray lines represent the PSD during walking. Inset: ratio of PSD(walking) to PSD(rest). J Neurophysiol • VOL
106 • OCTOBER 2011 •
www.jn.org
Downloaded from jn.physiology.org on October 17, 2011
Spectral signature of walking kinematics and associated high-density EEG. The PSD of the gait kinematics in the 0.1–5 Hz range and the 95% confidence intervals are depicted in Fig. 2A. The PSD shows that ⬎90% of the power is contained in the 0.1–3 Hz frequency band with a peak (26.45 dB) at ⬃1.8 Hz. The ratio between upper and lower bounds of the confidence interval throughout all the frequencies was ⬃6.6 dB. Confidence intervals (95%) of the PSD of the EEG at rest and during precision walking are shown in Fig. 2B. Notably, PSD(walking) ⬎ PSD(rest) in the delta and theta bands (⬃0.1–7 Hz) and in the low beta range (13–18 Hz), whereas for frequencies ⬎ 18 Hz PSD(walking) ⬍ PSD(rest). Importantly, the suppression in the mu band observed during upper limb movements (Pfurtscheller et al. 2006) is also present during precision walking in the 8 –12 Hz range. This is clearly depicted in the plot of the ratio of PSD(walking) to PSD(rest) shown in Fig. 2B, inset. Of note, the ratio in the 0.1–2 Hz range used for decoding was ⬃1.0 dB, implying that walking did not alter the spectral signature in this low-frequency band (i.e., low delta)—a finding consistent with the data reported by Gwin et al. (2010). Decoding accuracy. Our EEG decoding method was able to reconstruct 3D linear and angular kinematics of the ankle, knee, and hip joints with high accuracy. To quantify the level of accuracy, we computed the Pearson’s r and the SNR between measured and predicted Cartesian positions, joint angles, and angular velocities across cross-validation folds. SNR proved to be a more sensitive measure compared with r, which describes the correspondence of signal waveforms but is insensitive to amplitude scaling and offsets. The average of the correlation values (r) between predicted and recorded kinematics for the six subjects was 0.75 (⫾0.1), and the SNR values ⬎ 0 (4.13 ⫾ 2.03) in all but one measure (subject S6: x-axis of the ankle; SNR ⫽ ⫺0.35 ⫾ 1.09) confirmed the good quality of the decoded signals. Overall, correlation values across the subjects were slightly higher for joint angle (mean r ⫽ 0.78 ⫾ 0.1) and angular velocity (mean r ⫽ 0.78 ⫾ 0.09) than for
Cartesian positions (mean rx,y,z ⫽ 0.71 ⫾ 0.13). Figure 3, A and B, show, respectively, examples of the measured and reconstructed kinematics for the best (S4) and worst (S5) subjects in terms of decoding accuracy. As can be seen, even in the worst case we were able to decode the kinematic parameters with an accuracy r ⫽ 0.67 ⫾ 0.09. The quality of the reconstructions of the gait trajectories in 3D space is shown in Fig. 4, where an example of the actual and predicted angular velocities and joint angles, and their relative phasing, for the ankle, knee, and hip, for subject S4 are depicted in 3D space as well. Table 1 reports the mean and SD of the correlation coefficients (r) and of the SNR (dB) values across cross-validation folds for all subjects, for the best (S4) and worst (S5) cases (subjects), and for intracortical recordings from rhesus monkey 1 (Fitzsimmons et al. 2009), while Fig. 5 shows the distribution of the correlation coefficients (r) versus SNR (dB) for the six subjects and for the two rhesus monkeys reported in the Fitzsimmons experiment. All the decoded accuracies resulted in mean r values ⬎ 0.5 and high SNR values (all but one ⬎ 0), which were comparable with the values reported with recording spikes from rhesus monkeys (Fitzsimmons et al. 2009). To rule out the hypothesis that the visual feedback aided decoding, we report in Table 2 the r and SNR values of the best and worst subjects decoded under natural walking conditions (no visual feedback and no stripe to step over) from our ancillary task. We used the optimal set of electrodes of the neural decoders, previously trained with data from the precision walking task, to predict the linear and angular kinematics during normal walking. The decoding accuracies reported for the two conditions were comparable. The averages of the correlation values (r) between predicted and recorded kinematics for the precision and natural walking task were 0.85 ⫾ 0.08 and 0.7 ⫾ 0.13, respectively, for subject S4 and 0.67 ⫾ 0.09 and 0.78 ⫾ 0.12, respectively, for subject S5. Decoding accuracy by region of interest. Figure 6 depicts the mean decoding accuracy across the three joints for the five different ROIs. For both the angular velocity and the joint angle the r and SNR values were higher when all the sensors
NEURAL DECODING OF TREADMILL WALKING FROM EEG SIGNALS
1879
found during the decoder optimization phase were used to decode. Decoders built based on a subset of electrodes comprising the RH or LH scalp regions showed the highest r values among the selected ROIs, while the subset of electrodes spanning the central scalp ROI (SM) showed the lowest r values. In terms of SNR, the RH, PF, and PO ROIs returned the highest values, while the SM ROI returned the lowest values. However, statistically these differences were not significant (Kruskal-Wallis test; all comparisons at P ⬎ 0.05). Topography of correlation values of sensors. The topography of the squared correlation (i.e., variance) values of the sensors at the best lag for the best (subject S4)- and worst (subject S5)-decoded cases is plotted in Fig. 7. These scalp J Neurophysiol • VOL
maps represent the individual contribution of electrodes to decoding, that is, the spatial distribution of the EEG information about walking contained at each electrode site. From these scalp maps, it can be inferred that neural information about walking is distributed across a sparse cortical network at the macroscale of EEG. Scalp maps of sensors most relevant to decoding of the right limb suggest that scalp areas from both hemispheres, somewhat lateralized to the right, are involved during walking. Although there are some common scalp regions relevant across all the gait parameters, these scalp regions accounting for the highest variance are different across subjects S4 and S5. For instance, C6, FZ, P5, and AF4 electrodes are recruited across gait parameters for subject S4,
106 • OCTOBER 2011 •
www.jn.org
Downloaded from jn.physiology.org on October 17, 2011
Fig. 3. Reconstructed right leg kinematics from EEG for the “best” (S4, A)- and “worst” (S5, B)decoded subjects. Columns represent ankle, knee, and hip joints. Each row represents comparison of reconstructed (gray) and actual (black) measured linear kinematic trajectories for (x,y,z), joint angle, and angular velocity (Ang Vel) time series at the optimal number of sensors.
1880
NEURAL DECODING OF TREADMILL WALKING FROM EEG SIGNALS
plateau (i.e., an improvement in DA ⬍ 5%) with 14 sensors (Fig. 8A). As shown, with an average of 27 sensors (i.e., the “best” sensors), the mean r value across the six subjects was 0.75 (⫾0.06), while selecting the best 14 sensors led to a mean r value across the six subjects of 0.72 (⫾0.06), that is, ⬍5% reduction in decoding accuracy (Fig. 8B). DISCUSSION
whereas for subject S5 electrode locations at FC6, P6, and PO2 on the right hemisphere seemed to be relevant for decoding walking across all the kinematic parameters. There were also other important differences across subjects. For example, in subject S4 decoding of both Cartesian and angular kinematics recruited anterior scalp areas (electrode locations AF3, FZ, and AF4) that in some cases extended to left frontal sites (F5). These scalp areas were absent in subject S5, who showed the lowest decoding accuracies. Of note, the scalp maps of the highest (e.g., r2 ⬎ 0.2) electrode contributions to decoding the right limb kinematics were rather sparse, particularly for subject S5, who showed rather focal recruitment of electrodes on the RH, compared with a more bilateral, but still sparse, recruitment of electrodes for subject S4. In summary, a sparse network comprising right posterior-occipital, right lateral, and bilateral anterior-frontal scalp regions appeared to contain decodable gait information. Minimum number of sensors. Given that the analysis of scalp maps relevant for decoding showed a sparse cortical network for walking, the number of sensors was further optimized with the SDA approach. As shown in Fig. 8, the average number of sensors needed to achieve the reported correlations was ⬃27– 32, but on average decoding accuracy reached a phase of J Neurophysiol • VOL
106 • OCTOBER 2011 •
www.jn.org
Downloaded from jn.physiology.org on October 17, 2011
Fig. 4. Actual and predicted standardized 3D trajectories for angular velocity and joint angle of the ankle for subject S4. Ankle, knee, and hip trajectories are plotted in the x-, y-, and z-axes respectively. The letter “S” represents the starting point. A: trajectories of the predicted (gray) vs. actual (black) angular velocities. B: trajectories of the predicted (gray) vs. actual (black) joint angles.
Gait kinematics can be inferred from scalp EEG signals with high accuracy. This study demonstrates, for the first time, that noninvasive scalp EEG signals can be used to decode kinematic parameters extracted during walking with high accuracy. Of note is the fact that even though we recorded EEG from 60 channels, which some investigators consider to be high-density recordings (Tononi et al. 2010), we showed that as few as 16 sensors were required for decoding with high accuracy. Encouraged by promising results achieved in previous studies carried out in our laboratory (Bradberry et al. 2008, 2009a, 2009b, 2010), we designed neural decoders by using timedomain EEG features extracted solely from the fluctuations in the amplitude [i.e., amplitude modulation (AM)] in the EEG signals in the low delta frequency band (0.1–2 Hz). Even though Onton et al. (2005) reported significant changes in the theta band (4 – 8 Hz) reflecting increasing cognitive demands, we emphasize that our decoders were designed to use information contained in the delta band only. Moreover, our decoders were able to predict gait kinematics under two different conditions (precision walking and normal walking), which clearly differ in terms of the cognitive demands and task constraints, and thus changes in cognitive demands or modulations in higher-frequency bands could not contribute to decoding. Our decoding approach proved to be robust, as it prevents overfitting (i.e., by employing separate training and testing trials) and minimizes the effect of artifacts because trials with artifacts in the training set would contribute minimally to the learning of the optimal decoder weights and those in the test set could only reduce, not improve, the decoding accuracy (Tsuchiya et al. 2008). The fact that critical information for decoding lower limb kinematics is contained in the smoothed AM in the lower half of the so-called delta band (i.e., 0.1– 4 Hz) is consistent with recent EEG, electrocorticographic (ECoG), and local field potential (LFP) upper limb movement decoding studies that use the fluctuations in the amplitude of highly smoothed signals for decoding (Acharya et al. 2010; Ball et al. 2009; Ince et al. 2010; Lv et al. 2010; Waldert et al. 2008; Zhuang et al. 2010). It is also consistent with observations by Gwin et al. (2010), who showed that meaningful changes during walking or running occur at low frequencies (⬍10 Hz) in high-density EEG. Fitzsimmons et al. (2009) were the first to prove that linear decoders could be used to reconstruct locomotion, but their experiments were based on intracortical recordings (spikes) in nonhuman primates. Ferris and colleagues have recently shown electrocortical activity coupled to gait cycle phase during treadmill walking in humans (Gwin et al. 2011), but their study did not decode gait parameters from the EEG signals. In our experiment, six subjects were asked to walk at their preferred speed on a treadmill while receiving visual feedback of their lower limbs (through a video monitor at eye level in front of
NEURAL DECODING OF TREADMILL WALKING FROM EEG SIGNALS
1881
Table 1. Comparison of decoding results in nonhuman primates with present human study EEG Spikes (monkey 1)
Subject 5 (worst)
Mean (6 subjects)
r
SNR
r
SNR
r
SNR
r
SNR
0.79 ⫾ 0.09 0.86 ⫾ 0.11 0.44 ⫾ 0.15 N/A N/A
4.08 ⫾ 1.8 6.25 ⫾ 2.66 ⫺0.2 ⫾ 1.48 N/A N/A
0.81 ⫾ 0.02 0.92 ⫾ 0.009 0.92 ⫾ 0.009 0.87 ⫾ 0.01 0.81 ⫾ 0.03
4.71 ⫾ 0.67 8.13 ⫾ 0.48 8.03 ⫾ 0.4 6.1 ⫾ 0.59 4.54 ⫾ 0.7
0.59 ⫾ 0.12 0.71 ⫾ 0.17 0.73 ⫾ 0.11 0.68 ⫾ 0.11 0.67 ⫾ 0.08
1.43 ⫾ 1.74 2.64 ⫾ 3.34 3.04 ⫾ 2.38 2.19 ⫾ 2.44 2.11 ⫾ 2.04
0.58 ⫾ 0.17 0.8 ⫾ 0.08 0.76 ⫾ 0.1 0.68 ⫾ 0.08 0.71 ⫾ 0.08
1.9 ⫾ 1.74 4.84 ⫾ 2.11 4.27 ⫾ 2.19 2.81 ⫾ 1.16 3.26 ⫾ 1.63
0.66 ⫾ 0.14 0.79 ⫾ 0.13 0.39 ⫾ 0.13 0.84 ⫾ 0.07 N/A
1.96 ⫾ 1.84 4.28 ⫾ 2.02 ⫺0.52 ⫾ 1.36 5.29 ⫾ 2.06 N/A
0.6 ⫾ 0.06 0.9 ⫾ 0.01 0.91 ⫾ 0.005 0.92 ⫾ 0.01 0.9 ⫾ 0.02
1.9 ⫾ 0.66 7.21 ⫾ 0.6 7.71 ⫾ 0.51 8.41 ⫾ 0.6 7.16 ⫾ 0.86
0.4 ⫾ 0.07 0.71 ⫾ 0.14 0.74 ⫾ 0.08 0.75 ⫾ 0.1 0.81 ⫾ 0.08
0.15 ⫾ 0.87 2.64 ⫾ 2.61 3.12 ⫾ 1.92 3.29 ⫾ 2.2 4.62 ⫾ 2.2
0.67 ⫾ 0.16 0.82 ⫾ 0.07 0.8 ⫾ 0.07 0.85 ⫾ 0.04 0.84 ⫾ 0.05
2.22 ⫾ 1.43 5.11 ⫾ 1.98 4.73 ⫾ 1.8 5.95 ⫾ 1.35 5.75 ⫾ 1.66
0.6 ⫾ 0.14 0.66 ⫾ 0.14 0.56 ⫾ 0.13 0.73 ⫾ 0.11 N/A
1.15 ⫾ 1.71 1.97 ⫾ 1.92 0.66 ⫾ 1.75 2.95 ⫾ 1.95 N/A
0.76 ⫾ 0.04 0.82 ⫾ 0.01 0.85 ⫾ 0.02 0.9 ⫾ 0.01 0.88 ⫾ 0.006
3.68 ⫾ 0.68 4.86 ⫾ 0.31 5.8 ⫾ 0.72 7.29 ⫾ 0.6 6.56 ⫾ 0.31
0.57 ⫾ 0.08 0.72 ⫾ 0.07 0.71 ⫾ 0.1 0.68 ⫾ 0.16 0.71 ⫾ 0.13
1.05 ⫾ 1.5 2.84 ⫾ 1.77 2.9 ⫾ 1.99 2.11 ⫾ 3.16 2.77 ⫾ 2.5
0.77 ⫾ 0.11 0.7 ⫾ 0.1 0.81 ⫾ 0.06 0.81 ⫾ 0.07 0.8 ⫾ 0.09
3.54 ⫾ 1.47 2.97 ⫾ 1.44 5 ⫾ 1.43 5.03 ⫾ 1.79 4.82 ⫾ 2.3
Values are mean ⫾ SD correlation coefficient (r) and signal-to-noise ratio (SNR, dB) for the prediction of different walking parameters for monkey 1 (Fitzsimmons et al. 2009) and for the best (subject 4)- and worst (subject 5)-decoded subjects and mean across the 6 subjects in the present study. Ang Vel, angular velocity; N/A, not available.
them) to repeatedly avoid stepping on a stripe drawn on the treadmill belt—a condition we called precision walking. Even though angular kinematics were on average slightly better decoded than linear kinematics, we could not identify any parameter that stood out as the best for decoding, except for the Cartesian “x” parameters, which showed a lower decoding performance overall. All the kinematic parameters but “x” position were decoded with mean r values ⬎ 0.7 [mean rx ⫽ 0.67 (⫾0.16), mean ry ⫽ 0.77 (⫾0.1), rz ⫽ 0.77 (⫾0.13), rangle ⫽ 0.78 (⫾0.09), rang vel ⫽ 0.78 (⫾0.1)], and no statistical difference was found among the five parameters (P ⬎ 0.01, ANOVA). Moreover, as shown in Fig. 4, the phasing relationship between ankle, knee, and hip angular kinematics is preserved in the reconstructed trajectories even though the three joints were decoded independently from each other. Remarkably, as depicted in Fig. 5, SNR and r values were compa-
Fig. 5. Comparison of decoding accuracy (r) vs. signal-to-noise ratio (SNR, dB) for the present study (n ⫽ 6) with the nonhuman primate study (monkeys 1 and 2) of Fitzsimmons et al. (2009). Stars represent monkeys (M1, M2), while squares represent the 6 subjects of our study (S1–S6). J Neurophysiol • VOL
rable to those reported by Fitzsimmons et al. (2009), a result that supports the hypothesis that the EEG signals in the low delta frequency band over a large but sparse cortical network contain decodable information that could be used to design EEG-based brain-machine interface (BMI) systems for restoration of lower limb movement. It cannot be overemphasized that the same optimal set of electrodes of the decoders calibrated with data from the precision walking task were able to reconstruct the gait kinematics during normal walking, which did not require subjects to monitor and control foot placement and had no access to visual feedback of foot placement, thus demonstrating the robustness of our methods. Scalp map analysis. Decoder optimization and scalp maps of correlations for the right limb confirmed that human walking is subserved by a complex, distributed, but sparse cortical network, in which different scalp areas over anterior, right lateral, and right anterior-occipital scalp areas seem to contribute equally to the decoding, at least at the macroscale of EEG. As we decoded the right leg only, it still remains to be seen whether this sparse network that encoded right-side lower limb kinematics would be mirrored in the case of the left leg kinematics. Our best-decoded case (subject S4) showed the highest gait-related information in the bilateral anterior and the lateral and posterior-occipital scalp areas in the right hemisphere. Of note, our worst subject (subject S5) showed a lack of anteriorfrontal recruitment for decoding the right limb, which may explain the lower decoding accuracies. In fact, it is plausible that because the precision walking task presumably involves both visual attention and decision making with respect to deciding when or how best to avoid stepping in the white line drawn on the treadmill, this lack of anterior-frontal recruitment for decoding affected the overall performance. The fact that different scalp brain areas could contribute equally to the
106 • OCTOBER 2011 •
www.jn.org
Downloaded from jn.physiology.org on October 17, 2011
Ankle X Y Z Joint Angle Ang Vel Knee X Y Z Joint Angle Ang Vel Hip X Y Z Joint Angle Ang Vel
Subject 4 (best)
1882
NEURAL DECODING OF TREADMILL WALKING FROM EEG SIGNALS
Table 2. Comparison of decoding results between precision and natural walking Subject 4 (precision walking)
Subject 5 (precision walking)
Subject 5 (natural walking)
r
SNR
r
SNR
r
SNR
r
SNR
0.81 ⫾ 0.02 0.92 ⫾ 0.009 0.92 ⫾ 0.009 0.87 ⫾ 0.01 0.81 ⫾ 0.03
4.71 ⫾ 0.67 8.13 ⫾ 0.48 8.03 ⫾ 0.4 6.1 ⫾ 0.59 4.54 ⫾ 0.7
0.47 ⫾ 0.17 0.75 ⫾ 0.16 0.81 ⫾ 0.11 0.68 ⫾ 0.13 0.75 ⫾ 0.07
⫺1.55 ⫾ 4.51 3.26 ⫾ 3.45 4.58 ⫾ 2.99 1.79 ⫾ 3 3.52 ⫾ 1.43
0.59 ⫾ 0.12 0.71 ⫾ 0.17 0.73 ⫾ 0.11 0.68 ⫾ 0.11 0.67 ⫾ 0.08
1.43 ⫾ 1.74 2.64 ⫾ 3.34 3.04 ⫾ 2.38 2.19 ⫾ 2.44 2.11 ⫾ 2.04
0.77 ⫾ 0.03 0.83 ⫾ 0.03 0.86 ⫾ 0.02 0.84 ⫾ 0.02 0.82 ⫾ 0.02
3.84 ⫾ 0.65 4.99 ⫾ 0.84 5.69 ⫾ 0.55 5.43 ⫾ 0.64 4.74 ⫾ 0.68
0.6 ⫾ 0.06 0.9 ⫾ 0.01 0.91 ⫾ 0.005 0.92 ⫾ 0.01 0.9 ⫾ 0.02
1.9 ⫾ 0.66 7.21 ⫾ 0.6 7.71 ⫾ 0.51 8.41 ⫾ 0.6 7.16 ⫾ 0.86
0.37 ⫾ 0.11 0.74 ⫾ 0.07 0.76 ⫾ 0.09 0.82 ⫾ 0.1 0.84 ⫾ 0.04
⫺1.03 ⫾ 3.02 2.45 ⫾ 2.02 3.49 ⫾ 2.44 4.82 ⫾ 2.82 5.23 ⫾ 1.42
0.4 ⫾ 0.07 0.71 ⫾ 0.14 0.74 ⫾ 0.08 0.75 ⫾ 0.1 0.81 ⫾ 0.08
0.15 ⫾ 0.87 2.64 ⫾ 2.61 3.12 ⫾ 1.92 3.29 ⫾ 2.2 4.62 ⫾ 2.2
0.36 ⫾ 0.04 0.82 ⫾ 0.04 0.85 ⫾ 0.02 0.86 ⫾ 0.02 0.87 ⫾ 0.02
0.04 ⫾ 0.62 4.97 ⫾ 1.07 5.63 ⫾ 0.76 5.93 ⫾ 0.59 6.22 ⫾ 0.71
0.76 ⫾ 0.04 0.82 ⫾ 0.01 0.85 ⫾ 0.02 0.9 ⫾ 0.01 0.88 ⫾ 0.006
3.68 ⫾ 0.68 4.86 ⫾ 0.31 5.8 ⫾ 0.72 7.29 ⫾ 0.6 6.56 ⫾ 0.31
0.64 ⫾ 0.15 0.71 ⫾ 0.19 0.81 ⫾ 0.09 0.82 ⫾ 0.07 0.66 ⫾ 0.14
0.79 ⫾ 3.54 2.3 ⫾ 4.05 4.64 ⫾ 2.02 4.72 ⫾ 1.93 1.27 ⫾ 3.02
0.57 ⫾ 0.08 0.72 ⫾ 0.07 0.71 ⫾ 0.1 0.68 ⫾ 0.16 0.71 ⫾ 0.13
1.05 ⫾ 1.5 2.84 ⫾ 1.77 2.9 ⫾ 1.99 2.11 ⫾ 3.16 2.77 ⫾ 2.5
0.67 ⫾ 0.03 0.79 ⫾ 0.02 0.83 ⫾ 0.03 0.81 ⫾ 0.04 0.81 ⫾ 0.03
2.38 ⫾ 0.39 4.17 ⫾ 0.61 5.1 ⫾ 0.79 4.71 ⫾ 1.04 4.74 ⫾ 0.72
Values are mean ⫾ SD correlation coefficient (r) and SNR (dB) for the prediction of different walking parameters for the best (subject 4)- and worst (subject 5)-decoded subjects under precision and natural walking.
decoding is supported by the r and SNR values obtained when decoding kinematic parameters using only sensors from specific ROIs. In fact, even though differences in terms of r and SNR were observed between the five selected ROIs, statistically these differences were not significant. Our observations are in agreement with the findings by Gwin et al. (2011), who used source analysis and reported electrocortical sources in the anterior cingulate, posterior parietal, and sensorimotor cortex associated with intrastride changes in spectral power. During the end of stance, they also observed that alpha- and beta-band spectral power increased in or near the left/right sensorimotor and dorsal anterior cingulated cortex. However, power in-
creases in the left/right sensorimotor cortices were more pronounced for contralateral limb push-off than for ipsilateral limb push-off. Studies carried out with fNIRS also showed involvement of frontal, premotor, and supplementary motor areas during walking (Harada et al. 2009; Miyai et al. 2001; Suzuki et al. 2004, 2008). These results support the idea that walking is represented across a plurality of cortical brain areas. Minimum number of sensors. An important issue in BMI design is concerned with the minimum number of sensors necessary to achieve a reasonable decoding accuracy. As is well known (Alpaydin 2004), a common occurrence in machine learning is the fact that as the number of input features
Fig. 6. Decoding accuracy from different scalp regions of interest (ROIs). Left: box plots show the r and SNR values for the angular velocity and the joint angle calculated with electrodes situated across 5 different scalp areas [left hemisphere (LH), right hemisphere (RH), anterior (PF), centro-medial (SM), and anterior-occipital (PO)] and with all the electrodes (ALL). Right: scalp map depicts the coverage used for each ROI and the location of the electrodes in each ROI. Right and left hemispheres have been separated by the midline. Midline electrodes (along the line linking FZ and OZ) have been included in neither the right nor the left hemisphere ROIs. J Neurophysiol • VOL
106 • OCTOBER 2011 •
www.jn.org
Downloaded from jn.physiology.org on October 17, 2011
Ankle X Y Z Joint Angle Ang Vel Knee X Y Z Joint Angle Ang Vel Hip X Y Z Joint Angle Ang Vel
Subject 4 (natural walking)
NEURAL DECODING OF TREADMILL WALKING FROM EEG SIGNALS
1883
increases, the decoding accuracy of the predictions increases up to a certain point, after which the model becomes too complicated, overfitting might occur, and as a consequence of this fact performance decreases. Given this, we decided to compare the r values obtained with the number of sensors found in the SDA with the best r values obtained by using up to 16 sensors. Our results indicate that ⬃14 sensors could be sufficient to decode human locomotion with EEG. Variability of the kinematics and its relation with decoding accuracy. Spectral analysis of the gait kinematics showed that ⬎90% of the power was retained in the 0.1–3 Hz range, justifying our choice to band-pass filter the kinematic data within this frequency range. The 6.6-dB ratio of the upper and lower confidence intervals suggested a significant variability of the kinematic parameters across the six subjects. This variability could be due to the fact that each subject chose his/her comfortable pace for the walking task but also varied his/her gait speed during the task. Consistent with upper limb movement decoding studies (Bradberry et al. 2010), a negative correlation between movement variability and decoding accu-
racy was found when decoding gait parameters for both angular velocity and joint angle decoding (Fig. 9). Specifically, the relationship between the decoding accuracy and gait variability, as measured by the kurtosis (kurtosis ⫽ 3 implies normal distribution), for angular velocity and joint angle was estimated. Low values of the kurtosis (⬃3) (Fig. 9) and high decoding accuracy for both the angular velocity and the joint angle suggest that a normal distribution is responsible for an increase in decoding accuracy. Decoding accuracy was not affected or corrupted by eye, mechanical, or EMG artifacts. The spectral analysis of the EEG showed interesting results. As in the case of the upper limbs (Pfurtscheller et al. 2006), a desynchronization during the walking task was found in the mu band (8 –12 Hz). As reported by Gwin et al. (2010), PSD values during walking were generally higher than PSD values during rest (i.e., standing) at low frequencies (0.1–7 Hz) and in the middle beta band (13–18 Hz). The ratio of PSD(walking) to PSD(rest), albeit small (e.g., ⬃1 dB in the 0.1–2 Hz range), is consistent with those observations. Moreover, Gwin et al. (2010) reported that
Fig. 8. Decoding accuracy with the optimal number of sensors and the lowest number of sensors. A: mean (⫾SD) sensor dropping analysis (SDA) across the 6 subjects. B: decoding accuracy (r) obtained by using the best 34 sensors found by the SDA analysis (black) and by using the highest r among the first best 16 sensors (white) for each subject. Each set of 2 bars (black and white) represents the mean r values (⫾SD) for each subject. The last set of 2 bars represents the grand average across the subjects for both the optimal condition (black) and the plateau condition (white). C: number of sensors used to compute the r values when the “best” number of sensors was used (black) and up to 16 sensors were used (white) for each subject. Each set of 2 bars (black and white) represents the r values (⫾SD) of the 6 subjects. J Neurophysiol • VOL
106 • OCTOBER 2011 •
www.jn.org
Downloaded from jn.physiology.org on October 17, 2011
Fig. 7. Spatial distribution of r2 decoding accuracies across sensors for the “best” (S4, A)- and “worst” (S5, B)-decoded subjects. Scalp maps represent the spatial distribution of r2 across electrodes at the best lag for each parameter resulting from the training of the linear model. From left to right, each column represents the scalp map of the Cartesian positions, joint angles, and angular velocities.
1884
NEURAL DECODING OF TREADMILL WALKING FROM EEG SIGNALS
Fig. 9. Relationship between gait variability and decoding accuracy for the angular velocity and joint position trajectories. A: mean (⫾SD) of the kurtosis of the angular velocity across the 3 joints (ankle, knee and hip). B: mean (⫾SD) of the kurtosis of the joint angle across the 3 joints (ankle, knee and hip). C: box plots of the confidence intervals (70%) for the bootstrapped r, kurtosis paired values. Horizontal lines represent the medians.
Table 3. Comparison of decoding accuracy (r) and weights between decoding with and without eye electrode Subject 1
Ankle X Y Z Joint Angle Ang Vel Knee X Y Z Joint Angle Ang Vel Hip X Y Z Joint Angle Ang Vel
Subject 2
Subject 3
Subject 4
Subject 5
Subject 6
%Weight
%r
%Weight
%r
%Weight
%r
%Weight
%r
%Weight
%r
%Weight
%r
0.75 0.17 0.3 0.72 0.6
0 ⫺1.26 0 0 0
1.99 0.61 68.06 8.55 3.93
2.98 5.19 9.67 0 ⫺4.47
1.85 3.91 6.55 8.3 0.6
⫺1.42 ⫺1.13 0 0 0
1.1 1.69 2.29 2.98 2.32
0 0 0 ⫺1.21 ⫺1.13
1.25 0.42 0.44 0.79 0.46
3.5 2.89 1.38 ⫺1.47 0
1.27 2.32 1.36 1.22 0.48
3.12 ⫺1.17 0 0 0
0.15 0.22 0.13 0.2 2.15
0 0 0 1.26 0
4.62 7.9 11.7 2.17 3.89
⫺1.28 ⫺6.09 ⫺2.32 ⫺1.11 ⫺2.24
9.23 0.2 1.22 2 1.09
⫺1.35 ⫺1.09 ⫺1.35 ⫺1.09 ⫺1.16
3 1.29 2.75 1.29 4.52
⫺1.63 ⫺1.09 0 0 ⫺1.07
3.28 0.13 0.1 0.78 0.78
0 2.89 1.36 0 1.35
0.39 0.65 1.5 0.73 1.54
1.75 0 0 0 0
0.55 0.59 0.78 0.49 0.44
⫺1.28 ⫺1.47 ⫺1.26 0 0
8.4 0.49 5.91 11.68 5.42
⫺4.87 0 0 ⫺4.76 ⫺7.5
1.68 2.57 0.36 0.77 3.27
0 ⫺1.23 0 0 ⫺1.09
2.8 3.67 2.26 1.34 2.55
⫺1.29 0 ⫺2.29 ⫺1.12 0
0.3 0.93 0.66 1.06 0.54
1.78 0 1.42 1.42 3.03
1.36 1.82 1.61 0.67 1.04
0 ⫺1.88 0 0 0
Differences in % between correlation coefficient (r) and the ratio between weights for the prediction of different walking parameters for the 6 subjects decoded under precision walking with and without eye electrode are shown. Positive values mean an increase of r and weight with eye electrode, while negative values mean a decrease of r and weight with eye electrode. J Neurophysiol • VOL
106 • OCTOBER 2011 •
www.jn.org
Downloaded from jn.physiology.org on October 17, 2011
notion that eye movements did not contribute to the high r and SNR values found in this study. Results are reported in Table 3. It is also important to point out that in the normal walking condition the subject was instructed to maintain his/her gaze straight ahead. This condition is likely to be associated with significant eye movements due to the compensation of displacements of the head during walking (and neck muscle activity). Indeed, significant eye movements have been reported during standing and walking (Gramann et al. 2010). However, two lines of reasoning argue against the potential contributions of eye movement to decoding: First, the same optimal set of electrodes of the decoders were used to infer limb kinematics in two conditions (normal walking and precision walking) that differed in the pattern of eye movements (gaze straight ahead vs. monitoring foot placement in a monitor) and furthermore, the correlation analysis showed that eye movements did not assist gait decoding. Second, Goncharova et al. (2003) have shown that electromyographic (EMG) and ocular artifacts do generally occur mainly at frequencies higher than 8 Hz, which is four times higher than our frequency cutoff of 2 Hz used for reconstruction. Moreover, Goncharova et al. (2003) reported that EMG
gait-related artifacts removed from EEG signals were insubstantial when subjects walked at a slow pace (0.8 m/s ⫽ 2.88 km/h). In our experiments, no subject walked faster than 2.4 km/h, thus reducing further the likelihood of mechanical artifacts. Nevertheless, it could still be argued that EEG signals measured during gross motor tasks like walking are prone to a myriad of physiological, mechanical, and environmental artifacts that would prevent accurate measurement and analysis of cortical dynamics during treadmill walking (Gwin et al. 2010). However, our proposed method for reconstruction of gait parameters and additional analyses of the potential influence of artifactual components to gait decoding suggest otherwise. First, the decoding accuracies with and without inclusion of the VEOG electrode were similar. For all the decoded gait parameters except for the ankle in subject S2 (ry ⫽ 5.1%, rz ⫽ 9.6%), the addition of the VEOG electrode negligibly increased the decoding accuracy by a maximum of 3.5%. The contribution of VEOG in terms of regression weights was also negligible for all decoded gait parameters except for the reconstruction of limb trajectories in the ankle’s z-dimension for subject S2 (rz ⫽ 68.06%). Furthermore, subject S2 showed the lowest r value for the ankle (rz ⫽ 0.34 ⫾ 0.22), supporting the
NEURAL DECODING OF TREADMILL WALKING FROM EEG SIGNALS
J Neurophysiol • VOL
same for both walking conditions; indeed, the fact that the same optimal set of electrodes of the decoders were used to decode gait in both walking (precision and normal) conditions is a strong argument against the potential influence of movement artifacts on decoding. Finally, we note that the mapping of the spatial distribution of the highest-contributing electrodes to decoding resulted in a sparse but distributed network lateralized to the right hemisphere with a bilateral anterior contribution suggesting that specificity of the cortical representation of the right limb’s role in walking is contained in the EEG signal. Our scalp maps allowed us to map electrode locations on the scalp surface according to the maximal amount of information that they might carry about each gait parameter. Remarkably, the scalp maps were different across gait parameters, that is, the amount and type of information about gait were different across electrode sites. As noted above, the same network was used for decoding both walking conditions. Overall, these results demonstrate the feasibility of employing a noninvasive EEG-based BMI for the restoration of gait. This view is supported by functional MRI (fMRI) studies in which cortical activation was detected when subjects imagined themselves walking (Bakker et al. 2007, 2008; Iseki et al. 2008) and when paraplegic patients imagined foot and leg movements (Alkadhi et al. 2005; Cramer et al. 2005; Hotz-Boendermaker et al. 2008). A cortically EEG-driven BMI for the restoration or rehabilitation of walking could be also used as a strategy to harness or potentiate the remaining functionality and plasticity of spinal cord circuits isolated from the brain (Behrman et al. 2006; Grasso et al. 2004; Lunenburger et al. 2006) and as a new tool for assessing the cortical contributions to walking in health and disease, or to study the changes in these contributions during learning and adaptation. Conclusion. We have shown the feasibility of decoding human walking under precision (attentive, requiring visually guided foot placement) and normal (subject’s gaze was straight ahead) conditions by using scalp EEG with as few as 16 electrodes. The fact that these two conditions were decoded by using the same optimal set of electrodes of the decoder calibrated in the more complex precision walking task attests to the robustness of the decoding approach. Future studies should investigate the applicability of the present findings to the development of BMIs and the suitability of the proposed approach to examine cortical plasticity during gait rehabilitation. ACKNOWLEDGMENTS We thank Dr. Richard F. Macko for his support and valuable discussions during the performance of this study. GRANTS This research has been supported by the University of Maryland College Park-University of Maryland-Baltimore Seed Grant Program to J. L. Contreras-Vidal and L. Forrester. Support by NIH RO1-NS075889-01 and by the Department of Veterans Affairs (VA) Maryland Exercise & Robotics Center of Excellence (VA RR&D B3688R) and by the University of Maryland’s Department of Kinesiology Graduate Student Research Initiative Fund is gladly acknowledged. DISCLOSURES No conflicts of interest, financial or otherwise, are declared by the author(s).
106 • OCTOBER 2011 •
www.jn.org
Downloaded from jn.physiology.org on October 17, 2011
activity was localized to the frontal and temporal electrodes in the specific frequency band we used for decoding (delta, ⬍4 Hz). Therefore, in our study frontal and temporal electrodes were removed from the analysis. Third, correlation values were also calculated between baseline EEG signals band-pass filtered at 0.1–2 Hz and gait kinematics (⬍3 Hz) and compared with EEG signals acquired during walking, which we hypothesized contained relevant information about gait parameters. Indeed, our results showed that attempting to map baseline EEG signals to gait parameters resulted in extremely low decoding: As a representative example, the r and SNR values for the ankle joint angle for our best-decoded subject (S4) were 0.05 ⫾ 0.07 and ⫺15.27 ⫾ 33.27, respectively, for the baseline EEG signals, whereas decoding accuracies were high (0.87 ⫾ 0.01 and 6.1 ⫾ 0.59 for r and SNR, respectively) when using EEG signals acquired during the walking task, confirming that EEG signals measured during walking contained detailed cortical information about gait parameters. Fourth, to rule out the presence of mechanical artifacts introduced by motion of the EEG cables or walking itself, we computed the PLV among sensors. The rationale was that potential motion artifacts due to EEG wires or the subject’s motion would affect all sensors equally. To assess the PLV with wavelet analysis, the significance threshold value was set based on the values calculated by Lachaux et al. (2002). In our case, since we used 6 cycles (nco) for the wavelets and 10 cycles (ncy) for the integration window, the significance threshold was estimated to be 0.71. We applied such analysis to both the baseline EEG and the walking EEG conditions. Our results suggest that mechanical artifacts did not play a role in decoding. As a representative example, the mean PLVs across electrodes of our best subject (S4) for the ankle joint angle kinematics during walking were 0.55 ⫾ 0.08 at 1 Hz, 0.53 ⫾ 0.05 at 2 Hz, and 0.54 ⫾ 0.06 average across 1–2 Hz (the lower bounds for gait cycles were ⱖ1 Hz). Remarkably, when the baseline EEG condition was used, the mean values across electrodes were 0.37 ⫾ 0.02 (at 1 Hz), 0.49 ⫾ 0.03 (at 2 Hz), and 0.43 ⫾ 0.01 (mean of 1 and 2 Hz), which were comparable to those during walking, suggesting lack of mechanical coupling due to concerted wire movement. Fifth, we note that our decoding accuracies were high independently of whether the reconstructed parameters were linear or angular gait kinematics. It is very unlikely that a (global) motion artifact would affect or influence equally both types of gait parameters. For example, mechanical artifacts due to up-down motion would be expected to affect the decoding of vertical trajectories of the hip, ankle, and knee joints but not the decoding of angular joint velocities, as they are not linearly related. Nevertheless, the motion of the center of mass (COM), which would be expected to be directly related to that of any upward/downward movement of the EEG wires due to the subject’s mechanical motion, was very small (sacrum’s vertical movement in meters: subject 1 ⫽ ⫺0.01 ⫾ 0.015, subject 2 ⫽ 0.0006 ⫾ 0.007, subject 3 ⫽ ⫺0.006 ⫾ 0.015, subject 4 ⫽ ⫺0.005 ⫾ 0.013, subject 5 ⫽ ⫺0.0095 ⫾ 0.016, subject 6 ⫽ ⫺0.007 ⫾ 0.012). In addition to this, decoding of angular velocities (not linearly related with the 3D translational movements of the cables or the sacrum) for the ankle, hip, and knee resulted in high decoding accuracies that were comparable to those of the joint angle and Cartesian positions. Furthermore, it is unlikely that the motion artifact would have been the
1885
1886
NEURAL DECODING OF TREADMILL WALKING FROM EEG SIGNALS
AUTHOR CONTRIBUTIONS J. L. Contreras-Vidal conceived the research; J. L. Contreras-Vidal designed the experiment with assistance from L. Forrester; A. Presacco, L. Forrester, and R. Goodman performed the research at the VA Medical Center; A. Presacco and J. L. Contreras-Vidal designed the decoders and analyzed the data at University of Maryland-College Park; A. Presacco and J. L. Contreras-Vidal wrote the paper; and L. Forrester and R. Goodman edited the manuscript.
REFERENCES
J Neurophysiol • VOL
106 • OCTOBER 2011 •
www.jn.org
Downloaded from jn.physiology.org on October 17, 2011
Acharya S, Fifer MS, Benz HL, Crone NE, Thakor N. Electrocorticographic amplitude predicts finger positions during slow grasping motions of the hand. J Neural Eng 7: 046002, 2010. Alkadhi H, Brugger P, Boendermarker SH, Crelier G, Curt A, HeppReymond MC, Kollias SS. What disconnection tells about motor imagery: evidence from paraplegic patients. Cereb Cortex 15: 131–140, 2005. Alpaydin E. Introduction to Machine Learning. Cambridge, MA: MIT Press, 2004, p. 254. Bakker M, de Lange FP, Stevens JA, Toni I, Bloem BR. Motor imagery of gait: a quantitative approach. Exp Brain Res 179: 497–504, 2007. Bakker M, de Lange FP, Helmich RC, Scheeringa R, Bloem BR, Toni I. Cerebral correlates of motor imagery of normal and precision gait. Neuroimage 41: 998 –1010, 2008. Ball T, Schulze-Bonhage A, Aertsen A, Mehring C. Differential representation of arm movement direction in relation to cortical anatomy and function. J Neural Eng 6: 016006, 2009. Behrman AL, Bowden MG, Nair PM. Neuroplasticity after spinal cord injury and training: an emerging paradigm shift in rehabilitation and walking recovery. Phys Ther 86: 1406 –1425, 2006. Bradberry TJ, Contreras-Vidal JL, Rong F. Decoding hand and cursor kinematics from magnetoencephalographic signals during tool use. Conf Proc IEEE Eng Med Biol Soc 2008: 5306 –5309, 2008. Bradberry TJ, Rong F, Contreras-Vidal JL. Decoding center-out hand velocity from MEG signals during visuomotor adaptation. Neuroimage 47: 1691–1700, 2009a. Bradberry TJ, Gentili R, Contreras-Vidal JL. Decoding three dimensional hand kinematics from electroencephalographic signals. Conf Proc IEEE Eng Med Biol Soc 2009: 5010 –5013, 2009b. Bradberry TJ, Gentili RJ, Contreras-Vidal JL. Reconstructing three-dimensional hand movements from noninvasive electroencephalographic signals. J Neurosci 30: 3432–3437, 2010. Bradberry TJ, Gentili RJ, Contreras-Vidal JL. Fast attainment of computer cursor control with noninvasively acquired brain signals. J Neural Eng 8: 036010, 2011. Carmena JM, Lebedev MA, Crist RE, O’Doherty JE, Santucci DM, Dimitrov DF, Patil PG, Henriquez CS, Nicolelis MA. Learning to control a brain-machine interface for reaching and grasping by primates. PLoS Biol 1: E42, 2003. Choi JT, Bastian AJ. Adaptation reveals independent control networks for human walking. Nat Neurosci 10: 1055–1062, 2007. Christensen LO, Andersen JB, Sinkjaer T, Nielsen J. Transcranial magnetic stimulation and stretch reflexes in the tibialis anterior muscle during human walking. J Physiol 531: 545–557, 2001. Cramer SC, Lastra L, Lacourse MG, Cohen MJ. Brain motor system function after chronic, complete spinal cord injury. Brain 128: 2941–2950, 2005. Delorme A, Makeig S. EEGLAB: an open source toolbox for analysis of single-trial EEG dynamics including independent component analysis. J Neurosci Methods 134: 9 –21, 2004. Dobkin BH, Firestine A, West M, Saremi K, Woods R. Ankle dorsiflexion as an fMRI paradigm to assay motor control for walking during rehabilitation. Neuroimage 32: 370 –381, 2004. Fitzsimmons NA, Lebedev MA, Peikon ID, Nicolelis MA. Extracting kinematic parameters for monkey bipedal walking from cortical neuronal ensemble activity. Front Integr Neurosci 3: 3, 2009. Goncharova II, McFarland DJ, Vaughan JR, Wolpaw JR. EMG contamination of EEG: spectral and topographical characteristics. Clin Neurophysiol 114: 1580 –1593, 2003. Gramann K, Gwin JT, Bigdely-Shamlo N, Ferris DP, Makeig S. Visual evoked responses during standing and walking. Front Hum Neurosci 4: 202, 2010.
Grasso R, Ivanenko YP, Zago M, Molinari M, Scivoletto G, Castellano V, Macellari V, Lacquaniti F. Distributed plasticity of locomotor pattern generators in spinal cord injured patients. Brain 127: 1019 –1034, 2004. Grillner S, Wallén P, Saitoh K, Kozlov A, Robertson B. Neural bases of goal-directed locomotion in vertebrates: an overview. Brain Res Rev 57: 2–12, 2008. Gwin JT, Grasman K, Makeig S, Ferris DP. Removal of movement artifact from high-density EEG recorded during walking and running. J Neurophysiol 103: 3526 –3534, 2010. Gwin JT, Grasman K, Makeig S, Ferris DP. Electrocortical activity is coupled to gait cycle phase during treadmill walking. Neuroimage 54: 1289 –1296, 2011. Harada T, Miyai I, Kubota K. Gait capacity affects cortical activation patterns related to speed control in the elderly. Exp Brain Res 193: 445–454, 2009. Heuninckx S, Wenderoth N, Debaere F, Peeters R, Swinnen SP. Neural basis of aging: the penetration of cognition into action control. J Neurosci 25: 6787– 6796, 2005. Heuninckx S, Wenderoth N, Swinnen SP. Systems neuroplasticity in the aging brain: recruiting additional neural resources for successful motor performance in elderly persons. J Neurosci 28: 91–99, 2008. Hotz-Boendermarker S, Funk M, Summers P, Brugger P, Hepp-Reymond MC, Curt A, Kollias S. Preservation of motor programs in paraplegics as demonstrated by attempted and imagined foot movements. Neuroimage 39: 383–394, 2008. Ince NF, Gupta R, Arica S, Tewfik AH, Ashe J, Pellizzer G. High accuracy decoding of movement target direction in non-human primates based on common spatial patterns of local field potentials.. PLoS One 5: e14384, 2010. Iseki K, Hanakawa T, Shinozaki J, Nankaku M, Fukuyama H. Neural mechanisms involved in mental imagery and observation of gait. Neuroimage 41: 1021–1031, 2008. Jerbi K, Lachaux JP, N’Diaye K, Pantazis D, Leahy RM, Garnero L, Baillet S. Coherent neural representation of hand speed in humans revealed by MEG imaging. Proc Natl Acad Sci USA 104: 7676 –7681, 2007. Lachaux JP, Rodriguez E, Le Van Quyen M, Lutz A, Martinerie J, Varela FJ. Studying single-trials of phase synchronous activity in the brain. J Bif Chaos 10: 2429 –2439, 2000. Lachaux JP, Lutz A, Rudrauf D, Cosmelli D, Le Van Quyen M, Martinerie J, Varela FJ. Estimating the time-course of coherence between singletrial brain signals: an introduction to wavelet coherence. Clin Neurophysiol 32: 157–174, 2002. Luft A, Smith GV, Forrester L, Whitall G, Macko RF, Hauser TK, Goldberg AP, Hanley DF. Comparing brain activation associated with isolated upper and lower limb movement across corresponding joints. Hum Brain Mapp 17: 131–140, 2002. Lunenburger L, Bolliger M, Czell D, Muller R, Dietz V. Modulation of locomotor activity in complete spinal cord injury. Exp Brain Res 174: 638 – 646, 2006. Lv J, Yuanqing L, Zhenghui G. Decoding hand movement velocity from electroencephalogram signals during a drawing task. Biomed Eng Online 9: 64, 2010. Miyai I, Tanabe HC, Sase I, Eda H, Oda I, Konishi I, Tsunazawa Y, Suzuki T, Yanagida T, Kubota K. Cortical mapping of gait in humans: a near-infrared spectroscopy topography study. Neuroimage 14: 1186–1192, 2001. Nielsen JB. How we walk: central control of muscle activity during human walking. Neuroscientist 9: 195–204, 2003. Onton J, Delorme A, Makeig S. Frontal midline EEG dynamics during working memory. Neuroimage 27: 341–356, 2005. Pfurtscheller G, Brunner C, Schlögl A, Lopes da Silva FH. Mu rhythm (de)synchronization and EEG single-trial classification of different motor imagery tasks. Neuroimage 31: 153–159, 2006. Rossignol S, Schwab M, Schwartz AB, Fehlings MG. Spinal cord injury: time to move? J Neurosci 27: 11782–11792, 2007. Sahyoun C, Floyer-Lea A, Johansen-Berg H, Matthews PM. Towards an understanding of gait control: brain activation during the anticipation, preparation and execution of foot movements. Neuroimage 21: 568 –575, 2004. Suzuki M, Miyai I, Ono T, Oda I, Konishi I, Kochiyama T, Kubota K. Prefrontal and premotor cortex are involved in adapting walking and running speed on the treadmill: an optical imaging study. Neuroimage 23: 1020 –1026, 2004. Suzuki M, Miyai I, Ono T, Kubota K. Activities in the frontal cortex and gait performance are modulated by preparation. An fNIRS study. Neuroimage 39: 600 – 607, 2008.
NEURAL DECODING OF TREADMILL WALKING FROM EEG SIGNALS Tallon-Baudry C, Bertrand O, Delpuech C, Pernier J. Oscillatory ␥-band (30 –70 Hz) activity induced by a visual search task in humans. J Neurosci 17: 722–734, 1997. Tononi G, Riedner BA, Hulse BK, Ferrarelli F, Sarasso S. Enhancing sleep slow waves with natural stimuli. Medicamundi 54: 82– 88, 2010. Tsuchiya N, Kawasaki H, Oya H, Howard MA 3rd, Adolphs R. Decoding face information in time, frequency and space from direct intracranial recordings of the human brain. PLoS One 3: e3892, 2008. Van den Broek SP, Reinders F, Donderwinkel M, Peters MJ. Volume conduction effects in EEG and MEG. Electroencephalogr Clin Neurophysiol 64: 159 –170, 1998.
1887
Waldert S, Preissl H, Demandt E, Braun C, Birbaumer N, Aertsen E, Mehring C. Hand movement direction decoded from MEG and EEG. J Neurosci 28: 1000 –1008, 2008. Wieser M, Haefeli J, Butler L, Jancke L, Riener R, Koeneke S. Temporal and spatial patterns of cortical activation during assisted lower limb movement. Exp Brain Res 203: 181–191, 2010. Yogev-Seligmann G, Hausdorff JM, Giladi N. The role of executive function and attention in gait. Mov Disord 23: 329 –342, 2008. Zhuang J, Truccolo W, Vargas-Irwin C, Donoghue JP. Decoding 3-D reach and grasp kinematics from high-frequency local field potentials in primate primary motor cortex. IEEE Trans Biomed Eng 57: 1774 –1784, 2010.
Downloaded from jn.physiology.org on October 17, 2011
J Neurophysiol • VOL
106 • OCTOBER 2011 •
www.jn.org